

1. What is Chande Forecast Oscillator?
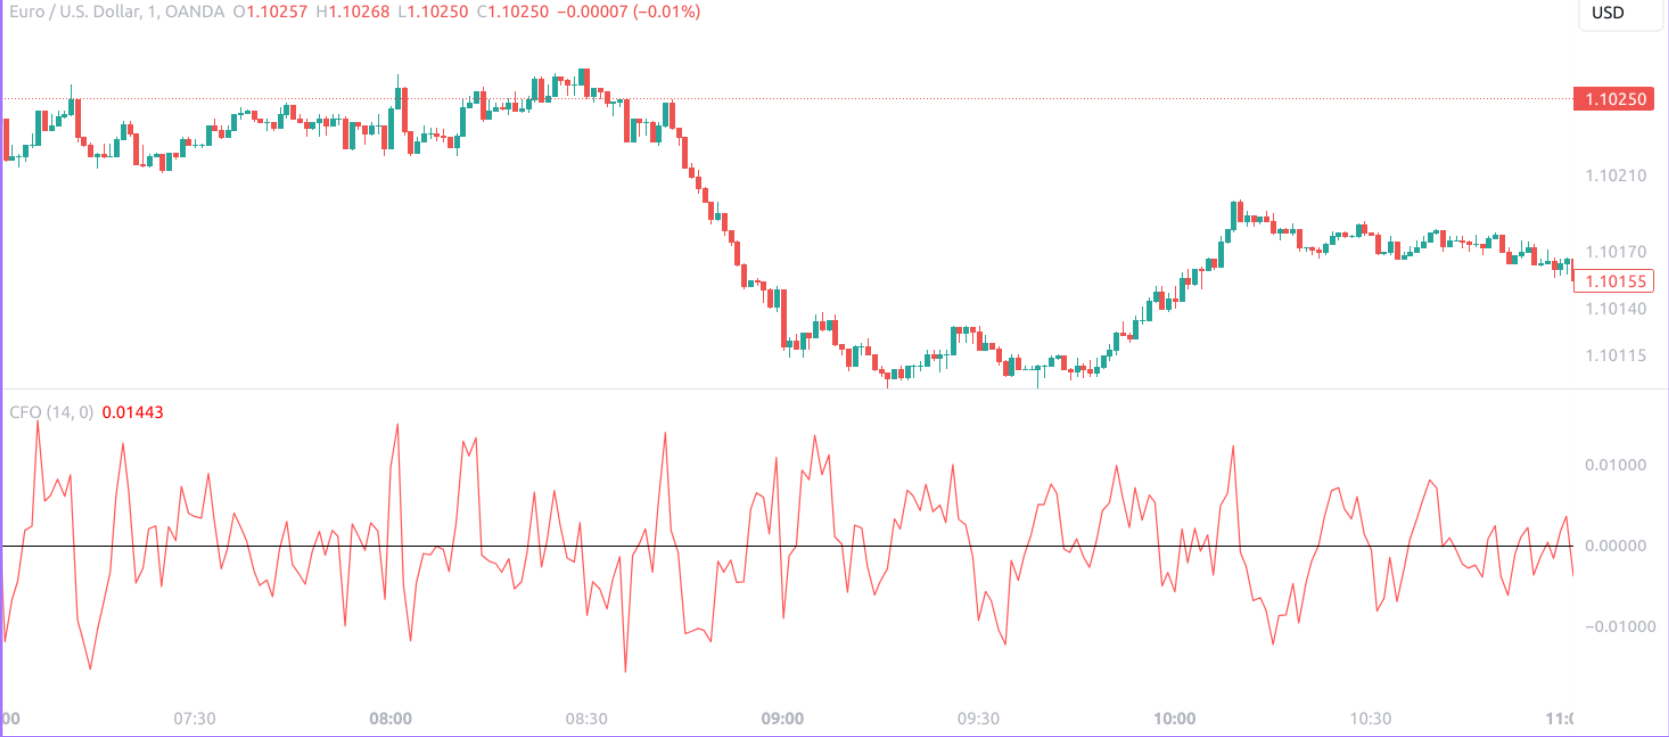
The Chande Forecast Oscillator (CFO) is a momentum indicator developed by Tushar Chande, designed to predict future price movements by comparing the current price to the past average price over a specific period. The CFO oscillates around a zero line, which is central to its interpretation. Values above zero suggest an upward price trend, indicating bullish conditions, whereas values below zero imply a downward price trend, signaling bearish conditions.
The oscillator is calculated by subtracting the n-period moving average from the current price, dividing the result by the n-period moving average, and then multiplying by 100. This formula can be represented as:
CFO = [(Current Price - n-period MA) / n-period MA] * 100
Traders often use the CFO to identify overbought or oversold conditions. A reading above a certain positive threshold may indicate an overbought market, suggesting a potential reversal to the downside. Conversely, a reading below a certain negative threshold could signal an oversold market, hinting at a potential upward reversal.
2. How to Set Up the Chande Forecast Oscillator?
2.1. Selecting the Right Time Frame
Selecting the right time frame for utilizing the Chande Forecast Oscillator (CFO) is crucial and should be dictated by the trader’s specific goals and the nature of their trading strategy. The chosen time frame will affect the oscillator’s behavior, with shorter time frames generally leading to a greater number of trading signals, which may or may not be actionable.
Intraday Traders often gravitate towards shorter time frames, where the CFO can help in capitalizing on quick price movements. They might use a 5-minute chart, where the CFO will respond rapidly to price changes, but with a higher potential for false signals.
Swing Traders tend to focus on intermediate time frames, looking for opportunities that develop over several days or weeks. A 1-hour chart could be a suitable middle ground, offering a balance between signal frequency and reliability.
Long-term Investors usually analyze longer time frames to understand the broader trend and reduce the impact of short-term volatility. A daily chart could provide a clear view of the market’s direction over weeks or months, with the CFO offering insights into longer-term momentum.
| Trader Type | Time Frame | CFO Period Suggestion |
|---|---|---|
| Intraday Trader | 1-minute to 15-minute | Shorter (e.g., 5-10 days) |
| Swing Trader | 1-hour to 4-hour | Intermediate (e.g., 10-20 days) |
| Long-term Investor | Daily to Weekly | Longer (e.g., 20-50 days) |
The CFO period should be selected in tandem with the time frame. Shorter periods result in a more sensitive oscillator, which may be suitable for those seeking to respond quickly to price changes, while longer periods yield a smoother oscillator curve, which may be beneficial for those looking to filter out market noise and focus on significant trends.
The selection process involves backtesting various combinations of time frames and CFO periods to determine which settings offer the best performance for a given market and trading style. It is essential to remember that no single combination will be universally optimal.
2.2. Adjusting Oscillator Sensitivity
Adjusting the sensitivity of the Chande Forecast Oscillator (CFO) is a critical step in customizing the tool to align with a trader’s strategy and risk tolerance. Sensitivity adjustments are made by changing the length of the moving average period in the CFO’s formula. The n-period moving average serves as the denominator and is pivotal in dictating how quickly the CFO reacts to price movements.
Shortening the period will make the CFO more sensitive to recent price changes, which can be advantageous for traders looking for early signals. However, this increased sensitivity comes at the cost of potentially more false positives, as the oscillator might respond too eagerly to minor price fluctuations.
Lengthening the period smooths out the CFO, reducing the number of signals and the likelihood of false positives, but also increasing the lag time, which might cause traders to enter or exit trades later than ideal.
Traders must balance the need for timely signals against the risk of false signals. To achieve this, they can experiment with different period lengths to find a sweet spot that offers a reasonable number of reliable signals for their trading style. This process typically involves backtesting and analyzing the CFO’s performance over historical data.
Below is an example of how period adjustments might affect the CFO’s sensitivity:
| CFO Period Length | Sensitivity | Signal Frequency | Signal Reliability |
|---|---|---|---|
| 5-day | High | High | Low |
| 10-day | Moderate | Moderate | Moderate |
| 20-day | Low | Low | High |
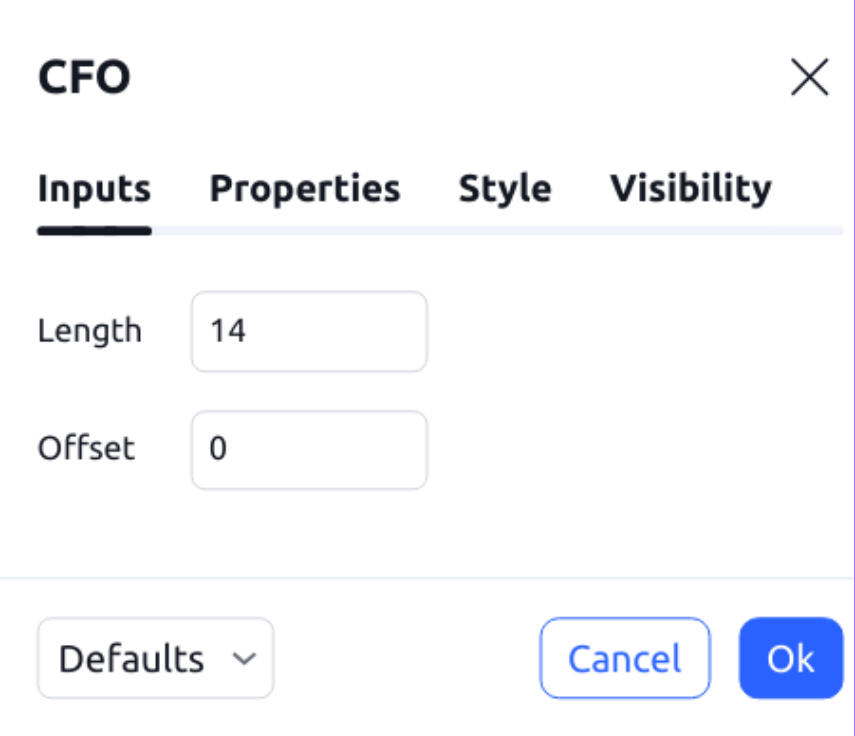
To adjust the sensitivity in charting software, traders should:
- Access the CFO settings within the charting platform.
- Modify the n-period value to a suitable number based on their analysis and backtesting results.
- Observe the changes in CFO behavior on the chart and refine as needed.
It is essential to note that market conditions can also influence the ideal period length. For instance, in highly volatile markets, a longer period may help to filter out noise, while in more stable markets, a shorter period could provide more responsive signals. Adjustments should not be static; traders should be prepared to re-evaluate and modify the CFO settings as market conditions evolve.
2.3. Integrating with Charting Software
Integrating the Chande Forecast Oscillator (CFO) with charting software is a straightforward process that enhances a trader’s ability to analyze market momentum and make informed decisions. The integration typically involves a few simple steps:
- Open the charting platform and select the asset or security of interest.
- Access the indicators library and choose the CFO from the available options.
- Define the n-period based on prior analysis and the desired sensitivity level.
- Customize visual aspects such as line color and thickness for clarity.
Advanced charting platforms may offer additional features like:
- Threshold Alerts: Set up notifications for when the CFO crosses predefined levels.
- Historical Backtesting: Evaluate the CFO’s past performance on the asset’s price history.
- Overlay with Other Indicators: Combine the CFO with other technical analysis tools for comprehensive insights.
Integration enables traders to observe the CFO in real-time and adjust their strategies accordingly. As the CFO fluctuates, it provides visual cues on potential entries and exits based on momentum shifts.
| Integration Step | Action Required | Purpose |
|---|---|---|
| Indicator Selection | Choose CFO from indicators library | To add the CFO to the trading chart |
| Period Definition | Set the n-period | To adjust the CFO’s sensitivity |
| Visual Customization | Customize line color and thickness | To enhance the visibility of the CFO |
| Feature Utilization | Set alerts, backtest, combine with others | To leverage full functionality |
3. How to Use Chande Forecast Oscillator?
3.1. Identifying Overbought and Oversold Conditions
Identifying overbought and oversold conditions with the Chande Forecast Oscillator (CFO) involves monitoring its readings in relation to specific thresholds. These thresholds are not fixed and can be adjusted based on historical performance and volatility of the asset in question. Commonly, traders might consider a reading above +50 to be indicative of an overbought condition, while a reading below -50 could denote an oversold state.
| Asset Condition | CFO Threshold | Interpretation |
|---|---|---|
| Overbought | > +50 | Potential for downward correction |
| Oversold | < -50 | Potential for upward correction |
Divergence plays a pivotal role in validating the signals provided by the CFO. A bullish divergence—where price action shows a lower low, and the CFO shows a higher low—can be interpreted as a strengthening upward momentum. Similarly, a bearish divergence—where the price makes a higher high while the CFO makes a lower high—may signal weakening upward momentum and a potential trend reversal.
| Price Action | CFO Action | Divergence Type | Implication |
|---|---|---|---|
| Lower Low | Higher Low | Bullish | Strengthening upward momentum |
| Higher High | Lower High | Bearish | Weakening upward momentum |
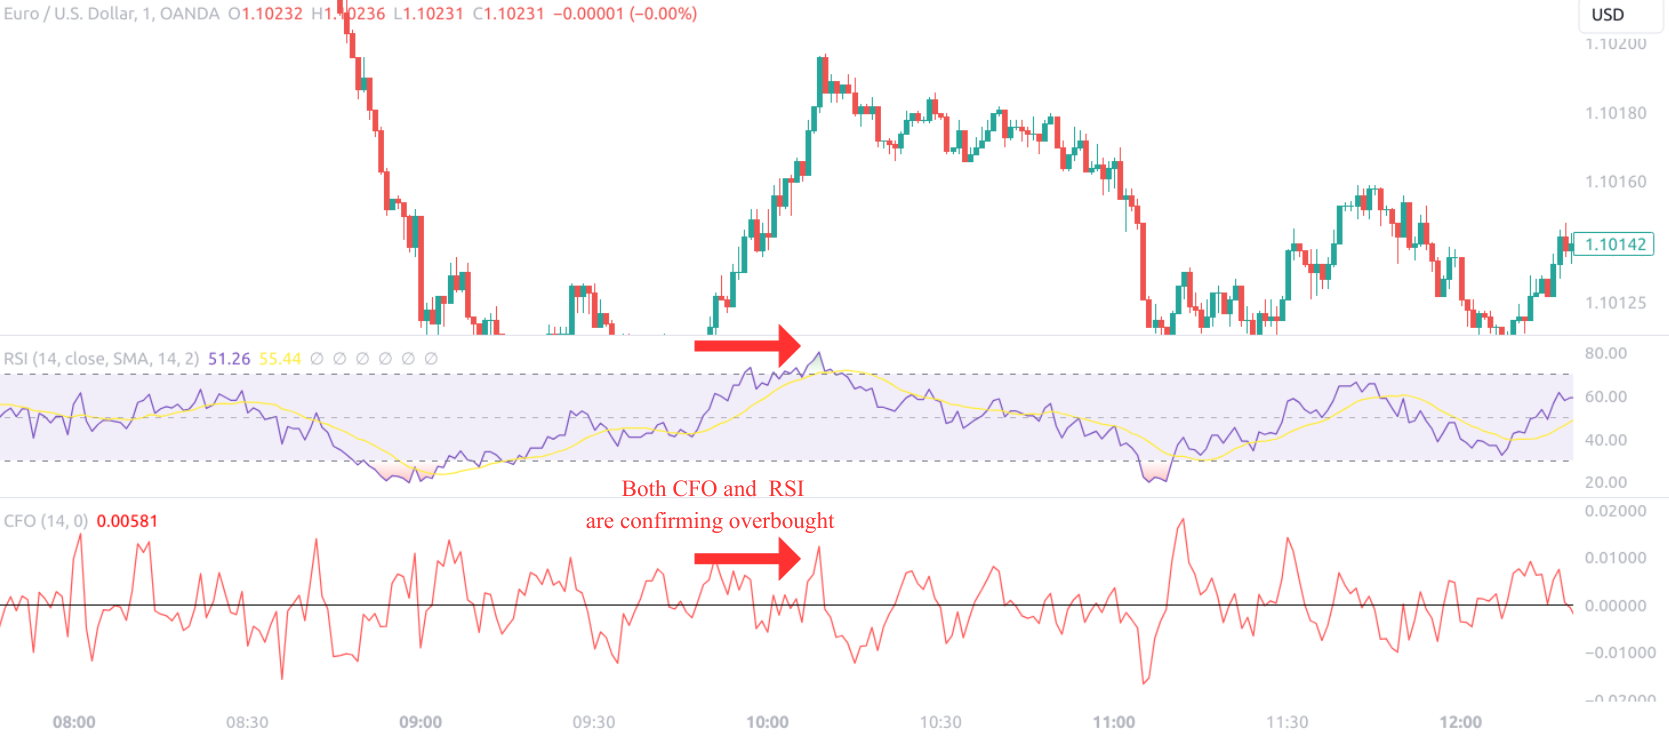
Combining the CFO with other technical indicators can provide a more robust framework for decision-making. For instance, the Relative Strength Index (RSI) and Moving Average Convergence Divergence (MACD) are commonly used in tandem with the CFO to confirm overbought or oversold conditions.
| Indicator Combination | Purpose |
|---|---|
| CFO + RSI | Confirm overbought/oversold conditions |
| CFO + MACD | Validate momentum and potential reversals |
Incorporating these additional layers of analysis helps traders discern between genuine trading opportunities and false signals. It’s essential to consider the broader market context and to apply risk management practices to safeguard against adverse moves.
3.2. Spotting Divergence for Reversal Signals
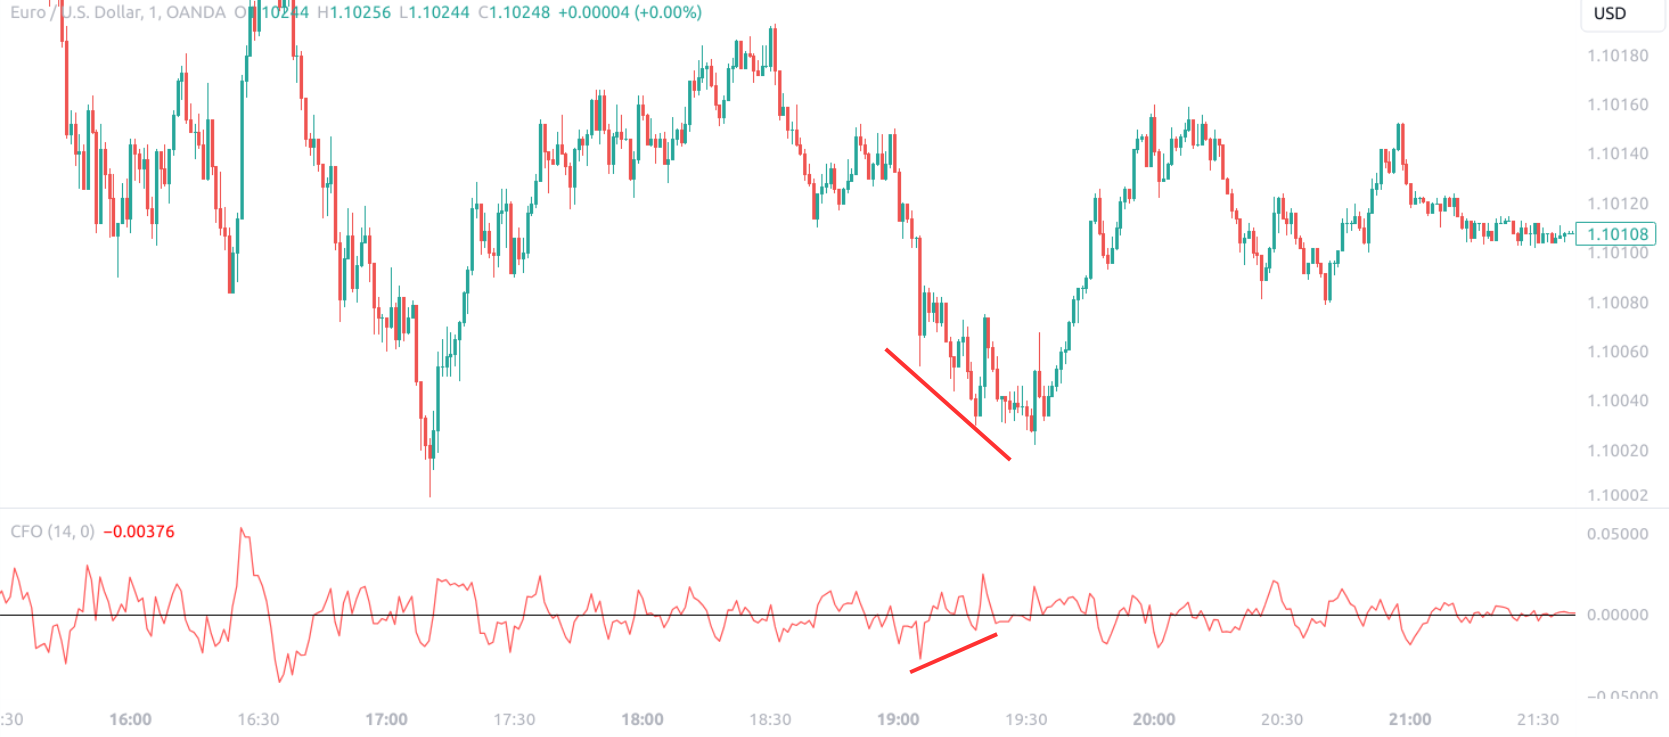
Spotting divergence with the Chande Forecast Oscillator (CFO) is a valuable technique for traders seeking to identify potential reversal signals. Divergence occurs when there is a discrepancy between the price movement and the momentum as indicated by the CFO. This discrepancy often precedes a change in the price direction, making it an essential concept for traders to understand and utilize effectively.
Bullish divergence is identified when the price forms a new low while the CFO forms a higher low. This indicates that the downward price movement is losing momentum and that a reversal to the upside may be imminent.
Bearish divergence occurs when the price achieves a new high while the CFO creates a lower high. This suggests that the upward price movement is running out of steam and that a reversal to the downside could be approaching.
| Price Trend | CFO Trend | Type of Divergence | Expected Price Movement |
|---|---|---|---|
| Descending (Lower Lows) | Ascending (Higher Lows) | Bullish | Potential Reversal Upward |
| Ascending (Higher Highs) | Descending (Lower Highs) | Bearish | Potential Reversal Downward |
Traders monitoring the CFO for divergence should also pay attention to the strength of the divergence. A stronger divergence, where the difference between the price lows (for bullish divergence) or price highs (for bearish divergence) and the CFO readings is more pronounced, may indicate a more robust potential reversal.
Divergence does not guarantee a reversal; it is a signal that the current trend is weakening. Traders should look for additional confirmation, such as a break of trend lines or patterns on the price chart, volume analysis, or confirmation from other indicators.
The effectiveness of divergence as a signal can be influenced by the prevailing market conditions. In strong trending markets, divergence may be less reliable. As such, it is advisable to use divergence in conjunction with other aspects of technical analysis to improve the probability of successful trade execution.
3.3. Combining with Other Technical Indicators
Combining the Chande Forecast Oscillator (CFO) with other technical indicators can offer traders a comprehensive analysis toolkit, enhancing the reliability of the signals and potentially leading to more informed trading decisions. The CFO’s momentum-based readings complement various types of indicators, including trend-following indicators, oscillators, and volume-based indicators.
Trend-following indicators such as Moving Averages (MA) or the Directional Movement Index (DMI) can be used to gauge the overall market trend. When the CFO indicates an overbought or oversold condition, confirmation from a trend-following indicator can help traders decide whether to trade in the direction of the trend or prepare for a potential reversal.
| Indicator Type | Example | Combined with CFO for |
|---|---|---|
| Trend-following | Moving Averages (MA) | Confirmation of trend strength |
| Oscillators | Relative Strength Index (RSI) | Confirming overbought/oversold conditions |
| Volume-based | On-Balance Volume (OBV) | Confirming momentum with volume |
Oscillators such as the Relative Strength Index (RSI) provide additional insights into overbought or oversold conditions. When both the CFO and RSI indicate an extremity in price conditions, it reinforces the potential for a market reversal.
Volume-based indicators, like On-Balance Volume (OBV), help confirm the strength of a trend or the likelihood of a reversal by showing whether volume is flowing into or out of a security. If the CFO shows a divergence and OBV confirms a volume-based shift in momentum, it can provide a stronger case for a trade.
Combining indicators effectively requires an understanding of each tool’s strengths and limitations. Traders should use a synergistic approach, ensuring that each indicator complements the other without providing redundant information. Overloading a trading strategy with too many indicators can lead to confusion and paralysis by analysis.
Moreover, it’s crucial to recognize that no indicator combination is foolproof. Each trading scenario is unique, and indicators should be used as part of a broader analysis strategy that takes into account market conditions, news, and economic data releases.
4. What is the Best Strategy for Chande Forecast Oscillator?
4.1. Trend Following Strategies
Trend Following Strategies capitalize on the directional movement of markets by aligning trades with the current trend. Traders using the Chande Forecast Oscillator (CFO) within this context focus on the oscillator’s ability to confirm the strength and sustainability of trends. A positive CFO reading is indicative of bullish momentum, making it a potential signal for entering a long position during an uptrend. Conversely, a negative CFO reading suggests bearish momentum, which could be a cue for initiating a short position during a downtrend.
| Trend Type | CFO Reading | Action |
|---|---|---|
| Uptrend | Positive | Consider buying |
| Downtrend | Negative | Consider selling |
To enhance the efficacy of Trend Following Strategies, traders often look for CFO crossovers above and below the zero line as confirmation of trend changes. A crossover from below to above the zero line may signal the start of an uptrend, while a crossover from above to below could indicate the beginning of a downtrend.
| CFO Crossover | From | To | Implication |
|---|---|---|---|
| Bullish | Below | Above | Possible uptrend |
| Bearish | Above | Below | Possible downtrend |
Incorporating moving averages with the CFO can further validate trend following signals. A common technique is to use a short-term moving average such as the 50-period MA and a long-term moving average like the 200-period MA. When both the CFO and moving averages indicate a trend direction, the signal is strengthened.
| Moving Average | Trend Confirmation | Combined with CFO |
|---|---|---|
| Short-term MA | Upward crossover | Bullish signal |
| Long-term MA | Downward crossover | Bearish signal |
Traders should be aware of the potential for lag in moving averages and the CFO, which can sometimes result in delayed entry signals. To mitigate this, they may employ additional tools such as price action analysis or volume indicators to pinpoint more precise entry points.
Risk management remains a cornerstone of Trend Following Strategies. Stop-loss orders should be placed at logical levels to limit potential losses if the market moves against the trade. Moreover, traders should avoid overexposure by managing position sizes and using leverage judiciously.
| Risk Management Tool | Purpose |
|---|---|
| Stop-loss order | Cap potential losses |
| Position sizing | Control trade exposure |
| Leverage | Manage financial risk |
Ultimately, the success of Trend Following Strategies using the CFO is contingent on consistent application, regular review of strategy performance, and adaptability to changing market conditions.
4.2. Mean Reversion Techniques
Mean Reversion Techniques leverage the concept that prices tend to revert to their average over time. Traders applying these techniques with the Chande Forecast Oscillator (CFO) monitor for extreme readings that suggest a deviation from the mean, which could signal a potential price reversal.
The CFO provides a numerical value that represents the difference between the current price and the forecasted price based on a linear regression over the past n-periods. Extreme positive values may indicate overbought conditions, while extreme negative values can signal oversold conditions.
| CFO Reading | Market Condition | Mean Reversion Signal |
|---|---|---|
| Extremely Positive | Overbought | Sell for potential downward reversion |
| Extremely Negative | Oversold | Buy for potential upward reversion |
Traders using mean reversion strategies might establish thresholds based on historical performance to define these extreme conditions. A common approach is setting a standard deviation parameter around the mean to identify potential reversion points.
Bollinger Bands are often used in conjunction with the CFO for mean reversion strategies. Bollinger Bands consist of a moving average (the middle band) and two standard deviation lines (the upper and lower bands) plotted away from the moving average. Trades are considered when the price touches or breaches the bands in conjunction with extreme CFO readings.
| Bollinger Band Position | CFO Reading | Trade Consideration |
|---|---|---|
| Price at Upper Band | Extremely Positive | Potential short setup |
| Price at Lower Band | Extremely Negative | Potential long setup |
Mean reversion strategies assume that high volatility and large deviations from the mean are temporary. Thus, traders expect that after reaching an extreme value, the CFO will move back toward zero as prices revert to their mean.
| Volatility Condition | CFO Reading | Expected Outcome |
|---|---|---|
| High Volatility | Extreme CFO Value | Reversion to Mean |
It’s critical to consider the context in which mean reversion signals occur. For example, during strong trends, mean reversion may be less effective. Therefore, confirmation from other indicators or price patterns is advisable before executing trades.
| Confirmation Method | Purpose |
|---|---|
| Additional Indicators | Validate mean reversion signal |
| Price Patterns | Confirm potential reversal setup |
Risk management in mean reversion trading involves setting tight stop-loss orders to minimize the impact of incorrect predictions. Additionally, traders should be cautious with position sizing, especially in volatile markets, to protect their capital.
| Risk Management Tool | Utility |
|---|---|
| Stop-loss Order | Limit potential losses |
| Position Sizing | Prevent overexposure |
Mean Reversion Techniques using the CFO require discipline and a thorough understanding of the market’s behavior around its mean. Regular backtesting and strategy adjustments are essential to maintain relevance and effectiveness in various market conditions.
4.3. Breakout Trading Approaches
Breakout Trading Approaches harness the momentum that often accompanies significant price moves beyond established support or resistance levels. When applied to the Chande Forecast Oscillator (CFO), breakout strategies focus on the oscillator’s ability to detect an increase in momentum that may precede a price breakout.
Traders look for the CFO to breach a predefined threshold that signifies a breakout condition. These thresholds are derived from historical price action and oscillator behavior. A breakout to the upside, confirmed by the CFO moving above a positive threshold, suggests entering a long position. Conversely, a breakout to the downside, indicated by the CFO dropping below a negative threshold, may warrant a short position.
Breakout Confirmation with CFO:
| Price Action | CFO Threshold Breach | Trade Action |
|---|---|---|
| Above Resistance | CFO > Positive Threshold | Consider Long Position |
| Below Support | CFO < Negative Threshold | Consider Short Position |
To bolster the reliability of breakout signals, traders often combine the CFO with volume indicators. A breakout accompanied by high volume can be seen as more credible, as it implies a strong conviction among market participants.
Volume Confirmation for Breakouts:
| Volume Indicator | Breakout Volume | Implication |
|---|---|---|
| High Volume | Above Average | Stronger Breakout Signal |
While breakout trading can be lucrative, it is also associated with false breakouts. To mitigate this risk, traders may wait for the price to retest the broken support or resistance level before entering a trade. The CFO should remain beyond the threshold during the retest to maintain the validity of the breakout signal.
Retest Strategy for Breakouts:
| Price Action | CFO During Retest | Trade Validity |
|---|---|---|
| Retest of Level | CFO Holds Threshold | Valid Breakout Trade |
Another consideration for breakout traders is the time frame. Breakouts on longer time frames such as daily or weekly charts tend to be more significant than those on shorter time frames, which may experience more noise.
Time Frame Considerations for Breakouts:
| Time Frame | Breakout Significance |
|---|---|
| Longer (e.g., Daily, Weekly) | More Significant |
| Shorter (e.g., Hourly) | Less Significant |
Risk management in breakout trading is paramount, as the potential for rapid price moves can result in substantial losses. Traders should set stop-loss orders below the breakout level for long positions or above the breakout level for short positions. Additionally, profit targets can be established based on historical price movements following breakouts.
Risk Management in Breakout Trading:
| Risk Management Tool | Purpose |
|---|---|
| Stop-loss Order | Protect against reversal after breakout |
| Profit Target | Realize gains from expected price move |
5. What to Consider When Using Chande Forecast Oscillator?
5.1. Market Volatility Impact
Market volatility significantly impacts the performance of the Chande Forecast Oscillator (CFO). High volatility periods can lead to erratic CFO behavior, generating misleading signals that may result in suboptimal trade entries and exits. Therefore, traders must adjust their strategies and expectations accordingly when volatility spikes.
Volatility’s Effect on CFO Signals:
| Volatility Level | CFO Signal Reliability | Recommended Action |
|---|---|---|
| High | Decreased | Seek additional confirmation |
| Moderate | Standard | Trade with usual caution |
| Low | Increased | Consider higher confidence in signals |
In volatile markets, the CFO’s predictive accuracy diminishes, as the price can swing widely around the oscillator’s zero line. This can lead to frequent crossing of the zero line, which might be incorrectly interpreted as trend reversals or continuation signals.
CFO Performance in Relation to Volatility:
| CFO Behavior | Market Volatility | Interpretation |
|---|---|---|
| Frequent Zero Line Crossings | High | Potentially false trend signals |
| Stable Above/Below Zero Line | Low to Moderate | More reliable trend indication |
Traders can mitigate these issues by incorporating volatility filters such as the Average True Range (ATR) or Bollinger Bands. These tools help to contextualize the CFO readings by providing a volatility-adjusted perspective.
Utilizing Volatility Filters:
| Volatility Filter | Purpose | Combination with CFO |
|---|---|---|
| ATR | Measure market volatility | Adjust CFO sensitivity |
| Bollinger Bands | Define volatility thresholds | Confirm CFO signals within volatility context |
Adapting to Volatility:
- Reduce position size to manage risk during high volatility.
- Widen stop-loss parameters to accommodate larger price swings and avoid premature exits.
- Shorten the look-back period of the CFO to increase responsiveness to recent price action.
5.2. Risk Management Protocols
Effective risk management protocols are an integral component of trading strategies involving the Chande Forecast Oscillator (CFO). To safeguard against adverse market movements and preserve capital, traders must establish a comprehensive set of rules and tools that conform to their risk tolerance and trading objectives.
Key Risk Management Protocols with CFO:
| Protocol | Function | Implementation |
|---|---|---|
| Stop-Loss Orders | Limit potential losses | Set near recent swing highs/lows |
| Position Sizing | Control market exposure | Calculate based on account size & risk |
| Leverage | Manage financial risk | Use judiciously, aligned with risk level |
Stop-loss orders are paramount in preventing large drawdowns. They should be strategically placed at levels that invalidate the trade premise, often beyond key support or resistance points. This placement helps ensure that traders exit a position before incurring significant losses.
Position sizing determines the amount of capital allocated to a particular trade. The sizing should be based on a percentage of the total trading capital, ensuring that a single loss does not significantly impact the account balance. A common guideline is to risk no more than 1-2% of the account on any single trade.
Leverage amplifies both gains and losses. While it can increase profitability, it also raises the stakes of each trade. Traders should use leverage sparingly, always being mindful of the potential for amplified losses.
Monitoring and Adjusting Risk Parameters:
| Monitoring Aspect | CFO Relevance | Action Required |
|---|---|---|
| Market Volatility | Affects CFO signal accuracy | Adjust stop-loss and position size |
| Consecutive Losses | Indicates potential strategy inefficiency | Review and adapt trading strategy |
| Economic News | Can cause sudden market moves | Reduce position size or avoid trading pre-news |
Regular monitoring of market conditions is necessary to adjust risk parameters in real time. Increased market volatility may require wider stop-losses and reduced position sizes. Additionally, a series of losses might signal that the trading strategy, including the CFO settings, needs refinement.
Economic news releases can lead to sharp price movements. Traders should be aware of the economic calendar and adjust their risk management strategies accordingly, potentially by reducing position sizes or refraining from trading immediately before and after major announcements.
Best Practices for CFO Risk Management:
- Review trade outcomes to ensure adherence to risk management rules.
- Backtest strategies to validate the effectiveness of risk parameters in various market scenarios.
- Continuously educate oneself on market dynamics and risk management techniques to enhance decision-making.
By adhering to these risk management protocols, traders can mitigate the risks associated with CFO-based trading strategies, thereby enhancing their chances of long-term success in the markets.
5.3. Confirmation with Price Action
Confirmation with price action serves as a critical step in validating signals generated by the Chande Forecast Oscillator (CFO). It involves scrutinizing the price movements in conjunction with the oscillator’s readings to ensure a higher probability of successful trades. This process helps traders to filter out false signals and to act on those with stronger market confluence.
Key Price Action Confirmations for CFO Signals:
- Trend Line Breaks: A break of a significant trend line in conjunction with a CFO signal can indicate a stronger likelihood of a sustained move in the direction of the break.
- Candlestick Patterns: The presence of bullish or bearish candlestick formations can provide additional evidence for trade entries or exits.
- Support and Resistance: CFO signals that coincide with price bouncing off or breaking through key levels can offer more robust trade setups.
Price Action Confirmation Techniques:
| Technique | Description | CFO Correlation |
|---|---|---|
| Trend Line Breaks | Price crossing established trend lines | Align with CFO trend predictions |
| Candlestick Patterns | Recognizable price patterns on a chart | Confirm CFO reversal or continuation signals |
| Support and Resistance | Key levels where price has historically turned | Strengthen CFO overbought/oversold readings |
Traders may also employ chart patterns, such as triangles, flags, or wedges, to complement CFO signals. A chart pattern breakout aligned with a CFO trend indication can serve as a compelling reason to enter a trade.
Chart Pattern Confirmations:
| Chart Pattern | Price Action | CFO Confirmation |
|---|---|---|
| Triangle | Breakout | Trend Continuation |
| Flag | Pole Formation | Strong Trend Presence |
| Wedge | Reversal | Overbought/Oversold Condition |
Timing is another crucial aspect of price action confirmation. Traders should consider the time frame on which the CFO signal appears. Signals on higher time frames tend to be more significant and less prone to noise compared to those on lower time frames.
Time Frame Analysis for CFO Signals:
| Time Frame | Signal Significance | Noise Level |
|---|---|---|
| Higher (e.g., Daily) | More significant | Lower |
| Lower (e.g., 1H, 15M) | Less significant | Higher |
Ultimately, price action confirmation helps to align CFO signals with the underlying market dynamics, offering traders a more holistic view of potential trade opportunities. This synergy between the oscillator and price behavior enhances the decision-making process and can lead to more consistent trading outcomes.


