What is the Visible Range Volume Profile?
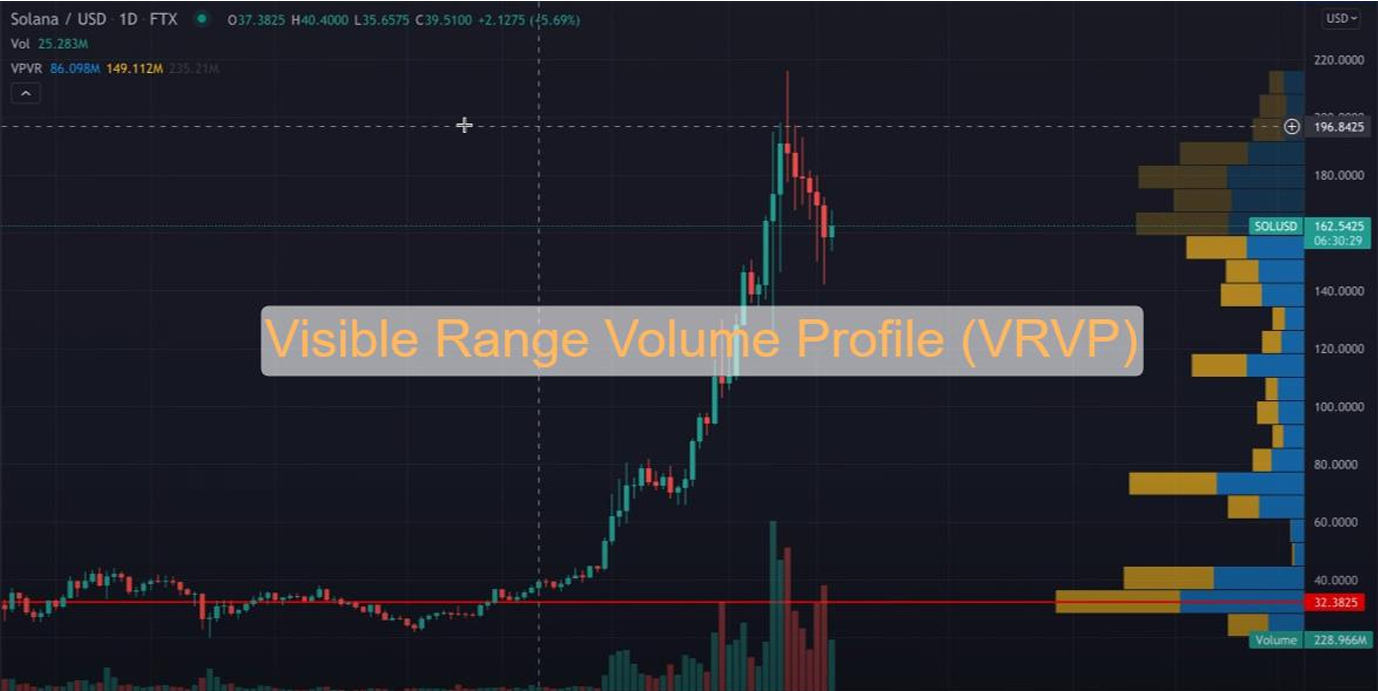
Visible Range Volume Profile shows the amount of trading volume at each price level within your current chart view. Unlike traditional volume indicators that show volume over time, VRVP displays volume distribution across different price levels.
The key advantage is automatic updates. When you zoom in or scroll your chart, VRVP recalculates instantly. This gives you real-time insight into where the most trading activity occurred in your visible price range.
Why VRVP Matters for Traders?
Here is why VRVP has been the top choice for world-class traders:
- Institution footprints revealed: Large traders and institutions leave volume signatures at specific price levels. VRVP shows you exactly where they accumulated or distributed positions.
- Dynamic support and resistance levels: Traditional support and resistance lines are static. VRVP creates dynamic levels based on actual trading activity, making them more reliable.
- Market sentiment at specific prices: High volume areas show market acceptance. Low volume areas show rejection or lack of interest.
How to Use Visible Range Volume Profile in Trading?
Setting up VRVP takes exactly 2 minutes. Follow these steps on TradingView to start trading with volume-based levels immediately.
Step 1: Open any chart on TradingView. Click “Indicators” at the top of your screen.
Step 2: Search for “Volume Profile Visible Range” or “VPVR.” Click to add it to your chart.
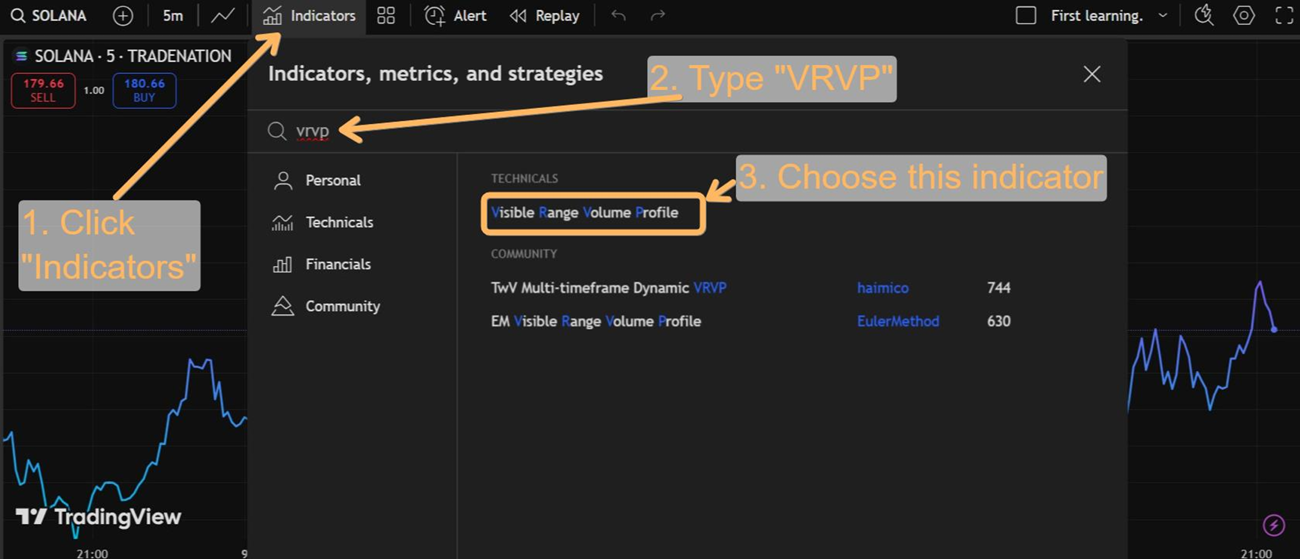
Pro tip: The use of VRVP is almost similar on all the platforms. All you need to find the indicators section, search VRVP and you can easily use it.
Configure Basic Settings
To get the best results with the VRVP, configure the indicator and use proper settings. Right-click on the VPVR and select “Settings.” Here are the most optimum basic settings for the indicator:
| Setting | Beginner Value | Purpose |
| Row Size | 20 | Shows clear volume levels without clutter |
| Value Area | 70% | Industry standard for volume concentration |
| Volume Type | Total | Simpler than up/down volume split |
How to Use VRVP with Other Indicators?
No indicator is perfect. The best way to use VRVP is to implement it with other indicators to strengthen your analysis. Here is how you can use this indicator with other indicators:
Popular Combinations:
VRVP + RSI: Use RSI to confirm momentum when price reaches volume levels. Buy at VAL when RSI shows oversold. Sell at VAH when RSI shows overbought.
VRVP + Moving Averages: Combine volume levels with trend context. Trade volume bounces in the direction of the 20-period moving average.
VRVP + Fibonacci levels: When Fibonacci retracements align with HVNs, these become high-probability reversal zones.
How to Read Visible Range Volume Profile?
Reading VRVP correctly determines your trading success. The visual elements reveal market psychology and institutional activity at specific price levels.
Learn and Understand the Visual Elements
First of all, you need to learn the morphology of the indicator. Here is the explanation of the visual elements of the indicator and how they can help you in your analysis:
-
Yellow vs Blue Bars Explained
This is the most common question from beginners. The color coding shows buying versus selling pressure:
- Blue bars: Represent “up volume” – This indicates that buyers were more aggressive during that timeframe, pushing prices upward. However, blue doesn’t automatically mean “bullish” since it only shows what happened in the past, not future direction.
- Yellow/Orange bars: Show “down volume” – This suggests sellers were more dominant, driving prices downward from where they started. Again, yellow doesn’t guarantee future selling pressure, it simply reflects historical price behavior at that level.
- Mixed colors: Many platforms display both colors within a single bar, showing the exact proportion of up versus down volume at that price level. For example, a bar might be 60% blue and 40% yellow, indicating more upward pressure but still significant downward activity. This mixed coloring provides a more accurate picture of the battle between buyers and sellers.
Important: The total length of the bar (blue + yellow) matters more than individual colors. Longer bars indicate higher volume areas regardless of color mix.
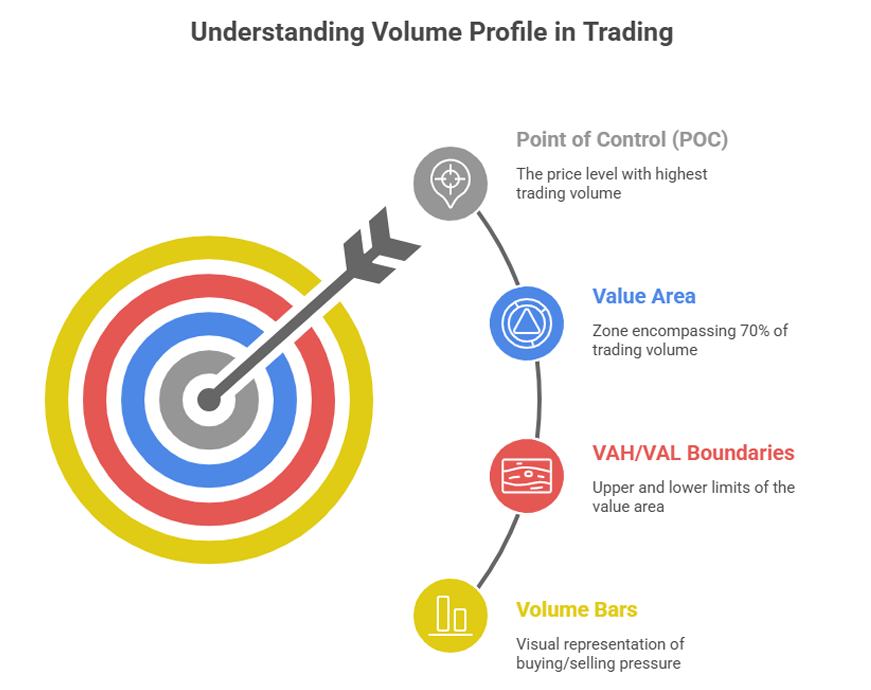
2. POC Identification
The Point of Control (POC) appears as a red horizontal line across your chart. Think of it as the “most popular price” where traders agreed to do the most business. This level carries special significance for several reasons:
- The price level with highest trading volume: This is where the most shares, contracts, or coins changed hands during your selected time period. When you see massive volume at one price, it means both buyers and sellers found this level acceptable for major transactions.
- “Fair value” according to market participants: The POC represents the price that the majority of traders considered “fair” during that session. This consensus makes it psychologically important.
- A magnet level where price often returns: Prices have a tendency to gravitate back toward the POC, especially when they move too far away. This happens because traders remember this “fair” price and often return to it.
3. VAH/VAL Boundaries
The Value Area is like a neighborhood around the POC where most of the trading activity happened. By default, it encompasses 70% of total volume, creating clear boundaries that act as important trading zones:
- VAH (Value Area High): This is the upper boundary of the main volume cluster, marking where significant selling interest typically emerges. When price approaches VAH, it often faces resistance because this represents the upper limit of what most traders considered “fair value.”
- VAL (Value Area Low): The lower boundary of the volume cluster, where buying interest usually strengthens. This acts as the floor of the value area, where traders historically stepped in to purchase at what they considered attractive prices. Support often emerges here because buyers remember getting good deals at this level.
- Shaded area: Many platforms highlight the entire value area with a colored background (usually gray or light blue), making it easy to visualize where 70% of trading occurred. This shaded zone represents the “accepted” price range where most market participants were comfortable doing business during that time period.

Breakdown of Key Components of VRVP
| Element | What It Shows | Trading Significance |
| POC (Red Line) | Highest volume price | Fair value/magnet level – expect price attraction |
| VAH | Value Area High | Resistance zone – selling interest increases |
| VAL | Value Area Low | Support zone – buying interest increases |
| HVN | High Volume Node | Strong S/R levels – expect bounces or consolidation |
| LVN | Low Volume Node | Breakout zones – expect rapid price movement |
Common Mistakes During the Use of VRVP and How to Avoid Them?
Avoid these 5 costly errors that destroy trading accounts. Each mistake has a specific solution to keep you profitable.
Error 1: Trading without Structure Development
The mistake: Jumping into trades based on VRVP signals within the first hour of market opening, when volume data is still incomplete and unreliable.
Why it fails: Early morning volume represents only a small fraction of daily participants. Many beginners see an apparent POC or VAL level and trade it immediately, only to watch it evaporate as more market participants arrive.
Solution: Wait minimum 2 hours after the market opens before trusting VRVP signals. Let institutional traders establish their positions first.
Error 2: Wrong Color Interpretation
The mistake: Making trading decisions based on the misconception that blue bars mean “buy signals” and yellow bars mean “sell signals,” treating colors as directional indicators.
Why it fails: Color coding shows historical price behavior within specific time periods, not future market direction. A blue bar simply means more trades closed higher than they opened in that price range – it doesn’t predict what happens next.
Solution: Focus on total bar length (overall volume) rather than color distribution. Use colors only for additional context about historical buying/selling pressure, never as primary trading signals.
Remember: volume shows where trading occurred, not where it will occur profitably.
Error 3: Overcomplicating Setup
The mistake: Using excessive detail settings like 50+ rows, multiple value area percentages (68%, 70%, 75%), and trying to analyze every tiny volume fluctuation on the chart.
Why it fails: Too much detail creates analysis paralysis and obscures the important patterns that actually matter for trading decisions. This leads to overthinking every price movement and missing clear, profitable setups while you’re busy analyzing minor volume variations that have no predictive value.
Solution: Start with simple settings: 20 rows maximum, 70% value area, total volume display. Master these basic configurations before adding complexity. Only add detail (more rows) after you’ve become consistently profitable with basic settings and can clearly identify which additional information actually improves your trading results.
Error 4: Ignoring Market Context
The mistake: Applying the same VRVP trading strategy in all market conditions – using mean reversion tactics during strong trending days and breakout strategies during consolidating periods.
Why it fails: Volume levels behave differently depending on the overall market regime. During strong trending days (about 14% of trading days), volume-based support and resistance levels break easily as momentum overwhelms previous trading patterns. Conversely, during range-bound conditions (86% of days), these levels tend to hold and provide excellent reversal opportunities. Trading against the market context leads to getting stopped out repeatedly when your strategy doesn’t match market behavior.
Solution: Identify the market regime before applying VRVP strategies. Use trend-following approaches (breakout trades) during trending conditions and mean reversion strategies during ranging markets.
Error 5: Solo indicator reliance
The mistake: Making all trading decisions based exclusively on VRVP signals without confirmation from other technical indicators, price action patterns, or market fundamentals.
Why it fails: No single indicator works consistently in all market conditions, including volume profile. VRVP shows where trading occurred historically but can’t account for changing market sentiment, news events, or shifts in fundamental conditions. Relying solely on volume levels without confirming signals leads to poor timing and missed warning signs that other indicators might reveal. Even the strongest volume-based support can fail if broader market forces overwhelm the local technical setup.
Solution: Always combine VRVP with at least one other form of analysis. Popular and effective combinations include: VRVP + RSI for momentum confirmation, VRVP + moving averages for trend context, or VRVP + price action patterns for entry timing. This multi-layered approach significantly improves win rates and helps you avoid trades where volume levels alone aren’t sufficient to overcome opposing market forces.
Troubleshooting Common Issues with VRVP
If you are a beginner who just started using VRVP, you can face some issues. Here is a troubleshooting guide to resolve these common issues:
| Problem | Cause | Solution |
| VPVR keeps changing | Auto-updates with chart movement | Normal behavior – this is the main feature |
| Too many/few volume bars | Row size setting incorrect | Adjust to 15-25 for optimal detail |
| Can’t see clear patterns | Insufficient volume data | Use higher timeframes or wait for more data |
| Signals not working | Wrong market type | Avoid trending days, news events |
| Colors confusing | Default color scheme | Customize colors in settings for clarity |
| Volume levels breaking | Using in trending market | Switch to breakout strategy, not reversal |