1. Understanding the Basics of Financial Statements
Diving into the world of financial analysis, one must first understand the basic structure and components of financial statements. They serve as the bedrock of company analysis, offering a snapshot of a firm’s financial health and performance.
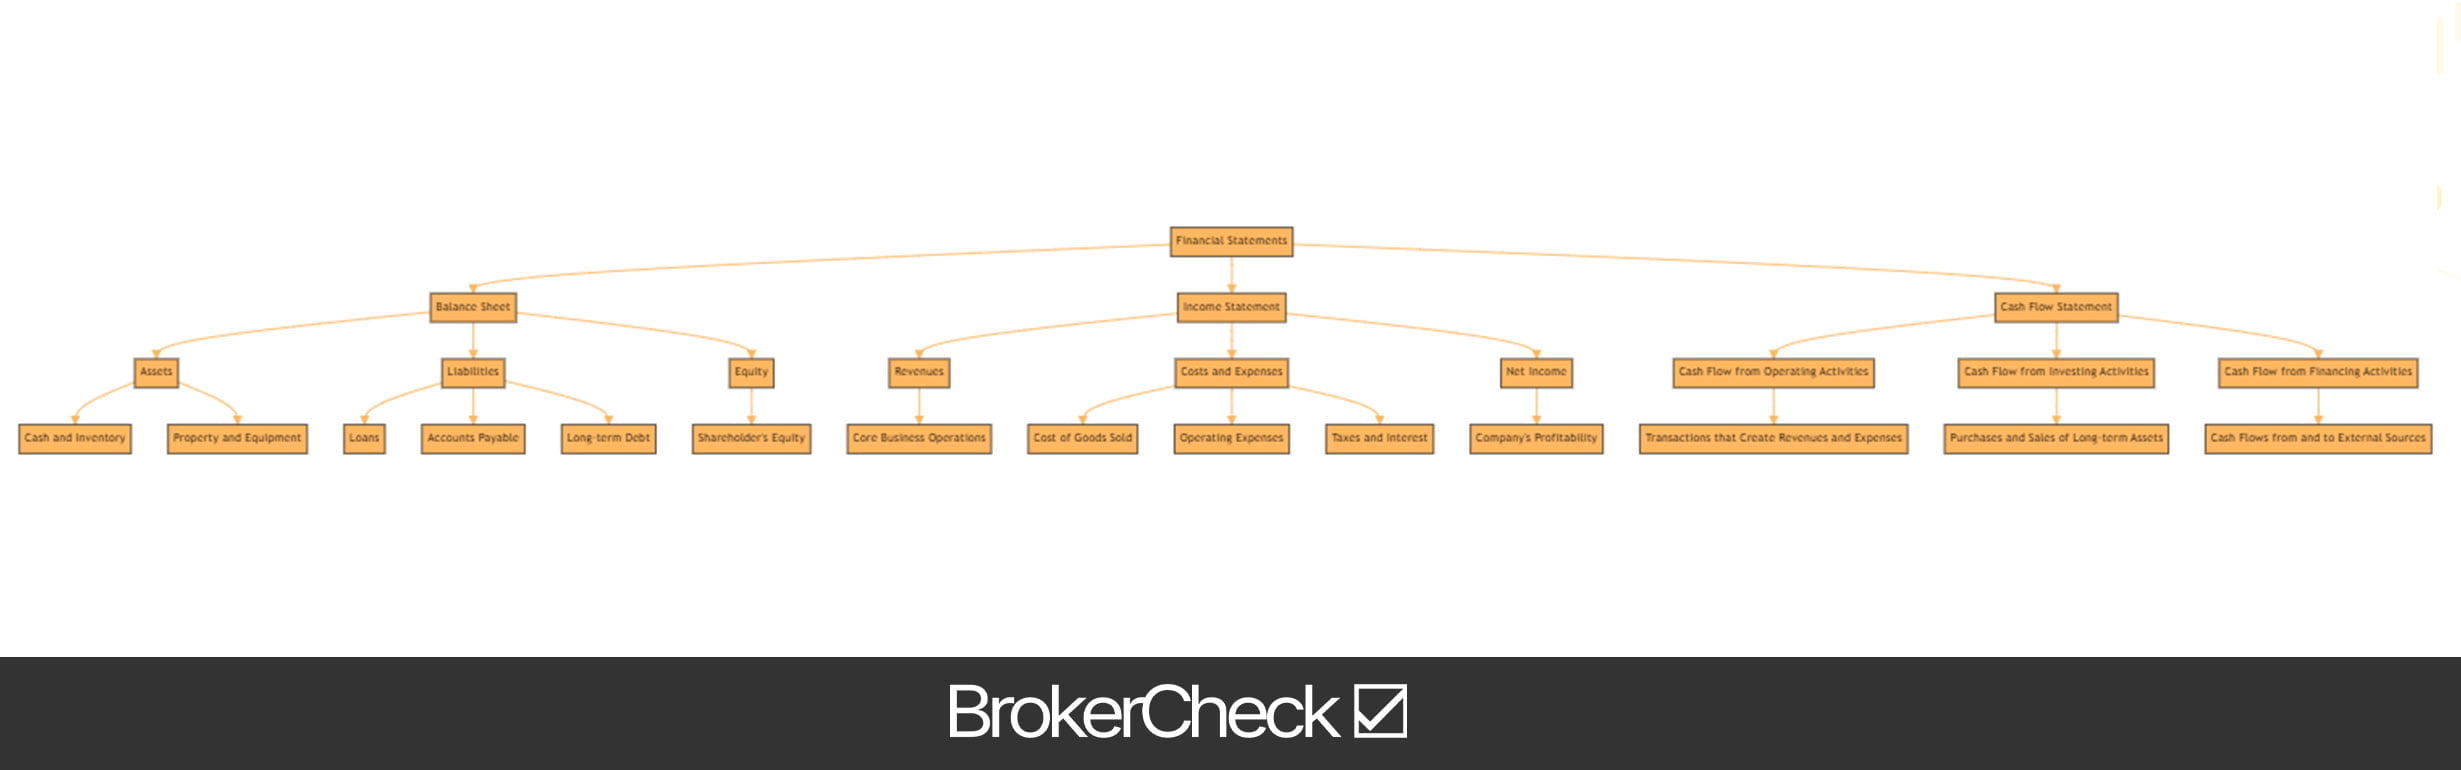
The balance sheet, the first of these crucial documents, provides a snapshot of a company’s assets, liabilities, and equity at a specific point in time. Assets include everything the company owns, from cash and inventory to property and equipment. Liabilities, on the other hand, represent what the company owes, including loans, accounts payable, and long-term debt. The difference between assets and liabilities gives us the company’s equity, often referred to as shareholder’s equity.
Next comes the income statement. This document shows the company’s revenues, costs, and expenses over a period of time, providing a clear picture of the firm’s profitability. Revenues, also known as the top line, are generated from the company’s core business operations. Costs and expenses, deducted from revenues, include cost of goods sold, operating expenses, taxes, and interest. The final figure, the net income, is often referred to as the bottom line, and indicates the company’s profitability.
The third key statement is the cash flow statement. Unlike the income statement, which can be affected by accounting practices, the cash flow statement provides a more straightforward view of how much cash a company is generating and where it’s being spent. It’s divided into three sections: cash flows from operating activities, investing activities, and financing activities.
- Operating activities include the cash effects of transactions that create revenues and expenses. It tells us how much cash the company’s core business operations are generating.
- Investing activities reflect the company’s purchases and sales of long-term assets, like property and equipment.
- Financing activities show the cash flows from and to external sources, like lenders, investors, and shareholders.
Understanding these three financial statements is fundamental to analyzing a company’s financial health. They provide the raw data that will be used in financial ratio analysis, trend analysis, and industry comparison, among others. The balance sheet shows what a company owns and owes, the income statement reveals how profitable the operations are, and the cash flow statement discloses how much cash is being generated and spent.
1.1. Definition and Importance of Financial Statements
In the world of trading, the financial statement is akin to the pulse of a company. It’s a crucial document that provides traders with a comprehensive overview of a company’s financial health. But what exactly is a financial statement, and why is it so important?
A financial statement, in its simplest form, is a detailed record of a company’s financial activities. It is divided into three main components: the balance sheet, the income statement, and the cash flow statement.
The balance sheet provides a snapshot of a company’s assets, liabilities, and shareholders’ equity at a specific point in time. It gives traders an understanding of what the company owns and owes, as well as the amount invested by shareholders.
The income statement shows the company’s revenues, costs, and expenses over a period of time. This statement is crucial for traders as it provides an overview of the company’s profitability, or lack thereof.
The cash flow statement, on the other hand, shows how changes in the balance sheet and income affect cash and cash equivalents. It breaks the analysis down to operating, investing, and financing activities.
With these three components, a financial statement provides a comprehensive overview of a company’s financial status. But why is it important?
The importance of financial statements cannot be overstated. They serve as a key tool for traders to make informed decisions. By analyzing a company’s financial statements, traders can evaluate the company’s profitability, liquidity, solvency, and efficiency.
Through financial statements, traders can identify trends and patterns in a company’s financial performance, predict future performance, and make comparisons with other companies in the same industry. They can also identify potential red flags, such as increasing debt levels or decreasing revenues, which may indicate underlying issues within the company.
So, as traders, it’s crucial to understand the definition and importance of financial statements. They are not merely documents filled with numbers, but powerful tools that can help you make informed and strategic trading decisions.
1.2. Key Components of Financial Statements
When diving into the world of financial statements, it’s crucial to understand the key components that make up these documents.
The Balance Sheet, also known as the statement of financial position, provides a snapshot of a company’s financial health at a specific point in time. It’s divided into three main components: assets, liabilities, and shareholders’ equity. Assets are resources owned by the company, which can generate future economic benefits. Liabilities represent obligations to third parties, while Shareholders’ Equity is the residual interest in the assets of the company after deducting liabilities.
Next, we have the Income Statement. This document summarizes a company’s revenues, costs, and expenses over a specific period. It starts with the gross revenue, deducts the cost of goods sold (COGS) to arrive at the gross profit. After deducting operating expenses, interest, and taxes, we arrive at the net income, which is essentially the company’s profit or loss for the period.
The Cash Flow Statement is another essential component. It provides information about a company’s cash receipts and cash payments during an accounting period. It’s divided into three sections: operating activities, investing activities, and financing activities.
Lastly, there’s the Statement of Changes in Equity. It provides a detailed report of the changes in a company’s equity during a specific period. It includes components like issued capital, retained earnings, and other reserves.
When analyzing these statements, it’s essential to not just look at the figures but understand the story behind them. For instance, a high net income is generally a good sign, but if it’s primarily due to one-time gains and not recurring revenue, it might not be sustainable in the long run. Similarly, a company with high assets but also high liabilities may not be as financially stable as it appears.
Understanding these key components and their interplay is essential in assessing a company’s financial health and making informed trading decisions.
2. Analyzing the Financial Statements
Diving into the heart of financial statement analysis, we find ourselves navigating the turbulent waves of Balance Sheets, Income Statements, and Cash Flow Statements. Each of these documents offers a unique perspective into a company’s financial health, and understanding them is critical in making informed trading decisions.
The Balance Sheet is akin to a snapshot of a company’s financial position at a specific point in time. It details the company’s assets, liabilities, and shareholders’ equity, providing a comprehensive overview of what a company owns and owes, as well as the investment made by the shareholders. When analyzing a balance sheet, traders should pay close attention to the company’s Current Ratio (current assets divided by current liabilities), which gives insight into the company’s ability to pay off its short-term obligations.
Next comes the Income Statement, a record of a company’s profitability over a defined period. It outlines the company’s revenues, costs, and expenses, culminating in the net income. Traders should be on the lookout for trends in revenue growth and net income, as well as the cost of goods sold (COGS) and operating expenses. A key ratio to analyze here is the Profit Margin (net income divided by total revenue), which indicates how much profit is made per dollar of sales.
The final piece of this financial puzzle is the Cash Flow Statement. This document records how changes in balance sheet accounts and income affect cash and cash equivalents, and breaks the analysis down to operating, investing, and financing activities. For traders, it’s crucial to note that a company can show a profit on the income statement, but still be in trouble if their cash flow is negative.
- Operating Activities: This section reveals the cash generated from the company’s core business operations. It reflects how much cash is generated from a company’s products or services.
- Investing Activities: This part shows cash used for investing in assets, as well as the proceeds from the sale of other businesses, equipment, or long-term assets.
- Financing Activities: This segment presents the cash paid to and received from external sources, such as lenders, investors, and shareholders.
A critical metric here is the Free Cash Flow (cash from operating activities minus capital expenditures), which shows how much cash a company has left over to expand its business or return to shareholders after it has paid its expenses and made necessary investments in its business.
While the process may seem daunting, understanding these three financial statements and the key ratios derived from them is an essential skill for any trader. It provides an invaluable window into the financial health of a company, empowering traders to make informed and profitable decisions.
2.1. Ratio Analysis
In the realm of financial analysis, the utilization of Ratio Analysis is a powerful tool that can offer traders a deep, insightful look into a company’s performance. This technique is akin to a magnifying glass that allows you to scrutinize the financial statements of a company, peeling back the layers to reveal the underlying health of the business.
Ratio Analysis involves the comparison of line items in a company’s financial statements. These ratios can be categorized broadly into five types, each serving a specific purpose:
- Liquidity Ratios: These ratios measure the ability of a company to meet its short-term obligations. They include the Current Ratio and Quick Ratio.
- Solvency Ratios: Solvency ratios, such as the Debt to Equity Ratio, provide insight into a company’s ability to meet its long-term obligations.
- Efficiency Ratios: Efficiency ratios like the Inventory Turnover Ratio and Receivables Turnover Ratio help traders understand how efficiently a company is utilizing its assets and managing its liabilities.
- Profitability Ratios: These ratios, including the Net Profit Margin and Return on Equity, can help traders gauge the company’s profitability.
- Market Prospect Ratios: Market Prospect ratios like Earnings Per Share (EPS) and Price to Earnings Ratio (PE Ratio) give traders a sense of the company’s future prospects.
Understanding these ratios is vital, but equally crucial is the ability to interpret them correctly. For instance, a high Current Ratio may indicate a company’s strong ability to meet its short-term obligations. However, it could also suggest that the company is not efficiently using its current assets or short-term financing facilities.
Moreover, it is essential to compare these ratios across different periods and with companies in the same industry. This comparative analysis can provide a more comprehensive picture of the company’s performance.
Remember, Ratio Analysis is just one tool in the trader’s toolbox. It’s essential to use it in conjunction with other methods to get a complete picture of a company’s financial health. It’s also crucial to understand the limitations of Ratio Analysis. For instance, it relies heavily on the information in the company’s financial statements, which may not always accurately reflect the company’s economic reality due to factors like accounting practices and management policies.
In the end, Ratio Analysis can provide valuable insights, but it should be used wisely and complemented with other analysis methods. It’s a powerful tool, but like any tool, its effectiveness depends on the skill and knowledge of the person wielding it.
2.2. Trend Analysis
Diving deeper into the world of financial statement analysis, one cannot overlook the significance of trend analysis. Trend analysis is a potent tool that traders utilize to evaluate the financial health and potential growth of a company. It involves comparing historical data over a specified period to identify consistent patterns or trends.
For instance, let’s consider the revenue of a company. If a company’s revenue has been consistently increasing over the past few years, it’s a positive sign indicating the company’s growth. On the other hand, a declining trend may raise a red flag.
However, it’s essential to understand that trend analysis is not just about identifying patterns. It’s about digging deeper to understand the reasons behind these trends. A sudden spike in revenue might be due to a one-time event, such as the sale of a business segment, and may not indicate future growth.
When performing a trend analysis, traders often focus on the following key areas:
- Revenue Growth: A consistent increase in revenue is usually a positive sign. However, it’s crucial to understand the source of this growth. Is it due to an increase in sales, or is it because of a one-time event?
- Profit Margins: Increasing profit margins indicate that a company is managing its costs effectively. It’s a sign of operational efficiency.
- Return on Equity (ROE): ROE is a measure of a company’s profitability. A rising ROE suggests that the company is generating more profit for every dollar of equity.
- Debt Levels: Increasing debt levels could be a warning sign. It’s essential to compare a company’s debt levels with its industry peers to get a clear picture.
It’s important to remember that trend analysis is just one aspect of financial statement analysis. While it provides valuable insights, it should be used in conjunction with other tools and techniques for a comprehensive evaluation.
Moreover, while trend analysis can help predict future performance, it’s not a foolproof method. Past performance is not always an accurate indicator of future results. Therefore, traders should use it as a guide, not a guarantee. It’s always essential to consider other factors like market conditions, industry trends, and company-specific events.
2.3. Comparative Analysis
As traders, we know that a company’s financial statements are the backbone of our decision-making process. But, just looking at one financial statement of a company is like trying to understand a movie by watching a single scene. It’s the comparative analysis that provides a comprehensive picture of a company’s financial health.
Start by comparing the company’s financials over a period of time. This is known as horizontal analysis. It gives you a snapshot of how the company has performed over the years. Look for trends. Is revenue growing? Are costs being managed? Is the company’s debt level increasing or decreasing? These insights can help you predict future performance.
Next, compare the company’s financials with its competitors. This is known as vertical analysis. It helps you understand where the company stands in its industry. If the company’s profit margin is higher than its competitors, it may indicate superior management or a unique product. If it’s lower, it could signal problems.
Here are three key ratios to look at during your comparative analysis:
- Profit Margin: This tells you how much profit the company makes for each dollar of sales. A higher profit margin is generally better.
- Return on Assets (ROA): This measures how efficiently a company uses its assets to generate profits. A higher ROA indicates a more efficient company.
- Debt to Equity Ratio: This measures a company’s financial leverage. A higher ratio could indicate a higher risk of default.
3. Interpreting the Analysis
Diving into the financial health of a company is akin to exploring the intricate workings of a complex machine. It requires a keen eye, a sharp mind, and a thorough understanding of financial jargon. Once you’ve gathered the necessary data from a company’s financial statements, the real challenge begins: interpretation.
The first thing to note is that numbers alone don’t tell the whole story. Context is key. For instance, a high debt ratio might seem alarming at first glance, but if that debt is being used to finance growth in a sector that’s booming, it might not be such a bad thing after all. Similarly, a low profit margin might seem disappointing, but if the company is in a highly competitive industry where margins are typically low, it might actually be performing quite well.
To make sense of the numbers, it’s important to compare them with industry standards and historical data. This will give you a benchmark to assess the company’s performance.
- Industry Standards: Comparing the company’s financial ratios with those of its competitors can provide valuable insight into its relative performance. If a company’s return on equity is significantly higher than its competitors’, it could indicate superior management or a unique competitive advantage.
- Historical Data: Looking at a company’s financial ratios over time can reveal trends that might not be immediately apparent from a single year’s data. For instance, a steadily increasing debt-to-equity ratio could suggest that the company is becoming increasingly reliant on borrowed money, which could be a red flag.
Also, remember to take into account the macroeconomic environment. A company’s financial performance doesn’t exist in a vacuum. It’s affected by factors such as interest rates, inflation, and economic growth. For example, a company with a high level of debt might struggle in a rising interest rate environment.
But, don’t forget to consider the company’s strategy and business model. A company with a low profit margin but high sales volume might be pursuing a cost leadership strategy, while a company with a high profit margin but low sales volume might be pursuing a differentiation strategy. Understanding the company’s strategy can help you make sense of its financial ratios.
Interpreting financial analysis is as much an art as it is a science. It requires a deep understanding of the business, the industry, and the broader economic environment. But with practice and the right approach, it can provide invaluable insights into a company’s financial health and future prospects.
3.1. Understanding the Implications of Ratios
Diving headfirst into the world of financial ratios can be a daunting task for any trader, yet it’s an essential part of understanding a company’s financial health. Ratios are the trader’s secret weapon, a mathematical tool that cuts through complex financial statements to reveal insightful nuggets of information.
Firstly, it’s crucial to understand that ratios are a form of financial shorthand. They condense a wealth of information into a single, easily digestible figure. A ratio, in essence, is a comparison of two or more financial data points. It’s a way of relating one piece of financial data to another to provide a more comprehensive picture of a company’s financial situation.
For example, consider the current ratio. This ratio compares a company’s current assets (cash, inventory, accounts receivable) to its current liabilities (short-term debts and payables). A high current ratio could indicate that a company has the resources to cover its short-term obligations. However, a very high ratio might also suggest that the company is not using its assets efficiently.
Let’s explore another key ratio – the debt-to-equity ratio. It measures the proportion of a company’s funding that comes from debt versus equity. A high debt-to-equity ratio can signal a higher risk, as it means the company has a significant amount of debt. But again, context is crucial. Some industries, like utilities or telecommunications, typically have higher debt levels due to their capital-intensive nature.
Profit margin is another ratio that traders often scrutinize. It shows how much profit a company makes for each dollar of sales. A high profit margin indicates a more profitable company that has better control over its costs compared to its competitors.
Then there’s the return on equity (ROE). This ratio measures how effectively management is using a company’s assets to create profits. A higher ROE means the company is more efficient at generating profits. It’s important to remember that ratios are just one piece of the puzzle. They need to be used in conjunction with other financial analysis tools to build a complete picture of a company’s financial health. Moreover, ratios should be compared across companies in the same industry, as norms can vary significantly.
Remember, as a trader, your goal is to make informed decisions. Understanding the implications of ratios is a vital step in achieving that objective. So, roll up your sleeves and immerse yourself in the fascinating world of financial ratios. The rewards are well worth the effort.
3.2. Reading Between the Lines
In the intriguing world of financial analysis, it’s not just about the numbers. It’s about what those numbers mean. The ability to interpret and understand the underlying story behind the figures is a crucial skill for any savvy trader.
Let’s delve into the realm of financial statements, where every line item speaks volumes about a company’s fiscal health. Think of it as a detective story, where you’re piecing together clues to get a complete picture.
Firstly, the income statement. This document tells you how much revenue a company has generated over a specific period and how much of that has been converted into net income. But don’t just focus on the bottom line. Look at the gross margin, operating margin, and net margin. These ratios can reveal a company’s efficiency in managing its costs.
Next, the balance sheet. This statement provides a snapshot of a company’s assets, liabilities, and shareholders’ equity at a specific point in time. It’s essential to examine the debt-to-equity ratio, which can indicate how much risk the company is taking on.
Then, there’s the cash flow statement. This document shows the cash coming in and going out of the company. It’s crucial to examine the cash flow from operations, which indicates whether a company’s core business operations are profitable.
- Is the company generating positive cash flow from its operations?
- How does the company’s cash flow compare to its net income?
- Is the company investing in its future growth?
However, it’s not enough to just look at the numbers in isolation. You need to compare them with previous periods and with other companies in the same industry. This will give you a better understanding of the company’s performance and its competitive position.
Additionally, pay attention to the footnotes. They can provide valuable insights into the company’s accounting methods, potential liabilities, and other crucial details that may not be evident from the numbers alone.
Remember, financial analysis is as much an art as it is a science. It requires a keen eye, a critical mind, and a deep understanding of business operations. As a trader, your ability to read between the lines could be the key to spotting lucrative opportunities and steering clear of potential pitfalls.
4. Practical Application of Financial Statement Analysis
In the world of trading, understanding a company’s financial health is paramount. The financial statement analysis offers invaluable insights into a company’s profitability, liquidity, and overall financial stability. This analysis is not just about crunching numbers; it’s about interpreting these numbers to make informed trading decisions.
Firstly, the income statement is a vital tool for assessing a company’s profitability. It provides a detailed breakdown of a company’s revenues, costs, and expenses. Traders should pay close attention to the company’s net income, as it reflects the company’s ability to generate profit. A consistently increasing net income is a positive sign, indicating a company’s growth potential.
Secondly, the balance sheet offers a snapshot of a company’s assets, liabilities, and shareholders’ equity at a specific point in time. Assets include everything a company owns, from cash and inventory to property and equipment. Liabilities, on the other hand, represent what a company owes, like loans and accounts payable. The difference between assets and liabilities gives us the shareholders’ equity, which represents the net value of the company.
A healthy balance sheet should show a steady increase in assets and a decrease in liabilities over time. If liabilities exceed assets, it’s a red flag, indicating potential financial trouble.
Thirdly, the cash flow statement is another essential document for traders. It shows how a company manages its cash, divided into three categories: operating activities, investing activities, and financing activities. Positive cash flow from operating activities is a good sign, suggesting that the company generates enough revenue to cover its operational costs.
Lastly, the statement of shareholders’ equity shows changes in equity over a period. It includes new stock issuance, dividends paid, and the company’s net income or loss. A steady increase in shareholders’ equity indicates a financially healthy company.
4.1. How Traders Can Use Financial Statement Analysis
Financial statement analysis is a powerful tool in the hands of traders. It provides valuable insights into a company’s financial health, enabling traders to make informed decisions. Understanding the key components of a financial statement and how to interpret them is crucial.
- Balance Sheet: This statement provides a snapshot of a company’s assets, liabilities, and shareholders’ equity at a specific point in time. Traders can use this to assess the company’s liquidity, leverage, and capital structure.
- Income Statement: This statement summarizes a company’s revenues, costs, and expenses over a period of time. Traders can use this to evaluate the company’s profitability, operational efficiency, and revenue growth trends.
- Cash Flow Statement: This statement shows how changes in balance sheet accounts and income affect cash and cash equivalents. It breaks the analysis down to operating, investing, and financing activities. Traders can use this to understand the company’s cash flow from its core operations.
Ratio Analysis is another effective method of financial statement analysis. It involves comparing different numbers from the balance sheet, income statement, and cash flow statement to identify patterns, trends, and anomalies. Some of the most common ratios used by traders include the Price-to-Earnings (P/E) ratio, Debt-to-Equity (D/E) ratio, and Current ratio.
For instance, the P/E ratio helps traders evaluate whether a company’s stock price is overvalued or undervalued. A high P/E ratio could suggest that the stock is overpriced, or it could indicate that investors are expecting high growth in the future.
The D/E ratio is a measure of a company’s financial leverage, which provides insights into the level of risk associated with the company’s debt level. A high D/E ratio may indicate a higher risk of default or bankruptcy.
Lastly, the Current ratio is a liquidity ratio that measures a company’s ability to pay short-term and long-term obligations. A higher current ratio indicates that the company is more capable of paying its obligations.
In conclusion, financial statement analysis is a fundamental skill for traders. It provides them with a deeper understanding of a company’s financial health, helping them make better trading decisions. Traders who master financial statement analysis are likely to have a significant edge in the market.
4.2. Case Scenarios in Trading
When it comes to trading, it’s not just about numbers and charts; it’s also about stories. Stories that unfold on balance sheets, income statements, and cash flow charts, revealing the health, performance, and potential of a company. Let’s dive into a few case scenarios to understand how analyzing a company’s financial statements can affect trading decisions.
Imagine you’re considering investing in Company A. You start by examining its balance sheet. You notice a significant increase in its current assets, specifically in its cash and cash equivalents. This could indicate that the company is financially healthy and has enough liquidity to cover its short-term liabilities. However, a closer look at the liabilities section shows a substantial rise in short-term debt. This could be a red flag indicating financial distress or riskier financial management.
Next, you move to the income statement. Here, you notice that Company A’s revenue has been growing consistently, but its net income has been declining. This could be due to increasing costs or decreasing margins, which might affect the company’s profitability in the long run.
Lastly, you analyze the cash flow statement. Despite the declining net income, you observe a strong positive cash flow from operating activities. This suggests that the company is effectively generating cash from its core business operations.
- Case 1: Company A could be a good investment if it can manage its short-term debt and control its costs. The strong cash flow is a promising sign.
- Case 2: If the company fails to manage its debt and costs, it could potentially lead to financial distress, making it a risky investment.
In another scenario, you’re looking at Company B. Its balance sheet shows a decrease in current assets and an increase in long-term liabilities, indicating potential liquidity problems. However, its income statement shows consistent growth in net income, and its cash flow statement reveals a positive cash flow from investing activities due to the sale of a business unit.
- Case 3: Company B could be a risky investment due to its liquidity issues. However, if it can use the cash from its sold business unit to manage its liabilities, it could turn around.
- Case 4: If the company fails to manage its liabilities, it could face financial distress, making it a risky investment despite its positive net income.
These scenarios illustrate how analyzing a company’s financial statements can provide traders with valuable insights, helping them make informed trading decisions. Remember, the devil is in the details, and these details can often be found in the financial statements.