1. What Are The Best MetaTrader 5 Indicators?
When it comes to MT5 indicators, you can see they are almost identical to that of MT4. However, the exact difference lies in their usage and the platform. The MT5 platform was launched in 2010 for non-forex markets and is more advanced. Hence, it can process these best MetaTrader indicators more precisely, with the following benefits:
- You can use them on multiple timeframes simultaneously.
- MT5 indicators can also be used with backtesting.
- MT5 indicators are written in MQL5; hence, they are more powerful.
To verify these benefits, I have tested MetaTrader 5 indicators. Below is a comprehensive review of these indicators:
1.1. Moving Average Convergence Divergence (MACD)
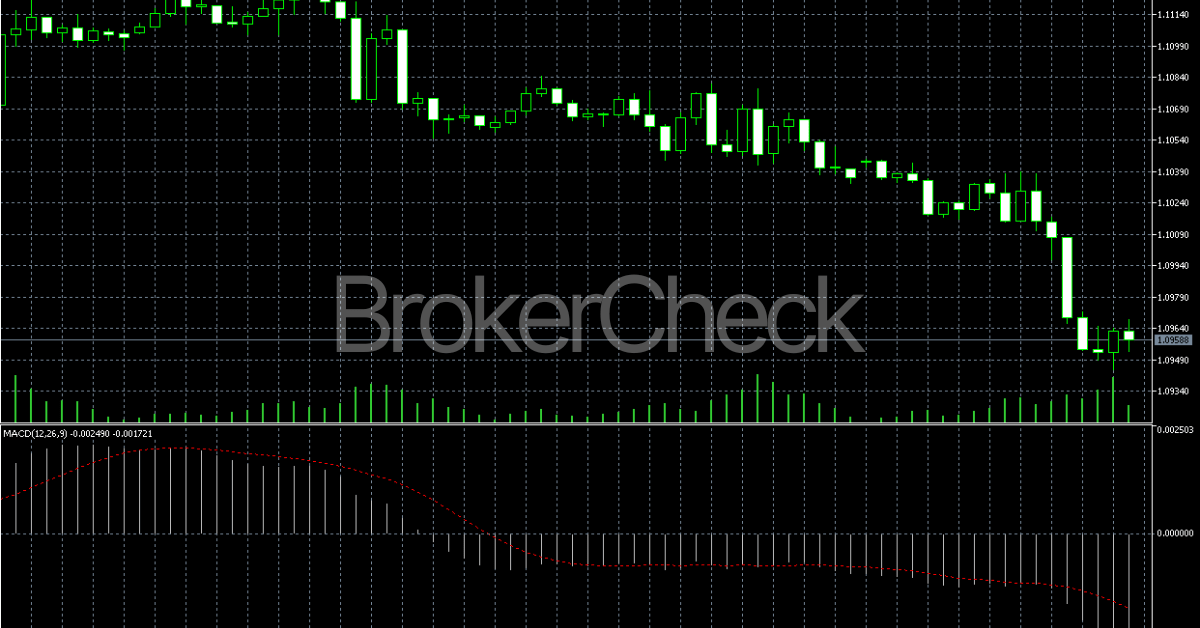
The MACD is a trend-following momentum indicator that shows the relationship between two exponential moving averages (EMAs) of a security’s price. The MACD line is calculated by subtracting the 26-period EMA from the 12-period EMA. A nine-day EMA of the MACD line is called the signal line, which is then plotted on top of the MACD line. It can function as a trigger for buy or sell signals.
1.1.1 Key Features
- The MACD can help gauge whether a security is overbought or oversold, alert traders to the strength of a directional move, and warn of a potential price reversal.
- The MACD can also alert investors to bullish/bearish divergences, suggesting a potential failure and reversal.
- The MACD can be used in any time frame and market, but it works best in trending markets rather than ranging markets.
1.1.2. Tips to Remember While Using MACD
- A bullish signal occurs when the MACD line crosses above the signal line, indicating that the short-term EMA moves faster than the long-term EMA and that the momentum favors the bulls.
- A bearish signal occurs when the MACD line crosses below the signal line, indicating that the short-term EMA is moving slower than the long-term EMA and that the momentum is in favor of the bears.
- A bullish divergence occurs when the price makes a lower low, but the MACD makes a higher low, indicating that the downward momentum is weakening and that a reversal may be imminent.
- A bearish divergence occurs when the price is higher, but the MACD makes a lower high, indicating that the upward momentum is weakening and that a reversal may be imminent.
- After a signal line crossover, it is recommended to wait for three or four days to confirm that it is not a false move.
1.1.3. Parameters
This table covers the important parameters of MACD:
| Parameter | Description | Default Value |
| Fast EMA Period | The number of periods used to calculate the fast EMA. | 12 |
| Slow EMA Period | The number of periods used to calculate the slow EMA. | 26 |
| Signal SMA Period | The number of periods used to calculate the signal line. | 9 |
| Apply to | The price data is used to calculate the EMAs. | Close |

1.2. Relative Strength Index (RSI)
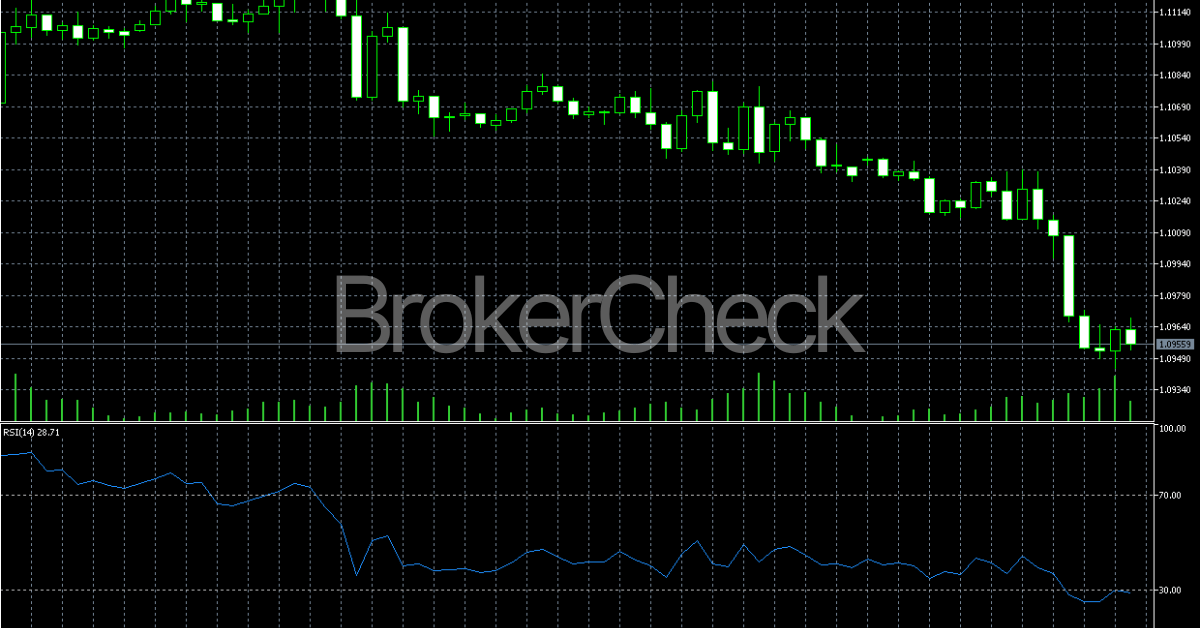
The RSI is a popular momentum oscillator that measures the speed and magnitude of a security’s recent price changes. In this way, it evaluates overvalued or undervalued conditions in the price of that security. The RSI is displayed as an oscillator (a line graph) on a scale of zero to 100.
The indicator was developed by J. Welles Wilder Jr. and introduced in his seminal 1978 book, New Concepts in Technical Trading Systems.
1.2.1. Key Features
- The RSI can do more than point to overbought and oversold securities. It can also indicate securities that may be primed for a trend reversal or corrective pullback in price. It can signal when to buy and sell.
- Traditionally, an RSI reading of 70 or above indicates an overbought situation. A reading of 30 or below indicates an oversold condition. However, these are not always indicative of impending reversal. Instead, traders should look to changes in the RSI for clues about future trend shifts.
- The RSI works best in trading ranges rather than trending markets.
1.2.2. Tips to Remember While Using MACD
- A bullish signal occurs when the RSI crosses above 30 from below. It indicates that the security is no longer oversold and that the momentum is shifting to the upside.
- A bearish signal occurs when the RSI crosses below 70 from above. It tells that the security is no longer overbought and that the momentum is shifting to the downside.
- A bullish divergence occurs when the price makes a lower low. This shows that the RSI makes a higher low, indicating that the selling pressure is decreasing and that a reversal may be near.
- A bearish divergence occurs when the price makes a higher high. However, the RSI makes a lower high, indicating that the buying pressure is decreasing and that a reversal may be near.
- A failure swing occurs when the RSI fails to make a new extreme in the same direction as the price. Therefore, it breaks a previous RSI peak or trough, confirming a trend reversal.
1.2.3. Parameters
Discover the parameters of the RSI indicator below:
| Parameter | Description | Default Value |
| Period | The number of periods used to calculate the RSI. | 14 |
| Apply to | The price data is used to calculate the RSI. | Close |

1.3. Bollinger Bands
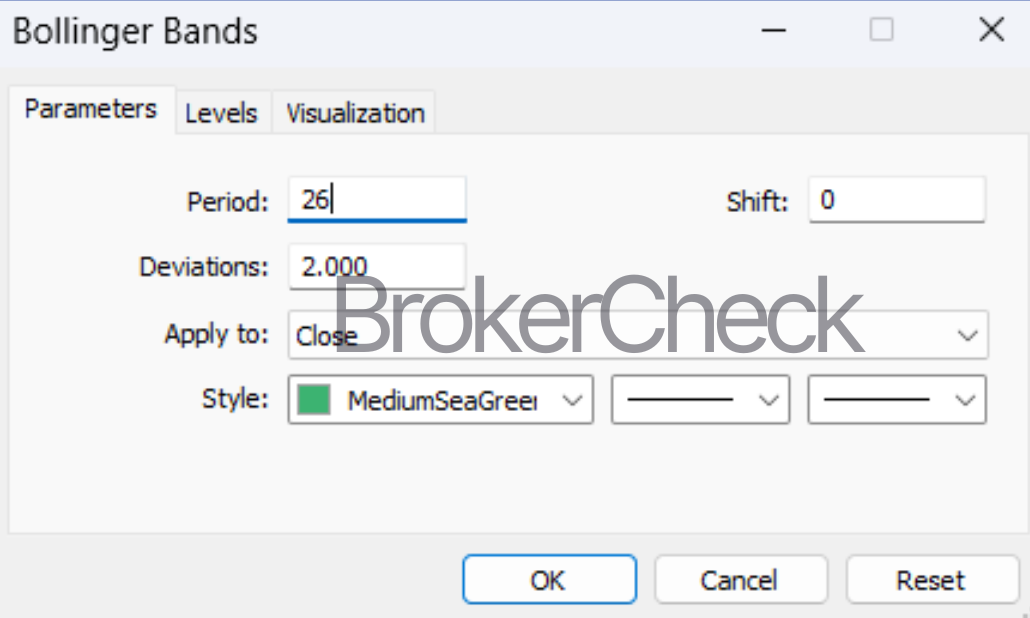
Bollinger Bands are a type of price envelope developed by John Bollinger. (Price envelopes define upper and lower price range levels.) Bollinger Bands are envelopes plotted at a standard deviation level above and below a simple moving average of the price. They are designed to generate oversold or overbought signals and were developed by John Bollinger.

1.3.1. Key Features
- Bollinger Bands can help identify the volatility and relative price levels of a security. The bands widen when volatility increases and narrow when volatility decreases.
- Bollinger Bands can also help determine the direction and strength of the trend. The price tends to stay within the bands during a steady trend. A breakout above or below the bands indicates a possible trend change.
- Bollinger Bands can also provide clues about potential reversals and continuations. When the price touches or exceeds the upper band, it may indicate an overbought condition and a reversal to the downside.
- Bollinger Bands can also identify the squeeze, a period of low volatility and consolidation followed by a sharp price movement. The squeeze is indicated by the bands coming closer together.
1.3.2. Tips to Remember While Using Bollinger Bands
- A bullish signal occurs when the price breaks above the upper band. This shows that the security is in a strong uptrend and that the momentum is likely to continue.
- A bearish signal occurs when the price breaks below the lower band. It implies that the security is in a strong downtrend and that the momentum is likely to continue.
- A bullish reversal signal occurs when the price falls below the lower band and then closes back above it, indicating that the selling pressure is exhausted and that the buyers are taking control.
- A bearish reversal signal occurs when the price rises above the upper band and then closes back below it.
- A bullish continuation signal occurs when the price bounces off the lower band during an uptrend.
- A bearish continuation signal occurs when the price bounces off the upper band during a downtrend, indicating that the trend is still intact and that the sellers are still dominant.
- A squeeze signal occurs when the bands come closer together, indicating that the volatility is decreasing and that a significant price movement is likely to occur soon. The direction of the breakout can be determined by other Metatrader best indicators or analysis methods.
1.3.3. Parameters
You can discover the parameters of Bollinger Bands below:
| Parameter | Description | Default Value |
| Period | The number of periods used to calculate the simple moving average. | 20 |
| Deviations | The number of standard deviations used to plot the bands. | 2 |
| Apply to | The price data is used to calculate the simple moving average and the standard deviation. | Close |
1.4. Stochastic Oscillators
Stochastic Oscillators are momentum indicators that compare the closing price of a security to its price range over a given period of time. They are designed to generate overbought and oversold signals, as well as indicate possible trend reversals and divergences. The indicator was developed by George Lane in the 1950s.

1.4.1. Key Features
- Stochastic Oscillators can help gauge the strength and direction of the price movement, as well as the potential turning points. The indicator consists of two lines: %K and %D. The %K line is the faster and more sensitive line, while the %D line is a moving average of %K.
- Stochastic Oscillators are bounded between 0 and 100, with readings above 80 indicating overbought conditions and readings below 20 indicating oversold conditions.
- Stochastic Oscillators work best in trading ranges rather than trending markets, as they tend to produce false signals in the latter.
1.4.2. Tips to Remember While Using Stochastic Oscillators
- A bullish signal occurs when the %K line crosses above the %D line, indicating that the price is gaining momentum to the upside.
- A bearish signal occurs when the %K line crosses below the %D line, indicating that the price is losing momentum to the downside.
- A bullish divergence occurs when the price makes a lower low, but the %K line makes a higher low, indicating that the selling pressure is weakening and a reversal may be near.
- A bearish divergence occurs when the price makes a higher high, but the %K line makes a lower high, indicating that the buying pressure is weakening and a reversal may be near.
- A failure swing occurs when the %K line fails to make a new extreme in the same direction as the price and then breaks a previous %K peak or trough, confirming a trend reversal.
1.4.3. Parameters
You can find more about the parameters of Stochastic Oscillators in this table:
| Parameter | Description | Default Value |
| %K Period | The number of periods used to calculate the %K line. | 14 |
| %D Period | The number of periods used to calculate the %D line. | 3 |
| Slowing | The number of periods used to smooth the %K line. | 3 |
| Price Field | The price data is used to calculate the %K line. | High/Low |

1.5. Ichimoku Cloud
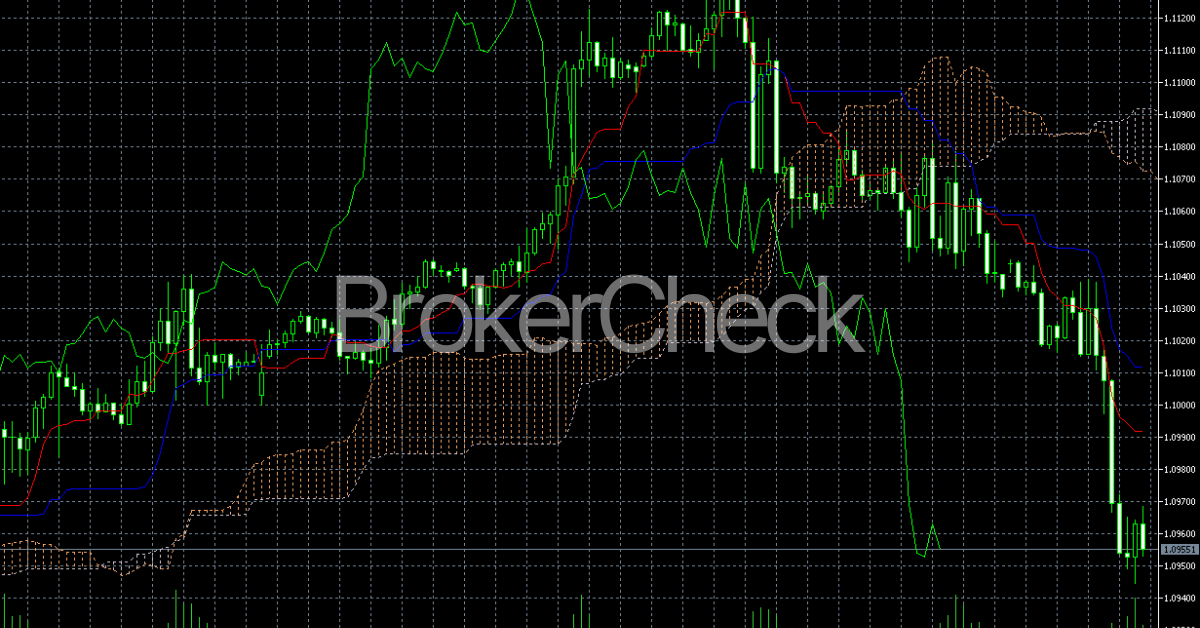
The Ichimoku Cloud is a comprehensive indicator that provides various insights into market dynamics, such as support and resistance, momentum, trend direction, and trading signals. It consists of five lines or calculations that form a cloud on the chart and project where the price may find support or resistance in the future. The indicator was developed by journalist Goichi Hosoda and published in his 1969 book.
1.5.1. Key Features
- The Ichimoku Cloud can help identify the overall trend, as well as the trend changes and continuations. A trend change is signaled when the price crosses the cloud, while a trend continuation is signaled when the price bounces off the cloud.
- The indicator can also help determine the momentum and strength of the trend, as well as the potential entry and exit points. The indicator consists of four main components: the Conversion Line, the Base Line, the Leading Span A, and the Leading Span B.
- It can be used in any time frame and market, but it works best in trending markets rather than ranging markets.
1.5.2. Tips to Remember While Using Ichimoku Cloud
- A bullish signal occurs when the Conversion Line crosses above the baseline, indicating that the short-term momentum is faster than the long-term momentum and that the bulls are in control.
- A bearish signal occurs when the Conversion Line crosses below the Base Line. It indicates that the short-term momentum is slower than the long-term momentum and that the bears are in control.
- A bullish trend change occurs when the price crosses above the cloud, indicating that the price has broken above the resistance and that a new uptrend has started.
- A bearish trend change occurs when the price crosses below the cloud. This shows that the price has broken below the support and that a new downtrend has started.
1.5.3. Parameters
You can find the details about the parameters of Ichimoku Cloud below:
| Parameter | Description | Default Value |
| Conversion Line Period | The number of periods used to calculate the Conversion Line. | 9 |
| Base Line Period | The number of periods used to calculate the baseline. | 26 |
| Leading Span B Period | The number of periods used to calculate the Leading Span B. | 52 |
| Displacement | The number of periods used to shift the cloud forward. | 26 |
| Apply to | The price data is used to calculate the lines. | Close |

2. How Do You Set Up the Best MetaTrader 5 Indicators?
When it comes to using the MT5 indicators, you need to get the MetaTrader 5 PC version. You can get it from the official site. Once you are all set up with the platform, the following steps can help you to play with the indicators:
Step 1. Download the .mq5 or .ex5 files and copy them into the MT5 ‘Indicators’ directory. You can find it within the ‘MQL5’ folder of the MetaTrader 5 terminal installation directory.
Step 2. Once the files are in place, restart the MT5 platform to recognize the new indicators. They will appear in the ‘Navigator’ panel under the ‘Indicators’ section.
Step 3. Drag the desired indicator onto the chart or right-click and select ‘Attach to a chart.’
Step 4. To adjust the parameters, such as periods, levels, and colors, Double-click on the indicator within the chart to open its properties. And there you have it!

While playing a little with different settings, you can achieve your desired results. However, adjusting parameters for different markets is a nuanced process. For example, a shorter period in moving averages might be used for a volatile market to react more quickly to price changes. In contrast, a longer period could be preferable for smoother results in a less volatile, trending market.
The table below illustrates potential adjustments for each indicator based on market conditions:
| Indicator | Market Condition | Parameter Adjustment |
| MACD | Fast-Moving | Decrease the number of periods |
| RSI | Highly Volatile | Widen overbought/oversold levels |
| Bollinger Bands | Low Volatility | Increase standard deviation |
| Stochastic | Trending Market | Increase time period |
2.1. Backtesting
In trading, backtesting is the process of testing a trading strategy or technique using historical data to see how it would have performed in the past. It’s like running a simulation based on your strategy before risking real money in the market.
Traders must conduct thorough backtesting after adjusting settings to ensure the new parameters effectively capture the desired market behavior. This process helps in identifying the best settings that correspond to specific market conditions and align with the trader’s strategy, ultimately enhancing the decision-making process in trading activities.
3. How Do You Use the Best MetaTrader 5 Indicators for Trade Analysis?
When employing MetaTrader 5 indicators for trade analysis, it’s crucial to apply them in a way that complements your trading style and the market’s characteristics. I have compiled a hands-on guide that can serve you some tips while using MT5 indicators for your trading analysis. Let’s have a look at them:
3.1. Technical Analysis with Trend Indicators
Technical analysis relies on trend indicators like EMAs (responsive moving averages) to spot market direction and momentum. ADX measures trend strength, while Parabolic SAR offers dynamic stop-loss points for trends and potential reversals.
This table elaborates on the technical analysis of different trend indicators:
| Indicator | Function | Trading Signal |
| EMA | Identifies recent price trends | Crossovers for entry/exit points |
| ADX | Measures trend strength | Above 25 for a strong trend, below 20 for a weak trend |
| Parabolic SAR | Sets stop-loss levels, indicates reversals | Position flips as trailing stop |
3.2. Identifying Overbought or Oversold Conditions with Oscillators
Oscillators like RSI and Stochastic gauge market sentiment, spotting “too high” or “too low” swings before they reverse. RSI tracks recent price changes, like a gas gauge for momentum. Stochastic compares price to recent highs/lows, picturing a seesaw tilting to extremes. Use these signals cautiously, with other analyses, to make informed trading decisions.
Find more details on this topic with the help of this table:
| Oscillator | Overbought Threshold | Oversold Threshold | Key Feature |
| RSI | 70 | 30 | The magnitude of recent price changes |
| Stochastic | 80 | 20 | Closing price relative to high-low range |
This is how you can use oscillators for your trade decisions:
| Condition | RSI Signal | Stochastic Signal | Potential Action |
| Overbought | RSI > 70 | %K line > 80 | Consider selling or taking profits |
| Oversold | RSI < 30 | %K line < 20 | Consider buying or looking for long-entry |
| Bullish Divergence | Price low, RSI higher low | Price low, %K higher low | Anticipate potential upward reversal |
| Bearish Divergence | Price high, RSI lower high | Price high, %K lower high | Anticipate potential downward reversal |
3.3. Volume Indicators for Confirming Market Moves
Volume whispers what price shouts. Tools like OBV and Volume Oscillator track volume changes to confirm price trends and gauge their strength. Rising OBV with price = buyers pushing, falling OBV = sellers taking over. The volume Oscillator swings like a mood meter, positive for bullishness and negative for bearishness. Use both with caution to understand the true story behind price movements.
These are the key points for volume MetaTrader best indicators:
| Indicator | Bullish Sign | Bearish Sign | Neutral Signal |
| OBV | OBV and price are both rising | OBV and price both falling | OBV is flat while the price fluctuates |
| Volume Oscillator | Positive and rising value | The negative and falling value | The oscillator hovers around the zero line |
4. Which MetaTrader 5 Indicator is Best Suitable for You?
Here comes the hot take: which MT5 indicator should you choose? Although pros know how to select an indicator, beginners often suffer here. Therefore, I have devised a cheat sheet that can help you in choosing an MT5 indicator as per your preferences:
- MACD: Good for identifying trend strength and potential reversals. Versatile for various assets.
- RSI: Good for spotting overbought/oversold conditions & possible trend changes. Simple but powerful.
- Bollinger Bands: Good for gauging volatility & potential breakouts. Offers visual support and resistance zones.
- Stochastic Oscillators: Good for identifying momentum & potential oversold/overbought areas. Useful in ranging markets.
- Ichimoku Cloud: Complex but informative, showing trend direction, support/resistance, and momentum. Requires practice to interpret.
| Parameters | Indicator |
| Trend follower | MACD or Ichimoku Cloud |
| Momentum trader | Stochastic Oscillators or RSI |
| Volatility trader | Bollinger Bands |
| Beginner | RSI or MACD (simpler to understand) |
| Experienced trader | Ichimoku Cloud or a combination (advanced analysis) |