
1. What are the Best Metatrader 4 Indicators?
Many free Metatrader 4 indicators provide powerful tools to improve trading strategies. With so many forex indicators available, choosing the right one for your needs can be challenging. I’ve compiled a list of the top 3 indicators that can give unmatched results if used skillfully. The indicators are:
1.1. Moving Average Convergence Divergence (MACD)
Moving Average Convergence Divergence (MACD) is a staple among trading indicators, favored for its ability to reveal changes in the strength, direction, momentum, and duration of a trend in a stock’s price.

1.1.1. How does MACD Work?
The MACD is calculated by subtracting the 26-period Exponential Moving Average (EMA) from the 12-period EMA. The result of this calculation is the MACD line. A nine-day EMA of the MACD called the “signal line” is then plotted on top of the MACD line, which can trigger buy and sell signals.
Traders may buy the security when the MACD crosses above its signal line and sell or short the security when the MACD crosses below the signal line.
The MACD histogram is an important component that charts the distance between the MACD and its signal line. If the MACD is above the signal line, the histogram is positive. Conversely, if the MACD is below the signal line, the histogram is negative. The histogram growing larger indicates increasing momentum, while shrinking indicates decreasing momentum.
Here’s a snapshot of what traders typically look for in the MACD:
- MACD line crossing above the signal line: Bullish signal;
- MACD line crossing below the signal line: Bearish signal;
- MACD line and price divergence: Potential trend reversal;
- Histogram size increasing: Momentum is increasing;
- Histogram size decreasing: Momentum is waning;
Here’s an example of MACD settings for different trading approaches:
| Trading Approach | Fast EMA | Slow EMA | Signal EMA | Use Case |
| Aggressive | 5 | 35 | 5 | Quick entries and exits |
| Standard | 12 | 26 | 9 | Balance between speed and reliability |
| Conservative | 19 | 39 | 9 | Filter out false signals |
1.1.2. Strengths and Limitations
- Strengths: It is effective in trending markets and provides clear signals.
- Limitations: Less effective in ranging markets and can produce false signals.
1.1.3. MACD on MetaTrader
The MACD indicator for MetaTrader can be easily added to the chart by following these steps:
- Open the MetaTrader platform and select the security you want to analyze.
- Go to the Insert menu and select Indicators -> Oscillators -> MACD.
- A window will pop up where you can customize the parameters of the MACD, such as the periods of the EMAs, the signal line, the colors, and the levels. You can also use the default settings if you prefer.
- Click OK, and the MACD indicator will appear below the price chart.

The MACD indicator for MetaTrader can help you identify the trend direction, the trend strength, the potential entry and exit points, and the possible trend reversals. You can use the MACD in conjunction with other technical tools and analyses to enhance your trading performance.
1.2. Relative Strength Index (RSI)
The Relative Strength Index (RSI) is a momentum oscillator that gauges the speed and change of price movements. This aids traders in identifying overbought or oversold conditions. Developed by J. Welles Wilder, the RSI oscillates between zero and 100. It is typically used with a default period of 14 but can be adjusted to increase sensitivity or smooth out market noise.
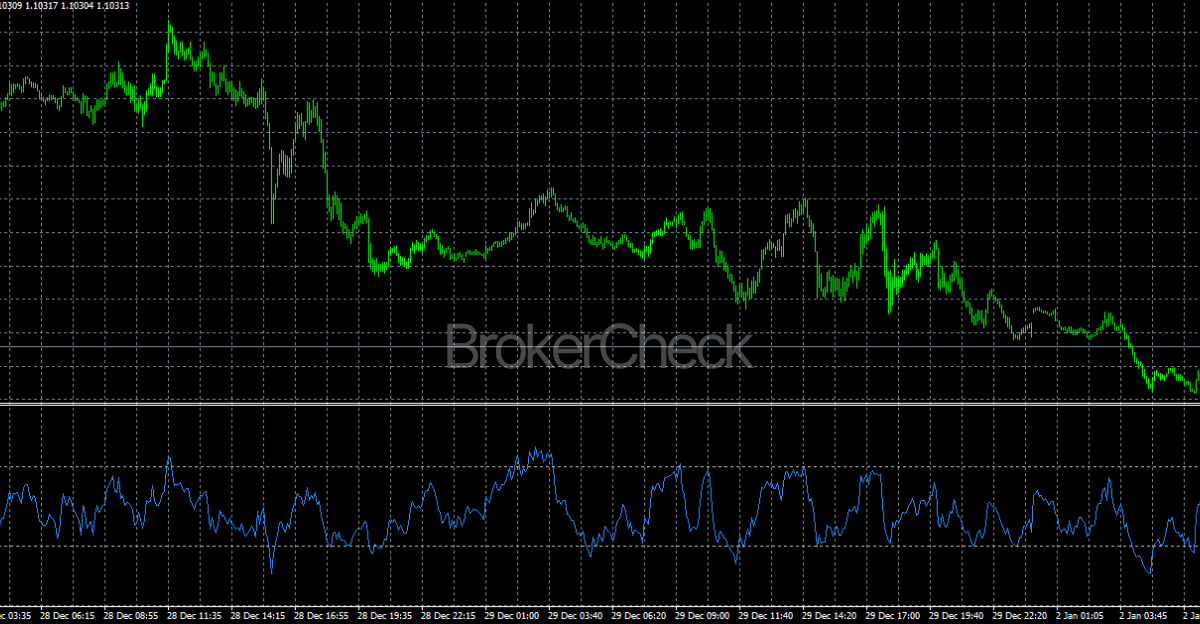
1.2.1. How does RSI Work?
RSI Calculation involves several steps:
- Average Gain = Sum of gains over the past 14 periods / 14.
- Average Loss = Sum of losses over the past 14 periods / 14.
- RS (Relative Strength) = Average Gain / Average Loss.
- RSI = 100 – (100 / (1 + RS)).
RSI levels are critical:
- Overbought: Above 70
- Oversold: Below 30
Adjusting the overbought and oversold thresholds can tailor the indicator to different market conditions or trading styles.
Here’s a table illustrating how traders might adjust the RSI settings:
| Market Condition | Adjusted Overbought Level | Adjusted Oversold Level |
| Highly Volatile | 80 | 20 |
| Less Volatile | 60 | 40 |
RSI can be combined with other Forex indicators for a more comprehensive analysis. For example, using the RSI in conjunction with moving averages can help confirm trend directions, while incorporating volume indicators can provide insights into the strength of the RSI signals.
1.2.2. Strengths and Limitations
- Strengths: It helps identify overbought or oversold conditions.
- Limitations: It may generate false signals in strongly trending markets.
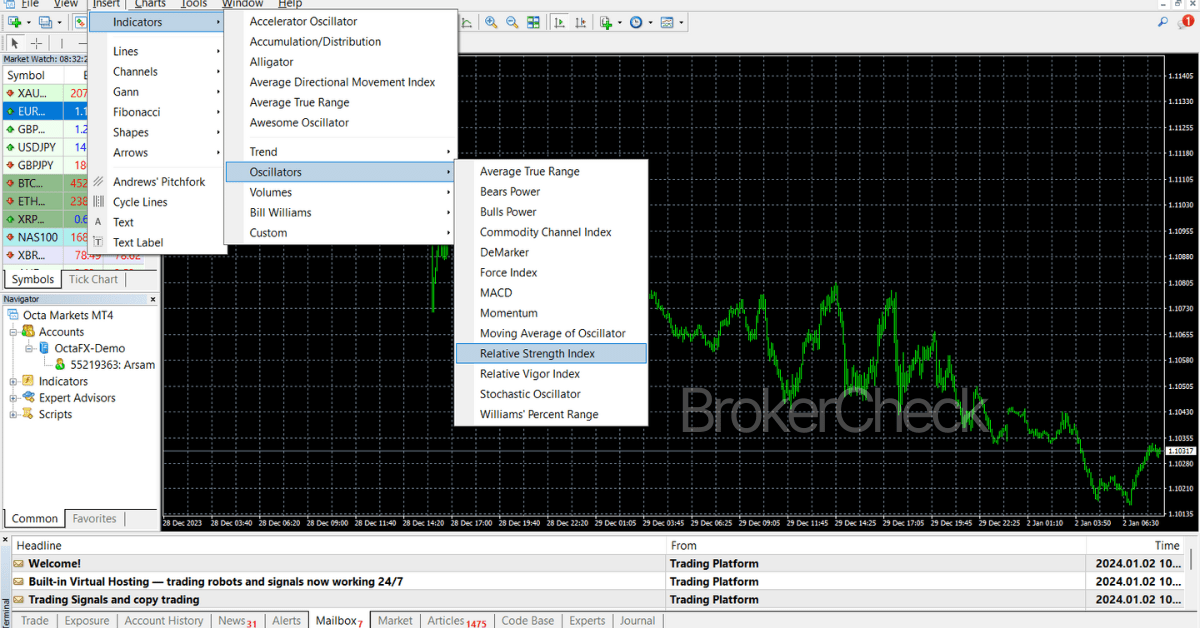
RSI on Metatrader
The RSI indicator for MetaTrader can be easily added to the chart by following these steps:
- Open the MetaTrader platform and select the security you want to analyze.
- Go to the Insert menu and select Indicators -> Oscillators -> RSI.
- A window will pop up where you can customize the parameters of the RSI, such as the period, the levels, and the colors. You can also use the default settings if you prefer.
- Click OK, and the RSI indicator will appear below the price chart.
The RSI indicator for MetaTrader can help you identify the trend direction, the trend strength, the potential entry and exit points, and the possible trend reversals. You can use the RSI in conjunction with other technical tools and analyses to enhance your trading performance.
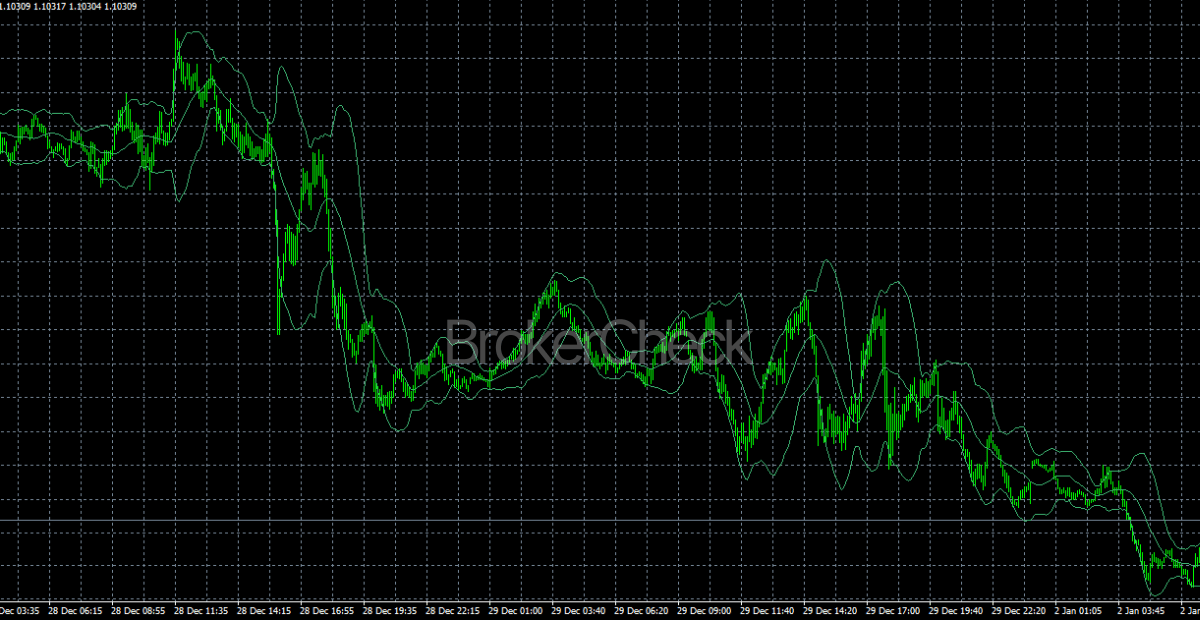
1.3. Bollinger Bands
Bollinger Bands, developed by John Bollinger in the 1980s, is a versatile technical analysis tool. It measures market volatility and provides a relative definition of high and low prices.
The bands consist of three lines: the middle band is typically a 20-period simple moving average (SMA), and the upper and lower bands are the SMA plus and minus twice the standard deviation of price over the same number of periods.
1.3.1. How do Bollinger Bands work?
Traders look for several signals when using Bollinger Bands:
- Price touching or crossing the upper band: potential overbought market;
- Price touching or crossing the lower band: potential oversold market;
- Band contraction: signals decreased volatility, often a precursor to a sharp price movement;
- Band expansion: indicates increased volatility, which may accompany strong price movements;
Here are the default Bollinger Band settings:
| Component | Default Setting |
| Middle Band | 20-period SMA |
| Upper/Lower Band | 2 standard deviations from SMA |
1.3.2. Strengths and Limitations
- Strengths: They help identify potential overbought or oversold conditions.
- Limitations: Not suitable for providing accurate buy and sell signals in isolation.
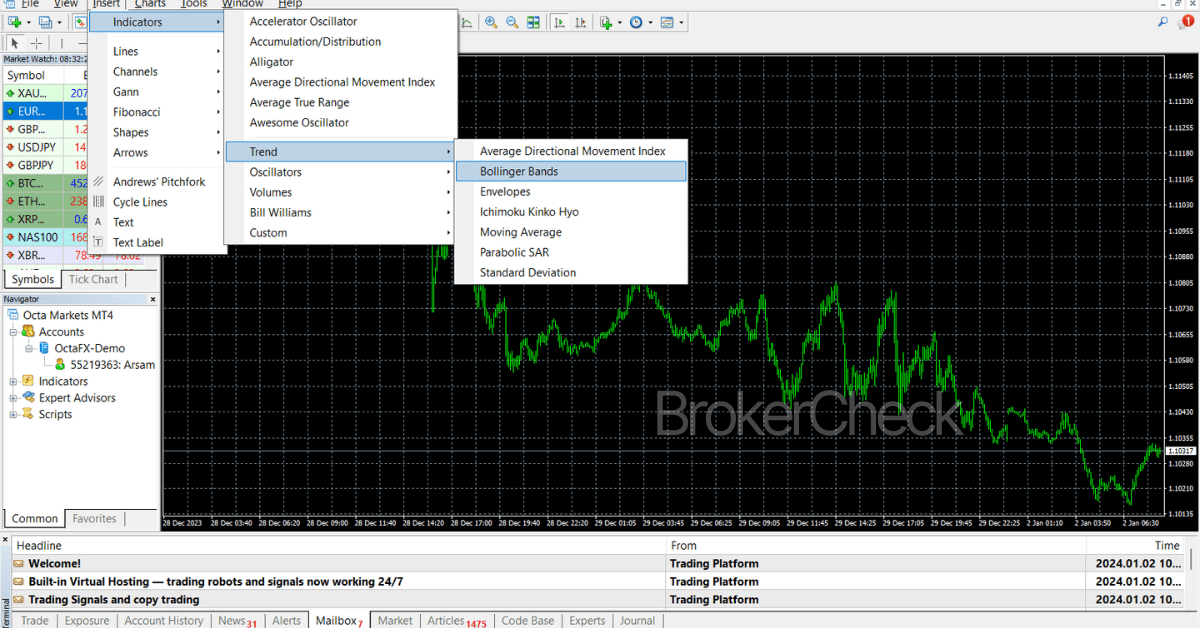
1.3.3. Bollinger Bands on Metatrader
To add Bollinger Bands to a chart in MetaTrader, you can follow these steps:
- Open the MetaTrader platform and select the security you want to analyze.
- Go to the Insert menu and select Indicators -> Oscillators -> Bollinger Bands.
- A window will pop up where you can customize the parameters of the Bollinger Bands, such as the period, the levels, and the colors. You can also use the default settings if you prefer.
- Click OK, and the Bollinger Bands will appear on the price chart.
You can use the Bollinger Bands in conjunction with other technical tools and analyses to enhance your trading performance.
2. How to Use MetaTrader Indicators to Improve Trading Decisions?
MetaTrader indicators can significantly enhance trading decision-making by providing actionable insights into market trends, momentum, and potential entry and exit points. To effectively harness these tools, traders must understand the specific applications and nuances of each indicator.
- Choose the indicators that suit their trading goals, time frame, and market conditions. Not all indicators work well in all situations; some may contradict or duplicate each other.
- Combine different types of indicators to get a more comprehensive and reliable picture of the market. For example, using a trend indicator with an oscillator can help traders identify the trend direction and the optimal entry and exit points.
- Avoid overloading the chart with too many indicators, which can cause confusion and analysis paralysis. Traders should focus on the indicators’ quality, not the quantity. A good rule of thumb is to use no more than three to five indicators simultaneously.
Here’s a table illustrating potential indicator combinations and their trading implications:
| Indicator Pair | Signal Confluence | Trading Implication |
| MACD & RSI | MACD bullish cross & RSI above oversold | Potential Long Entry |
| Bollinger Bands & RSI | Price at lower band & RSI below oversold | Potential Long Entry |
| MACD & Stochastic | MACD bearish cross and stochastic overbought | Potential Short Entry |
3. What to Consider When Choosing MetaTrader Indicators?
When choosing MetaTrader indicators, traders must consider their trading style and objectives. Scalpers, day traders, and swing traders have different needs, and the indicator settings should reflect the time frame and speed of trade execution desired. Here are the 3 factors that can help you in this regard:
3.1. Trading Style and Objectives
In aligning MetaTrader indicators with trading objectives, the trader’s approach dictates the configuration and application of these tools. Moreover, the choice of indicators should also reflect the asset being traded. Volatility, liquidity, and market hours for different instruments can greatly influence the effectiveness of certain indicators. Currency pairs, for instance, may have distinct behaviors that align better with momentum indicators, while stocks might be more amenable to volume-based indicators.
The table below outlines a strategic approach to selecting indicator combinations based on their primary function:
| Function | Indicator Example | Purpose |
| Trend Detection | MACD, Moving Averages | To identify the market direction and strength of a trend |
| Momentum | RSI, Stochastic Oscillator | To gauge the speed of price movement and potential reversals |
| Volatility | Bollinger Bands, ATR | To measure market volatility and potential breakout/breakdown points |
Important tip: Backtesting remains a critical step in validating the effectiveness of chosen indicators and their settings. By reviewing past performance, traders can refine their strategies to improve future outcomes
3.2. Asset Specificity and Market Conditions
Asset specificity and market conditions are crucial considerations when applying MetaTrader indicators to trading strategies.
Asset specificity can significantly affect the performance of technical indicators. For example, a highly liquid currency pair such as EUR/USD may provide more reliable signals on momentum indicators than a less liquid pair.
Market conditions also dictate the appropriate use of indicators. During a strong trend, indicators designed to identify overbought or oversold conditions, such as the RSI, might remain in extreme territories for extended periods.
3.3. Indicator Combinations for Enhanced Analysis
Indicator combinations serve as a multifaceted approach to market analysis, offering traders a more nuanced understanding of price movements. By integrating various types of indicators, one can confirm signals and reduce the likelihood of false positives, thus enhancing the overall analysis.
A common combination strategy involves using a trend indicator with a momentum indicator and a volatility indicator. This triad allows for a comprehensive assessment of market conditions.
Below is a breakdown of how these categories of indicators can be combined effectively:
| Trend Indicator | Momentum Indicator | Volatility Indicator | Combined Purpose |
| Moving Averages | RSI | Bollinger Bands | Identifying potential entries during trending markets with confirmation of momentum and volatility levels. |
| MACD | Stochastic Oscillator | Average True Range (ATR) | Confirming trend continuation or reversal with momentum shifts and assessing the strength of the move based on volatility. |