1. Overview of Gann Theory
Gann Theory is one of the more intricate and enigmatic approaches to technical analysis in financial markets. Developed by W.D. Gann, a trader and market theorist active in the early 20th century, this methodology seeks to predict future price movements based on geometric angles, time cycles, and a unique approach to market psychology. Gann believed that market behavior was not random but followed specific laws that could be mathematically represented.
1.1. Brief Overview of Gann Theory and Its History
W.D. Gann’s theory revolves around the relationship between price, time, and geometry. Born in 1878, Gann spent years studying the stock and commodity markets, eventually developing his famous techniques. He believed that price movements in markets occurred in predictable cycles that were tied to natural laws. Gann’s analysis emphasized the importance of both price and time, arguing that one should not be considered without the other. His theory integrates mathematical principles, geometry, and even astrology to forecast future price movements.
Gann’s techniques were often considered revolutionary for their time, especially his innovative use of angles and time cycles. His ability to forecast market highs and lows with uncanny accuracy earned him a significant following, and his work continues to be studied by traders today.
1.2. Importance of Understanding Price and Time Relationships in Trading
Central to Gann Theory is the concept that price and time must be in balance. Gann believed that price movements occurred in cycles and that these cycles could be mapped to time intervals. If the relationship between price and time is correctly understood, traders can anticipate future movements in the market with greater precision.
In modern technical analysis, this understanding of price and time relationships provides a crucial edge. Many traders rely solely on price charts, but Gann’s methods show that time plays an equally important role in determining market direction. The symmetry between price and time, as Gann postulated, can help traders identify turning points, which is essential for timing entries and exits in trades.
1.3. The Role of Gann Theory in Technical Analysis
In technical analysis, Gann Theory occupies a unique space. It’s both mathematical and philosophical, integrating geometry, numbers, and cyclical patterns with a broader worldview of how markets function. Traders who use Gann Theory often apply tools such as Gann angles, the Gann fan, and the Square of Nine, each of which provides insights into potential price movements.
Unlike many other technical approaches, which focus predominantly on price patterns or momentum, Gann’s work incorporates time cycles and angle measurements. This allows for a multi-dimensional view of the market, where both time and price are analyzed concurrently to predict future movements. As a result, Gann Theory provides traders with a more comprehensive framework for understanding the complex interplay of forces that drive market behavior.

| Section | Description |
|---|---|
| Brief Overview | Gann Theory is a geometric and cyclical approach to market forecasting developed by W.D. Gann, emphasizing the relationship between price and time. |
| Price and Time Relationships | Understanding how price and time interact helps traders predict future market movements, aiding in the timing of trades. |
| Role in Technical Analysis | Gann Theory combines price, time, and geometry, offering a unique and multidimensional approach to market analysis. |
2. Understanding Gann Angles
Gann Angles are one of the foundational elements of Gann Theory, offering traders a way to visually interpret the relationship between price and time on a chart. These angles allow traders to measure and forecast market movements with precision, based on the theory that prices move in predictable geometric patterns over time. Gann Angles provide insight into the strength and direction of market trends, helping traders identify key support and resistance levels.
2.1. What are Gann Angles?
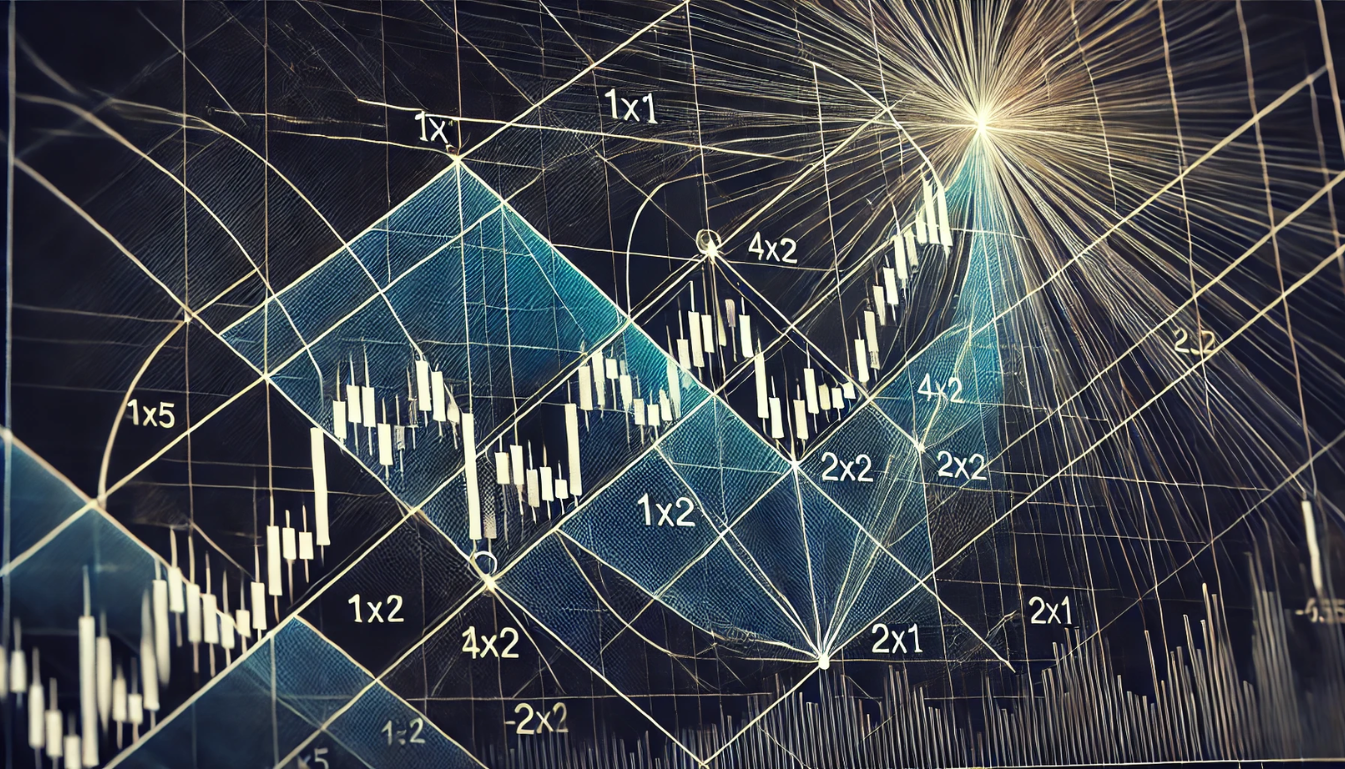
At its core, a Gann Angle is a diagonal line plotted on a price chart that moves upward or downward at a specific angle. These angles represent the rate of change between price and time. Gann theorized that certain angles were more significant than others, and that markets often respect these angles when it comes to support and resistance. The most well-known angle is the 1×1, which rises at a 45-degree angle and represents an equal rate of change between price and time — meaning that for every unit of time, price moves by one unit.
Gann believed that when the price followed these angles, it represented balance, but when price deviated, it signified either weakness or strength, depending on the direction of the movement.
2.2. How to Draw Gann Angles on a Chart
Drawing Gann Angles requires the selection of a significant high or low on a price chart. From that point, traders can draw lines at various angles that correspond to specific rates of change between price and time. The most common angles include 1×1 (45 degrees), 2×1 (63.25 degrees), and 1×2 (26.75 degrees), among others. Each of these angles reflects a different relationship between price and time.
To draw a Gann Angle:
- Identify a significant peak or trough in the price action.
- Plot the angle by calculating the correct ratio of price movement to time, corresponding to the chosen angle (e.g., 1×1, 2×1).
- Extend the angle outward from the chosen price point to project future price action.
In modern charting software, traders can use built-in tools to automatically plot these angles based on selected price points, simplifying the process.
2.3. The Significance of Different Gann Angle Degrees (45, 63.25, etc.)
The various degrees of Gann Angles represent different rates of change between price and time. These angles are crucial for identifying key support and resistance levels. For instance, the 1×1 angle (45 degrees) suggests that the market is moving in perfect harmony with time — for every unit of time, the market moves by one unit of price. When the price stays above the 1×1 line, it indicates strength, while dropping below it suggests weakness.
The 2×1 angle (63.25 degrees) represents a steeper rate of change, where the market is moving two units of price for every one unit of time. This angle is often considered a stronger upward trend. Conversely, the 1×2 angle (26.75 degrees) reflects a slower rate of change, where price is moving one unit for every two units of time, indicating a weaker trend.
Understanding these various angles allows traders to assess market momentum and make informed trading decisions based on the strength or weakness of the price movement.
2.4. Using Gann Angles to Identify Support and Resistance Levels
One of the most practical applications of Gann Angles is their ability to highlight potential support and resistance levels on a chart. As price approaches one of these angles, it often reacts by either reversing direction or consolidating around the line. Gann theorized that when price is above an angle, it acts as support, while when price is below an angle, it acts as resistance.
For instance, if price is trending upward and approaches a 1×1 angle from below, it may find support at that level and continue to move higher. Conversely, if price breaks below the 1×1 angle, it may signal the beginning of a downward trend, with the angle now acting as resistance.
Traders can use these angles in conjunction with other technical indicators to strengthen their analysis of market trends and potential turning points.
| Section | Description |
|---|---|
| What are Gann Angles? | Diagonal lines on a chart representing the rate of change between price and time, used to forecast price movements. |
| How to Draw Gann Angles | Gann Angles are drawn from significant highs or lows, at specific angles like 1×1, 2×1, and 1×2, to project future price action. |
| Significance of Different Angles | Different angles (e.g., 45 degrees, 63.25 degrees) indicate varying levels of market strength and trend direction. |
| Identifying Support and Resistance | Gann Angles help identify key levels where price may find support or resistance, aiding in trading decisions. |
3. The Gann Fan
The Gann Fan is a popular tool in technical analysis derived from Gann Theory. It is composed of multiple Gann angles that radiate out from a significant price point, typically a market high or low, forming a fan-like structure on the chart. These angles provide traders with a way to measure market momentum and predict future support and resistance levels. By visualizing price movement in relation to multiple angles simultaneously, the Gann Fan offers a comprehensive view of market dynamics.
3.1. Construction of a Gann Fan
Constructing a Gann Fan starts with identifying a significant point on the price chart, such as a major peak or trough. From this point, several angles are drawn, usually in a fan-like array. Each of these angles represents a different rate of change between price and time, similar to individual Gann angles but in a multi-dimensional format.
A typical Gann Fan includes the following angles:
- 1×1 (45 degrees)
- 2×1 (63.25 degrees)
- 1×2 (26.75 degrees)
- 4×1 (75 degrees)
- 1×4 (15 degrees)
These angles are meant to represent different levels of market movement, with each one acting as either support or resistance depending on the direction of the price trend. The angles fan out from the initial price point, forming a framework that allows traders to visualize how price action interacts with these theoretical levels.
Using charting software, traders can easily apply the Gann Fan by selecting the desired starting point and having the software automatically plot the angles. This fan is not just a visual tool, but a predictive mechanism for future price movements.
3.2. Interpreting Gann Fan Lines
Each line in the Gann Fan represents a different level of market strength, with steeper angles indicating stronger trends and flatter angles reflecting weaker trends. When price moves along or near one of these lines, it signals a balance between price and time for that specific rate of change. When price deviates from these lines, it suggests a shift in market momentum.
For example:
- If price rises and holds above the 1×1 line, it indicates a strong upward trend, where the market is moving in harmony with both price and time.
- A break below the 1×1 angle suggests a weakening trend and may signal a potential reversal.
- Similarly, if price approaches the 1×2 or 1×4 lines, it indicates a slower trend, with these angles often acting as support or resistance.
Traders use these lines to gauge market strength and predict potential turning points. When price respects these angles, the market is often in a stable trend, but when price breaks away from the angles, it can indicate volatility or a shift in trend direction.
3.3. Using the Gann Fan for Price Projection and Reversal Identification
One of the key applications of the Gann Fan is projecting future price levels and identifying potential reversals. As price moves through the fan, each line can serve as a potential support or resistance level. For instance, when the price is moving upward and nears the 1×1 line, traders can anticipate whether the price will continue to rise or reverse based on how it interacts with this line.
If price fails to hold above one of the steeper angles, such as the 2×1 or 1×1 lines, it can indicate that the trend is losing strength, which might signal an impending reversal. Conversely, if price breaks through these levels with momentum, it suggests that the trend is likely to continue.
By observing how price behaves around the different Gann angles within the fan, traders can not only forecast potential price targets but also identify when the market might be ready for a correction or reversal. This makes the Gann Fan a valuable tool for both short-term and long-term traders, offering insights into market behavior at various stages of a trend.
| Section | Description |
|---|---|
| Construction of a Gann Fan | A series of Gann angles drawn from a significant price point, fanning out to form a predictive framework for price movement. |
| Interpreting Gann Fan Lines | Each line represents different levels of market strength, with steeper angles indicating stronger trends and flatter angles indicating weaker trends. |
| Price Projection and Reversal Identification | The Gann Fan helps traders predict future price levels and identify potential market reversals by analyzing how price interacts with the fan’s angles. |
4. The Gann Square of Nine
The Gann Square of Nine is one of the most famous tools derived from Gann Theory. It’s a unique mathematical concept that maps price movements in a spiral pattern, allowing traders to calculate significant price levels and turning points in the market. The Square of Nine is based on a numerical grid that spirals outward, starting from the number 1 at the center and progressing outward in a clockwise direction. This tool helps traders identify price support and resistance levels, calculate potential price targets, and forecast market reversals based on mathematical relationships between numbers.
4.1. The Concept of the Gann Square
At its core, the Gann Square of Nine is a mathematical grid that relates numbers to angles, with the belief that specific price levels are influenced by these angles. Gann theorized that certain prices, when mapped onto the Square of Nine, had significant relationships with other prices based on geometric angles.
The numbers in the Square of Nine spiral outward from the center, creating a structured relationship between price levels. By applying angular degrees (such as 45°, 90°, 180°, and 360°), traders can use the Square of Nine to predict price movement and turning points. The concept is that each number on the square has a natural relationship to other numbers that correspond to specific angles, making it a powerful tool for forecasting price targets and reversals.
4.2. Calculating Gann Square Numbers
To use the Square of Nine, traders convert price levels into corresponding numbers on the square, and then calculate price targets based on their angular relationships. Gann believed that key angles such as 45°, 90°, and 180° were particularly important for predicting price levels.
For example:
- To calculate a 90-degree price move from a specific number on the square, you would identify the number and find its 90° rotation on the grid.
- A 180° move would be the price level directly opposite the initial number, representing a potential reversal point in the market.
This method allows traders to calculate future price levels based on the assumption that markets move in predictable cycles, influenced by these geometric angles. By understanding how numbers on the square relate to one another, traders can project potential price targets with a high degree of precision.
4.3. Applying Gann Square Numbers to Trading
In practical terms, applying Gann Square of Nine numbers involves using the mathematical relationships to identify key price levels on a chart. Traders apply these numbers to pinpoint support and resistance zones, price targets, and potential reversal points.
For instance, if a stock is trading at $100, a trader could use the Square of Nine to calculate that a 90-degree move upward from this level might project a target of $110, while a 180-degree move might suggest a reversal point near $120. Similarly, a downward 90-degree move could forecast a support level at $90.
By incorporating these calculated levels into their technical analysis, traders can make more informed decisions about when to enter or exit trades, set stop-loss levels, and anticipate market reversals.
4.4. Using the Gann Square for Price Targets and Reversal Points
The Square of Nine is particularly useful for predicting price targets and identifying potential reversal points in the market. The geometric relationships between numbers on the square provide clear signals of when price may hit a significant turning point.
Traders often use this tool in conjunction with other forms of technical analysis to confirm signals. For example, if a trader notices that a price level calculated using the Square of Nine coincides with a support or resistance level on a traditional price chart, it adds further weight to the likelihood of a reversal or continuation at that level.
This makes the Gann Square of Nine a versatile tool for both short-term traders looking to time entries and exits, and long-term traders seeking to identify broader market cycles and key price levels.
| Section | Description |
|---|---|
| Concept of the Gann Square | A mathematical grid that maps price levels based on angular relationships, with the belief that specific angles influence market behavior. |
| Calculating Gann Square Numbers | Traders calculate price targets based on angular relationships like 45°, 90°, and 180°, using the grid to project future market movements. |
| Applying Gann Square Numbers to Trading | By applying calculated numbers to charts, traders identify key support, resistance, and price targets for potential market reversals. |
| Price Targets and Reversal Points | The Gann Square of Nine helps traders forecast potential price targets and turning points based on the geometric relationships between price levels. |
5. The Gann Wheel
The Gann Wheel, sometimes referred to as the “Wheel of 24” or simply the “Gann Wheel,” is another advanced tool in Gann Theory, focusing on the relationship between price and time through cyclical analysis. Similar to the Square of Nine, the Gann Wheel helps traders calculate future price levels and time cycles by examining how markets rotate in predictable patterns. This circular tool is divided into sections, each representing key angles and degrees, which traders use to forecast potential market movements.
5.1. The Structure of the Gann Wheel
The Gann Wheel is constructed as a circular grid that organizes numbers and angles in a symmetrical format. It’s divided into 24 sections, with each section representing a specific angle or degree of price movement. These degrees correspond to certain price levels or time cycles in the market. The structure of the Gann Wheel allows for both the mathematical and geometric representation of market trends, integrating price and time in a visually intuitive way.
The wheel’s layout is designed to help traders identify significant price levels, time cycles, and market turning points. At its core, the Gann Wheel reflects the principle that markets move in circular patterns, and by using this wheel, traders can project how prices might evolve over time.
5.2. Interpreting Gann Wheel Angles
The key to using the Gann Wheel lies in understanding the importance of the various angles and how they influence market behavior. Each angle on the wheel represents a specific relationship between price and time, much like the Gann Angles or the Square of Nine.
For example:
- The 45-degree angle often represents equilibrium between price and time, much like in Gann’s 1×1 angle.
- A 90-degree angle represents a strong turning point, indicating potential resistance or support in price movements.
- 180-degree and 360-degree angles represent full cycle movements, which often correspond to major market reversals.
By analyzing how prices interact with these angles on the wheel, traders can anticipate market turning points, support and resistance levels, and even the length of time cycles. This makes the Gann Wheel a powerful tool for identifying key moments in market trends and making more accurate predictions about future price movements.
5.3. Using the Gann Wheel for Time Cycle Analysis
One of the primary uses of the Gann Wheel is for time cycle analysis, which is a core concept in Gann Theory. Gann believed that markets move in cycles, and these cycles are not only tied to price movements but also to time. The Gann Wheel helps traders visualize these time cycles, making it easier to forecast when significant market events are likely to occur.
For instance, a trader might use the Gann Wheel to predict when a stock or commodity will reach a certain price level based on the cyclical movement of time. By aligning specific time cycles with the angles on the wheel, traders can forecast potential reversal points or periods of market strength and weakness.
The wheel’s design, with its symmetrical divisions, allows for precise measurement of time intervals, which can help traders determine when to enter or exit trades based on the anticipated length of a market cycle. This application of the Gann Wheel for time cycle analysis is one of the reasons it remains a valued tool for traders who follow Gann Theory.
| Section | Description |
|---|---|
| Structure of the Gann Wheel | A circular grid divided into 24 sections, representing price and time relationships, used for market forecasting. |
| Interpreting Gann Wheel Angles | Different angles on the wheel (e.g., 45°, 90°, 180°) indicate key turning points and relationships between price and time. |
| Time Cycle Analysis | The Gann Wheel is used to analyze market time cycles, helping traders predict when significant market events or reversals may occur. |
6. Gann Analysis and Price Action
One of the most powerful aspects of Gann Theory is its ability to be combined with price action trading, a strategy that relies on analyzing raw price movements rather than relying solely on indicators. By integrating Gann’s principles with price action, traders can gain a more comprehensive understanding of market dynamics, enhancing their ability to predict future price movements and make informed trading decisions.
6.1. Combining Gann Theory with Price Action Trading
Price action trading involves studying the movement of price on a chart, typically through the analysis of candlesticks, trends, and support/resistance levels, without using a lot of external indicators. Gann Theory complements this approach by offering a framework to measure and forecast price movements based on geometry, time cycles, and market structure.
By combining Gann angles, the Gann Fan, or the Square of Nine with price action, traders can enhance their ability to identify significant price levels, trends, and potential reversals. For example, if a trader notices a bullish price pattern forming around a key Gann angle or time cycle, it provides a strong confirmation of the pattern’s validity. Similarly, Gann’s tools can help define where the next support or resistance might be, giving traders an edge when planning their entries and exits.
The use of Gann Theory in price action trading brings a multi-dimensional aspect to the analysis, as it integrates both time and price considerations, helping traders to view market trends from a broader perspective.
6.2. Identifying Key Price Action Patterns in Relation to Gann Angles and Squares
Gann Theory can significantly enhance the identification of key price action patterns by providing a predictive framework based on angles and time cycles. Common price action patterns like breakouts, reversals, and continuation setups often align with key Gann levels, offering more robust trading signals.
For example:
- Breakouts: When price breaks through a significant Gann angle (such as the 1×1 line), it often signals the beginning of a new trend. Traders can use price action patterns like candlestick formations or volume surges to confirm this breakout.
- Reversals: Price reversals often occur near key Gann angles or calculated levels from the Square of Nine. Traders can look for reversal patterns, such as dojis or engulfing candles, at these levels to anticipate a change in trend direction.
- Trend Continuations: If price respects a particular Gann angle or time cycle, it can suggest the continuation of the current trend. Traders using price action can watch for pullbacks or consolidation patterns around these levels to identify entry points for trend-following trades.
By mapping price action patterns onto Gann’s geometric and cyclical tools, traders can add another layer of confirmation to their trading decisions, increasing the probability of success.
6.3. Using Gann Theory to Confirm or Refute Price Action Signals
One of the most valuable aspects of Gann Theory is its ability to either confirm or refute the signals generated by price action analysis. While price action traders rely heavily on patterns like double tops, head and shoulders, or trendlines, Gann Theory offers additional insight by factoring in time and geometry.
For example:
- A trader who identifies a potential breakout might consult Gann angles to see if the price is breaking through a significant 45-degree or 90-degree angle. If the breakout coincides with a key Gann level, it confirms the strength of the move.
- Conversely, if a price action pattern suggests a breakout, but Gann Theory indicates that price is approaching a major resistance level or a reversal point, traders may decide to hold off or adjust their strategy.
In this way, Gann Theory serves as a validation tool. It either strengthens the price action signals or warns traders to be cautious. This ability to confirm or refute signals based on time cycles and price geometry helps traders avoid false breakouts or poorly timed entries, improving the overall reliability of their trades.
| Section | Description |
|---|---|
| Combining Gann Theory with Price Action | Gann Theory complements price action trading by offering a framework to measure and predict price movements based on time cycles and angles. |
| Key Price Action Patterns and Gann | Gann tools help traders identify key price action patterns like breakouts, reversals, and continuations at critical Gann levels. |
| Confirming or Refuting Price Action Signals | Gann Theory provides additional confirmation or warning signals for price action trades, improving the reliability of trading decisions. |
7. Gann Theory and Time Cycle Analysis
Time cycles are a cornerstone of Gann Theory, reflecting W.D. Gann’s belief that market movements are not only driven by price but also governed by the passage of time. Gann asserted that just as prices move in patterns, time cycles repeat, creating opportunities for traders to anticipate market turns and key events. Time cycle analysis is essential in identifying significant turning points and understanding the ebb and flow of market trends over different periods.
7.1. The Importance of Time Cycles in Trading
In Gann Theory, time is just as critical as price, and the balance between the two forms the basis of predicting future market movements. Gann believed that markets move in repetitive cycles, and by analyzing past time cycles, traders can forecast when key market events like highs, lows, or reversals are likely to occur again.
Time cycles allow traders to understand not just where the market is likely to go, but also when significant price movements may happen. By identifying these cycles, traders can prepare for potential market shifts and plan their trades accordingly. This is especially useful for traders who aim to time their entries and exits in alignment with significant cyclical patterns.
Understanding time cycles provides a critical edge, as traders who grasp these repeating patterns are better equipped to anticipate the duration of trends, the timing of corrections, and when key reversals are likely to take place.
7.2. Using Gann Theory to Identify Significant Time Cycles
Gann Theory offers several methods for identifying significant time cycles, ranging from short-term daily cycles to longer-term cycles that span years or even decades. The theory suggests that certain time intervals—such as 30, 60, 90, 180, and 360 days—are particularly influential in shaping market trends. These intervals are tied to the natural laws that Gann believed governed market movements.
For example:
- A 90-day cycle might highlight a key reversal in a stock or commodity price.
- A 360-degree time cycle, which corresponds to a full revolution of the Gann Wheel, could signal a major market top or bottom.
Gann’s approach often involved measuring time from significant market highs or lows, using key dates to project future turning points. By plotting these cycles on a price chart, traders can observe how past cycles repeat and where they might expect future reversals or continuation patterns.
In practice, traders using Gann’s time cycle analysis watch for key market events around these time intervals, using them to time their trades and anticipate price movements in the future.
7.3. Applying Time Cycle Analysis to Trading Decisions
Applying time cycle analysis to trading decisions involves syncing market movements with expected cyclical patterns. Traders who recognize these time cycles can use them to their advantage by adjusting their trading strategies based on where the market is in its cycle.
For instance:
- If a trader identifies that the market is approaching the end of a 180-day cycle, they might anticipate a significant reversal or correction and adjust their positions accordingly.
- Conversely, if the market is in the middle of a cycle and showing strength, the trader might decide to continue riding the trend, expecting the market to stay strong until the end of the cycle.
By using Gann’s time cycles, traders can time their trades with greater precision, aligning their decisions with predictable market rhythms. Time cycle analysis can also provide traders with more clarity in periods of uncertainty, helping them gauge how long a trend is likely to last or when a significant market event might occur.
| Section | Description |
|---|---|
| Importance of Time Cycles in Trading | Time cycles help traders understand when key market events like reversals or trend continuations are likely to occur, offering an additional layer to price analysis. |
| Identifying Significant Time Cycles | Gann Theory emphasizes key time intervals (30, 60, 90, 180, 360 days) to identify significant market turning points and potential reversals. |
| Applying Time Cycle Analysis | Traders use time cycle analysis to time entries and exits, adjust strategies, and anticipate market behavior based on repeating time patterns. |
8. Gann Theory and Astrology
One of the more controversial and intriguing aspects of Gann Theory is its connection to astrology. W.D. Gann believed that planetary movements and astrological cycles had a direct influence on market behavior. While many traders dismiss this element of Gann’s work, others see value in incorporating astrological cycles into their technical analysis, arguing that these cycles can offer additional insights into market timing and behavior.
8.1. The Connection Between Gann Theory and Astrology
Gann’s belief in the influence of astrology on the markets stems from his broader view that natural laws govern all aspects of life, including financial markets. He believed that planetary cycles, which have been observed for centuries as influencing human behavior, also had an impact on market cycles. According to Gann, certain planetary alignments or movements could coincide with market tops, bottoms, or periods of heightened volatility.
For example, Gann believed that the positions of planets such as Saturn, Jupiter, and Mercury at key points in their orbits could signal major market events. These planetary cycles, when mapped to time cycles in the markets, could help traders anticipate turning points, especially during times of significant astrological events like eclipses or conjunctions.
While astrology is not widely accepted in mainstream technical analysis, Gann’s integration of these ideas into his market forecasting methods reflects his holistic approach to understanding market behavior.
8.2. Using Astrological Cycles to Complement Gann Analysis
For traders who are open to the idea of astrological cycles, Gann’s methods can be expanded to include the influence of planetary movements alongside traditional Gann angles and time cycles. By incorporating both astrological and geometric principles, traders can add another layer of analysis to their trading strategy.
For instance, a trader might notice a market approaching a key Gann angle or completing a time cycle, and they could look at astrological charts to see if any significant planetary alignments are occurring at the same time. If an important conjunction or eclipse is happening, it may reinforce the likelihood of a major market movement.
Astrological analysis can also be used to complement Gann’s time cycles, as certain astrological events occur at regular intervals that align with Gann’s cyclical approach to markets. For example, a trader might use a combination of Gann’s 360-day cycle and astrological transits to forecast when a market will experience a major reversal.
8.3. Potential Benefits of Incorporating Astrology into Trading Strategies
While the idea of using astrology in trading is not universally accepted, those who do incorporate it into their strategies often argue that it offers a broader perspective on market behavior. Astrology, when used alongside Gann Theory, can provide traders with additional tools to time market entries and exits more precisely.
Some of the potential benefits include:
- Additional Confirmation of Market Cycles: When astrological cycles align with Gann’s time cycles, traders may feel more confident in their analysis of upcoming market movements.
- Better Timing of Key Market Events: Traders who follow planetary movements can use astrology to anticipate periods of market volatility or calm, helping them prepare for sudden changes.
- Increased Awareness of Non-Traditional Influences: Astrology offers a unique perspective on market behavior, allowing traders to consider factors beyond traditional technical analysis, which could be useful during times of market uncertainty.
That being said, astrology should not be relied upon as the sole basis for trading decisions. Traders who use Gann’s astrological techniques typically do so in conjunction with more traditional forms of analysis to enhance their market insights.

| Section | Description |
|---|---|
| Connection Between Gann Theory and Astrology | Gann believed that planetary movements influenced market cycles, integrating astrological principles with his market forecasting methods. |
| Using Astrological Cycles | Traders can use astrological events, such as planetary alignments, in conjunction with Gann’s time cycles and angles to forecast market turning points. |
| Potential Benefits of Astrology in Trading | Astrology can provide traders with additional tools for market timing and enhance their understanding of market behavior, especially during volatile periods. |
9. Gann Theory Software and Tools
As technology has advanced, Gann Theory has evolved from being manually plotted on charts to being incorporated into specialized software tools that automate the process of analyzing angles, time cycles, and other elements of Gann’s methodology. These tools have made it easier for traders to apply Gann’s techniques in real-time, allowing for more precise and efficient analysis of market conditions. Gann Theory software helps traders visualize and interpret complex data without needing to perform the calculations manually.
9.1. Overview of Available Gann Theory Software
There are several software programs available today that integrate Gann Theory into their charting and analysis tools. These platforms allow traders to plot Gann angles, Gann Fans, Square of Nine levels, and time cycles on their charts with ease. Some of the most commonly used platforms include:
- MetaStock: A widely used platform that includes Gann analysis tools, allowing traders to easily apply Gann angles, Fans, and time cycle analysis.
- Optuma: A more specialized software focused heavily on Gann’s techniques, offering in-depth Gann analysis features such as the Square of Nine, Gann Wheels, and time cycle projection.
- TradingView: Though primarily known for its user-friendly charting tools, TradingView also supports Gann analysis through built-in Gann Fans and angles, enabling users to apply Gann’s methods to their charts.
These software solutions provide traders with the ability to quickly analyze charts and apply Gann Theory to various asset classes, from stocks to commodities to cryptocurrencies.
9.2. Benefits and Drawbacks of Using Gann Theory Software
Using Gann Theory software offers several advantages for traders, making it easier to implement the complex calculations and visualizations required by Gann’s methods. However, there are also some limitations to consider when using these tools.
Benefits:
- Automation of Complex Calculations: Gann Theory involves intricate calculations that can be time-consuming when done manually. Software tools automate these processes, making it easier for traders to focus on analysis rather than calculations.
- Increased Accuracy: Software ensures that Gann angles, time cycles, and other elements are plotted precisely, reducing the likelihood of human error in manual calculations.
- Visual Representation: These tools provide traders with clear visual representations of Gann angles, Fans, and time cycles, allowing for a more intuitive understanding of market movements and potential price targets.
- Real-Time Application: With modern Gann software, traders can apply Gann Theory in real time, allowing them to react quickly to market movements and changes.
Drawbacks:
- Learning Curve: Gann Theory is already a complex subject, and using specialized software adds another layer of complexity. Traders need time to learn how to use the tools effectively.
- Cost: Many of the advanced Gann software programs come with subscription fees or high upfront costs, which may not be suitable for all traders, especially beginners.
- Overreliance on Software: While software can simplify Gann analysis, traders may become overly dependent on the tools, potentially overlooking the broader market context or other forms of analysis.
9.3. Tips for Choosing the Right Software for Your Needs
When choosing a Gann Theory software, it’s important to consider your specific trading needs, skill level, and budget. Here are some tips to help you select the right software:
- Assess Your Trading Style: If you are a short-term trader focused on quick entries and exits, choose software that offers real-time charting and quick plotting of Gann angles. For long-term traders, opt for software with more in-depth time cycle analysis features.
- Consider Your Experience with Gann Theory: If you’re new to Gann Theory, look for software with a user-friendly interface and educational resources that can help you understand how to apply Gann’s techniques.
- Budget: Evaluate the cost of the software in relation to your trading capital. Some platforms, like TradingView, offer free or lower-cost access to Gann tools, while others, such as Optuma, provide more advanced features but at a higher price.
- Compatibility with Other Tools: Ensure the software integrates well with other technical analysis tools and charting platforms that you may already be using in your trading strategy.
| Section | Description |
|---|---|
| Overview of Gann Theory Software | Various platforms like MetaStock, Optuma, and TradingView provide Gann analysis tools for easy application of Gann angles, Fans, and time cycles. |
| Benefits and Drawbacks | Benefits include automation and accuracy, while drawbacks include cost and the potential for overreliance on software. |
| Choosing the Right Software | Consider your trading style, experience, budget, and integration needs when selecting the best Gann Theory software for your trading. |
10. Gann Theory Strategies and Examples
Gann Theory offers a wide range of trading strategies based on the principles of time cycles, price patterns, and geometric angles. Traders can apply these strategies to different markets, including stocks, commodities, and even cryptocurrencies. Understanding and implementing Gann Theory in a real-world context requires a combination of theoretical knowledge and practical application. In this section, we will explore common Gann trading strategies, real-world examples, and case studies of successful trades that demonstrate the practical use of Gann’s methods.
10.1. Common Gann Theory Trading Strategies
Several trading strategies have emerged from Gann’s work, each designed to leverage the geometric and cyclical principles of his theory. Below are some of the most commonly used Gann Theory strategies:
1. Gann Angle Strategy
This strategy involves drawing key Gann angles (e.g., 1×1, 2×1, 1×2) from a significant high or low point on the chart to identify potential areas of support and resistance. Traders use these angles to predict where price might reverse or continue a trend. For instance, if a price approaches a 1×1 angle and holds above it, this could signal strength and an opportunity to buy, whereas a breakdown below the angle might indicate weakness and a potential sell signal.
2. Time Cycle Trading Strategy
Gann’s emphasis on time cycles can also be used to time entries and exits. Traders look for patterns in the market where price tends to make significant moves every 90, 180, or 360 days. By aligning trades with these cycles, traders can enter or exit positions when the time cycle signals that a trend might be reaching exhaustion or about to reverse.
3. Gann Square of Nine for Price Targets
The Square of Nine is a tool that helps traders calculate price targets based on key price levels. In this strategy, traders identify price levels corresponding to specific degrees (such as 90°, 180°, and 360°) on the Square of Nine and use these to project future price levels. For instance, a trader might project that a stock trading at $50 could reach $55 if it moves by 90°, providing a clear price target for their trade.
10.2. Real-World Examples of Applying Gann Theory to Various Markets
Gann Theory has been applied to numerous markets with varying degrees of success. Below are examples of how traders have used Gann’s methods in different asset classes.
1. Stock Market Example
In the stock market, a trader might apply the Gann Fan to identify potential support and resistance levels during an uptrend. For instance, using a significant low point in a stock’s price, they draw a Gann Fan with angles like 1×1 and 2×1. If the stock approaches the 1×1 angle and finds support, it could signal that the trend will continue, providing a buying opportunity. Conversely, if the price breaks below the 1×1 angle, it might indicate that the stock is losing momentum and could reverse direction.
2. Commodities Market Example
Gann Theory is frequently applied in the commodities market, particularly for longer-term cycles. A trader might analyze the price of gold and notice that every 180 days, the market experiences a significant move. By aligning trades with this time cycle, the trader could position themselves ahead of a major price move, using time cycle analysis to time entries and exits more effectively.
3. Cryptocurrency Example
In the volatile cryptocurrency market, Gann Theory can help traders identify key support and resistance levels. For example, using the Square of Nine, a trader might calculate key price targets for Bitcoin based on its past price movements. If Bitcoin is trading at $30,000, the trader could use Gann’s methods to project a potential reversal point at $32,000 based on a 90-degree move, guiding their decision to take profit at that level.
10.3. Case Studies of Successful Gann Theory Trades
Several case studies showcase how traders have successfully applied Gann Theory to real-world markets:
1. Historical Case Study: 1929 Stock Market Crash
W.D. Gann himself famously predicted the 1929 stock market crash using his time cycle analysis. Gann identified key cycles and dates that indicated the market was due for a major downturn, and he was able to forecast the crash with impressive accuracy. His use of time cycles and Gann angles allowed him to predict not only the timing of the crash but also the scale of the market correction.
2. Modern Case Study: Oil Market
In the early 2000s, a trader using Gann Theory correctly predicted a significant rise in oil prices by applying Gann angles and time cycle analysis. The trader noticed that oil prices had respected a key 1×1 Gann angle during the early stages of the trend. As prices continued to rise along this angle, the trader was able to maintain a long position, exiting only when oil hit a significant time cycle that coincided with a market top.
These case studies highlight the practical applications of Gann Theory and demonstrate how traders can use it to anticipate market movements with greater precision.
| Section | Description |
|---|---|
| Common Gann Trading Strategies | Gann Angle Strategy, Time Cycle Trading, and Square of Nine Price Targets are among the most widely used Gann trading methods. |
| Real-World Market Applications | Gann Theory has been successfully applied to stocks, commodities, and cryptocurrencies to forecast price targets and time market reversals. |
| Successful Gann Case Studies | Historical and modern case studies show the effectiveness of Gann’s methods in predicting major market events, including the 1929 crash and the oil market boom. |
Conclusion
Gann Theory is a multifaceted and powerful approach to market analysis that combines geometry, time cycles, and natural laws to forecast price movements. While it may appear complex at first, traders who dedicate time to mastering Gann’s methods can gain a deeper understanding of market behavior and enhance their trading strategies. From the use of Gann angles and the Gann Fan to the more advanced Square of Nine and Gann Wheel, this theory offers a robust framework for identifying key price levels, predicting market reversals, and timing entries and exits.
The Importance of Price and Time
One of the key takeaways from Gann Theory is the emphasis on the relationship between price and time. Gann believed that markets operate in cyclical patterns and that by analyzing both price movements and time intervals, traders could predict future trends with a higher degree of accuracy. This balance between price and time provides traders with a unique perspective on the market, allowing them to make more informed decisions.
Practical Applications in Modern Trading
Although Gann Theory was developed in the early 20th century, it remains relevant in today’s markets, whether applied to stocks, commodities, or cryptocurrencies. Modern software has made it easier to implement Gann’s complex calculations, allowing traders to apply these methods in real-time. By integrating Gann’s principles with price action trading or other technical analysis tools, traders can sharpen their market predictions and improve their trading results.
Challenges and the Path to Mastery
While Gann Theory offers many advantages, it is not without its challenges. The complexity of Gann’s methods, particularly when it comes to time cycle analysis and the use of tools like the Gann Wheel and Square of Nine, can be daunting for new traders. However, those who invest the time to understand and apply these concepts often find that Gann Theory provides them with a unique edge in the market.
In conclusion, Gann Theory is more than just a collection of technical tools—it is a philosophy of market behavior rooted in the natural laws of geometry, time, and cycles. Traders who embrace this theory can gain a deeper understanding of market dynamics and enhance their ability to forecast future price movements. Whether you are a long-term investor or a short-term trader, Gann’s principles can help you navigate the complexities of the market with greater precision and confidence.