1. Overview of Demand and Supply Zones
Understanding supply and demand is crucial for analyzing financial markets. These fundamental economic concepts are the backbone of price movement, shaping trends and reversals on trading charts. In trading, supply and demand are not just abstract notions; they manifest as observable price patterns known as supply and demand zones. Traders who master these zones can enhance their ability to predict market behavior and identify profitable opportunities.
1.1. Defining Supply and Demand in Market Terms
Supply refers to the amount of a financial instrument that market participants are willing to sell at various price levels. As prices increase, sellers are generally more inclined to offload their holdings, leading to a rise in supply. Conversely, demand represents the quantity of an instrument buyers are prepared to purchase at different prices. Typically, lower prices attract more buyers, increasing demand.
The interplay of supply and demand determines the market price. When demand surpasses supply, prices rise, reflecting buyers’ eagerness to acquire the asset. On the other hand, when supply exceeds demand, prices fall, as sellers compete to attract buyers.
1.2. What Are Supply and Demand Zones in Trading?
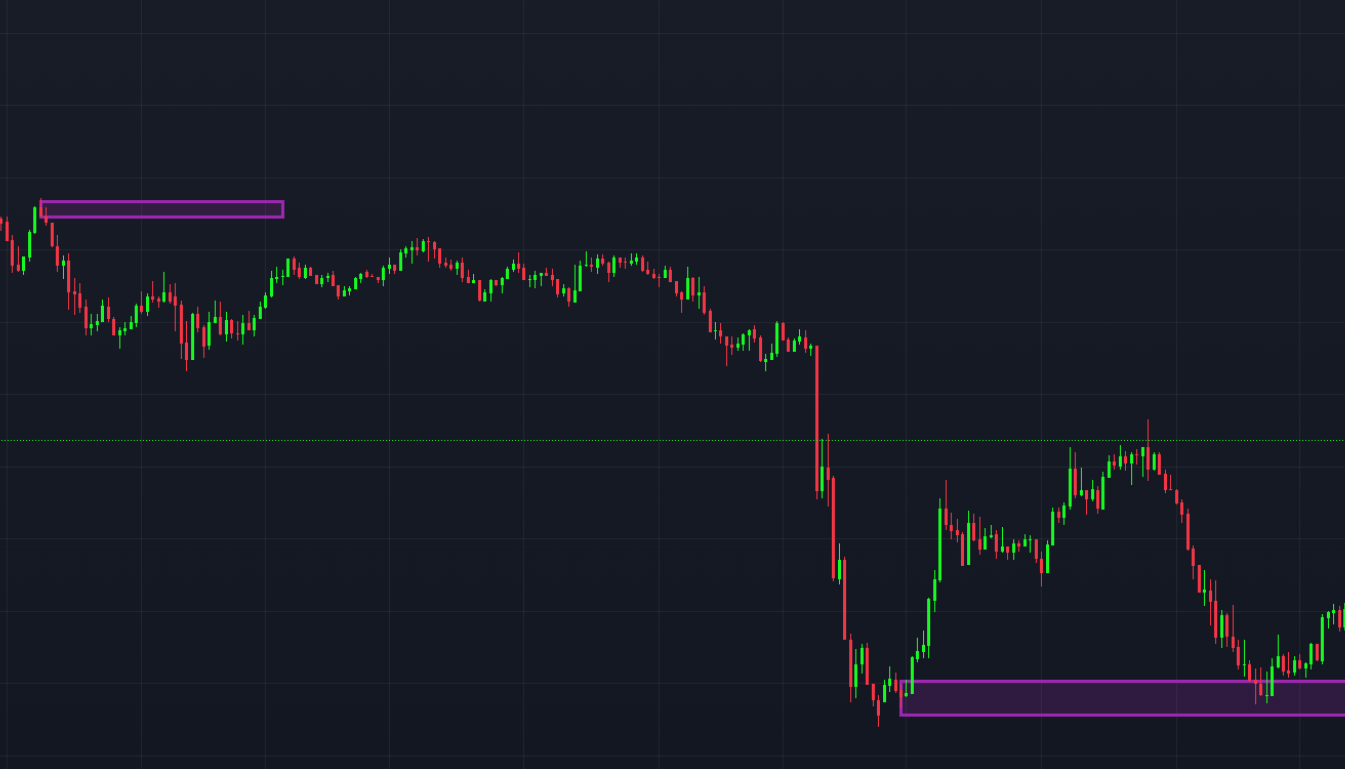
In trading, supply and demand zones are areas on a price chart where significant reversals or consolidations have occurred due to imbalances between buyers and sellers. These zones are essential tools for traders, offering a visual representation of price areas where buying or selling pressure is historically strong.
A demand zone, often referred to as a support level, is a price range where buyers have consistently outnumbered sellers, driving the price upward. Conversely, a supply zone, also known as a resistance level, is an area where selling pressure has historically exceeded buying interest, causing the price to decline.
Supply and demand zones differ from traditional support and resistance levels. While support and resistance are often identified as single horizontal lines, supply and demand zones encompass a range of prices. This broader perspective accounts for market fluctuations within these critical areas, providing traders with more flexibility and accuracy.
1.3. Why Supply and Demand Zones Work: The Psychology and Order Flow Behind the Zones
The effectiveness of supply and demand zones lies in the underlying principles of market psychology and order flow. These zones represent areas of collective memory for traders. For instance, if a demand zone has previously sparked a strong rally, traders anticipate similar behavior when the price returns to that zone. This collective expectation creates self-fulfilling behavior, as buyers place orders in anticipation of a price increase.
Order flow further reinforces the power of these zones. Large institutional traders, such as hedge funds or banks, often execute substantial orders in phases to avoid disrupting the market. If a significant buy order was partially filled in a demand zone, the remaining unfulfilled portion may trigger additional buying activity when the price revisits that area. Similarly, a supply zone may contain unfilled sell orders, leading to renewed selling pressure during a price return.
1.4. The Importance of Supply and Demand Zones in Trading
Supply and demand zones are indispensable for traders aiming to improve their performance. These zones allow traders to identify optimal entry and exit points. For example, buying near a demand zone where price increases are likely, or selling near a supply zone where declines are expected, can significantly enhance trading outcomes.
Moreover, supply and demand zones play a critical role in risk management. Placing stop-loss orders just beyond these zones helps minimize potential losses, as a breach of the zone often signals a shift in market dynamics. Additionally, combining supply and demand analysis with other technical tools, such as trendlines or moving averages, can refine strategies and improve accuracy.
Mastering the use of supply and demand zones equips traders with a deeper understanding of price behavior, enabling them to navigate markets with greater confidence and precision.
| Concept | Description |
|---|---|
| Supply | The amount of an asset market participants are willing to sell at various price levels. |
| Demand | The amount of an asset market participants are willing to buy at various price levels. |
| Demand Zone (Support) | A price area where buying pressure historically outweighed selling, leading to upward movements. |
| Supply Zone (Resistance) | A price area where selling pressure historically exceeded buying, causing downward movements. |
| Market Psychology | Traders’ collective memory of price zones that influences future buying or selling behavior. |
| Order Flow | The execution of large orders in stages, which impacts price action when zones are revisited. |
| Trading Importance | Recognizing these zones helps traders identify entries, exits, and manage risk effectively. |
2. Identifying Supply and Demand Zones (How to Draw Supply and Demand Zones)
Recognizing supply and demand zones on a price chart is a critical skill for traders. These zones highlight where price action has experienced significant reversals or consolidations, offering insights into potential future movements. By learning to identify and accurately draw these zones, traders can enhance their decision-making and improve trading outcomes.
2.1. Characteristics of Strong Supply and Demand Zones
A strong supply or demand zone is defined by specific price action characteristics. Understanding these traits is essential for spotting reliable zones that can guide trading strategies.
- Strong Price Moves Away from the Zone
A hallmark of a robust supply or demand zone is a sharp price movement away from it. For example, a demand zone that triggers a rapid upward price surge suggests significant buying interest. Similarly, a supply zone that causes a swift decline indicates strong selling pressure. - Multiple Touches Without a Break
Supply and demand zones gain credibility when prices test them multiple times without breaking through. These repeated tests confirm that the zone remains a key area of interest for buyers or sellers. - Fresh Zones
Fresh zones are those that have not yet been revisited or tested after their initial formation. These zones are particularly valuable because unfilled orders from the initial move may still be present, increasing the likelihood of a strong price reaction.
2.2. Step-by-Step Guide to Drawing Supply and Demand Zones
- Identify a Significant Price Move
Begin by spotting areas on the chart where prices have moved rapidly up or down. These areas often mark the origin of supply or demand zones. - Locate the Base of the Move
A supply or demand zone typically forms at the base of a sharp price move. Look for small-bodied candles, consolidations, or areas of minimal price action that precede the breakout or breakdown. - Mark the Zone
Use charting tools, such as rectangles in TradingView, to highlight the range of the zone. Include the high and low of the consolidation area for a demand zone or the rally area for a supply zone. - Validate the Zone
Confirm the zone by analyzing historical price action. Ensure that the zone aligns with one or more of the characteristics mentioned earlier, such as strong price moves or multiple touches. - Monitor the Zone for Reactions
Keep an eye on the price as it approaches the marked zone. Reactions at the zone, such as reversals or consolidations, can validate its effectiveness.
2.3. Identifying Supply and Demand Zones in TradingView
TradingView is a popular platform for technical analysis and offers user-friendly tools to draw supply and demand zones. To create these zones:
- Open your preferred chart and zoom into the timeframe relevant to your trading strategy.
- Use the rectangle drawing tool to mark the zone.
- Ensure that the marked area includes the entire price range of the consolidation or reversal.
2.4. Focus on Fresh Zones
Fresh zones are those that the market has not yet revisited. These zones are often more reliable because they represent areas where unfilled institutional orders may still exist. When the price approaches these zones for the first time, the likelihood of a strong reaction increases, providing better trading opportunities.
| Aspect | Description |
|---|---|
| Strong Price Move | Zones where the price has rapidly moved away, indicating high buying or selling interest. |
| Multiple Touches | Zones tested repeatedly without a break, confirming their reliability. |
| Fresh Zones | Zones that have not been revisited since their formation, increasing the probability of a reaction. |
| Drawing the Zone | Involves identifying the base of significant price moves and marking them with charting tools. |
| TradingView Tools | User-friendly options like rectangle tools to mark and monitor supply and demand zones. |
3. Supply and Demand Zones vs. Support and Resistance
Understanding the distinction between supply and demand zones and traditional support and resistance levels is essential for traders seeking accuracy in technical analysis. While both concepts are used to identify potential reversal points on a price chart, they differ significantly in their formation, interpretation, and application.
3.1. The Basics of Support and Resistance
Support and resistance are fundamental concepts in technical analysis. A support level is a price point where demand has historically been strong enough to halt a downtrend, while a resistance level is a price point where supply has been sufficient to stop an uptrend. These levels are often represented as single horizontal lines drawn at significant price levels on a chart.
3.2. Key Differences in Formation
The primary distinction between supply/demand zones and support/resistance lies in their formation. Supply and demand zones are broader areas on the chart where significant price action occurred, typically encompassing a range of prices rather than a single line. These zones represent regions of accumulated buy or sell orders, often left unfilled by large institutional traders.
In contrast, support and resistance levels are pinpointed at specific price points where the market has historically reversed. They are based on psychological price levels, such as round numbers or previous highs and lows, making them less dynamic than supply and demand zones.
3.3. Differences in Interpretation
Supply and demand zones emphasize the broader picture of market behavior. For example, a demand zone encompasses the entire range where buying interest led to a reversal, while support focuses solely on the price point where the reversal occurred. This difference in interpretation can significantly impact trading strategies:
- Supply and Demand Zones: Allow traders to anticipate reactions within a range, offering more flexibility in setting entry and exit points.
- Support and Resistance: Provide precise levels but may fail to account for minor fluctuations or wicks in price action.
3.4. Practical Implications for Trading
Recognizing the difference between supply/demand zones and support/resistance levels is crucial for improving trading precision. Traders using supply and demand zones gain a deeper understanding of price dynamics, as these zones reveal where market participants, especially institutions, placed significant orders. This insight helps traders:
- Identify Reliable Reversal Areas
By focusing on zones rather than single lines, traders can better anticipate potential price reactions and avoid false signals. - Refine Risk Management
Supply and demand zones offer a wider margin for placing stop-loss orders, reducing the likelihood of being stopped out by minor price fluctuations. - Combine Analysis Techniques
Integrating supply and demand zones with support and resistance levels can provide a more comprehensive view of the market, improving decision-making.
3.5. The Importance of Understanding the Difference
Failing to distinguish between these concepts can lead to misinterpretations and suboptimal trading outcomes. Traders who rely solely on support and resistance levels may overlook the broader market dynamics captured by supply and demand zones. Conversely, traders who understand and incorporate both approaches can develop more robust strategies, enhancing their ability to navigate various market conditions.
| Aspect | Supply and Demand Zones | Support and Resistance |
|---|---|---|
| Formation | Broad price ranges with significant buy/sell activity. | Specific price points based on historical highs or lows. |
| Representation | Zones marked by rectangles on the chart. | Horizontal lines drawn at key levels. |
| Precision | Offers flexibility by encompassing a range of prices. | Provides exact price levels but may miss minor fluctuations. |
| Psychological Basis | Reflects areas of institutional buying or selling. | Reflects psychological price points, such as round numbers. |
| Application in Trading | Suitable for dynamic strategies with broader stop-loss and entry zones. | Ideal for traders seeking precise price levels for entries/exits. |
4. Trading Strategies Using Supply and Demand Zones
Supply and demand zones are powerful tools in trading, offering insights into potential price reversals, continuation patterns, and breakout opportunities. Traders can use these zones in various ways to build strategies tailored to different market conditions. This section explores three main approaches: basic zone trading, confirmation techniques, and breakout strategies.
4.1. Basic Zone Trading
Trading directly from supply and demand zones is a foundational strategy that revolves around entering trades near these zones. The premise is straightforward: buy when prices approach a demand zone and sell when they reach a supply zone.
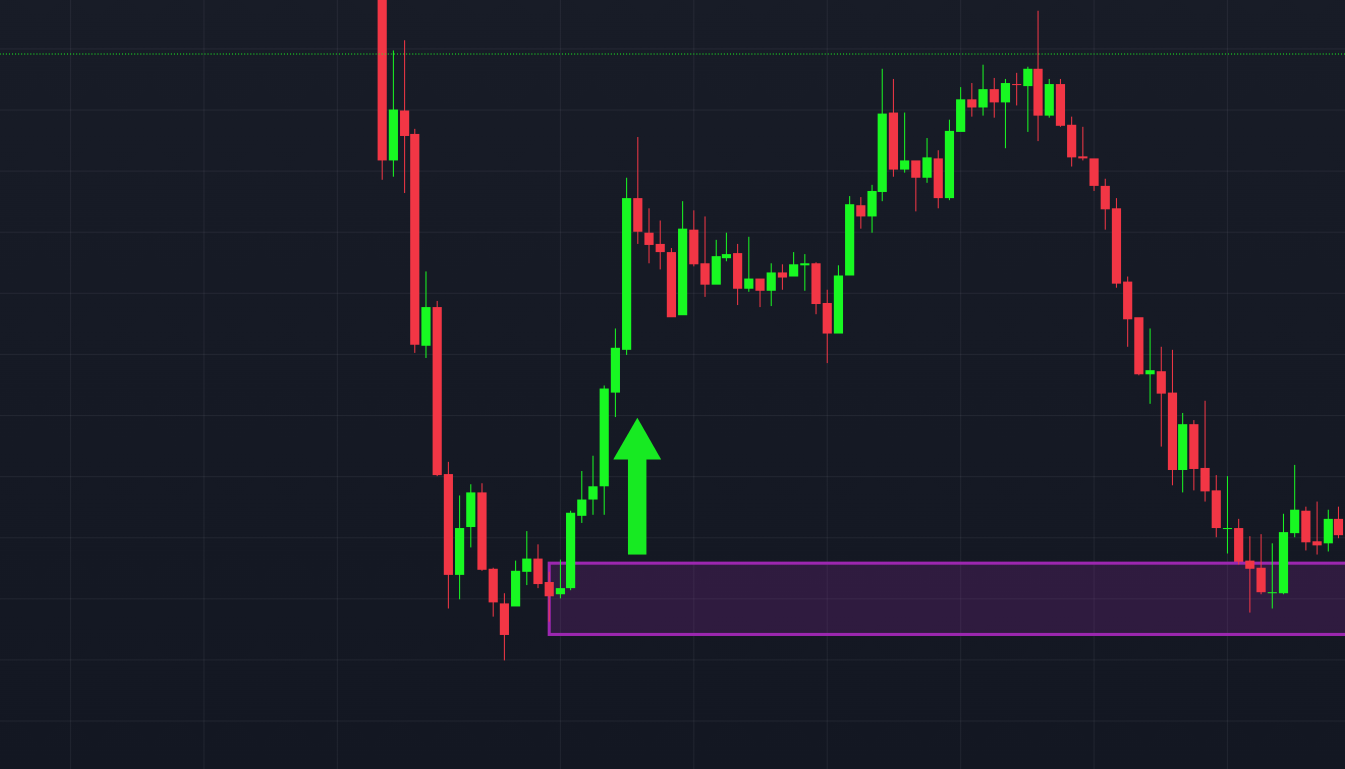
Entering Long at Demand Zones (Buying)
When the price enters a demand zone, traders look for buying opportunities, anticipating that the demand will push prices higher. The trade entry often occurs at or near the bottom of the zone.
Entering Short at Supply Zones (Selling)
Conversely, when the price moves into a supply zone, traders aim to sell, expecting selling pressure to drive prices downward. Entries are usually made at or near the top of the zone.
Setting Stop-Loss Orders
Risk management is critical in zone trading. Stop-loss orders should be placed just beyond the boundaries of the zones—below demand zones for buy trades and above supply zones for sell trades. This ensures that traders exit the trade promptly if the price breaches the zone, signaling a potential trend reversal.
Profit Targets Based on Price Action
Profit targets can be set using previous price action or other technical indicators. For example, traders might aim for a resistance level when buying from a demand zone or a support level when selling from a supply zone.
4.2. Confirmation Techniques (How to Confirm Supply and Demand Zones with Price Action)
Trading from supply and demand zones can be further refined by using confirmation techniques to increase the likelihood of success. These techniques involve waiting for additional evidence that the price is reacting to the zone before entering a trade.
Price Action Confirmation
Traders look for specific candlestick patterns near the zone to confirm price reversals. Patterns like bullish or bearish engulfing candles, pin bars, or inside bars can signal that the price is likely to reverse within the zone.
Volume Confirmation
An increase in trading volume at the zone often indicates that institutional players are active, reinforcing the validity of the zone. For example, a surge in volume at a demand zone suggests strong buying interest.
Using Candlestick Patterns
Candlestick patterns like hammers, shooting stars, or dojis at the zone provide additional confirmation of price reversals, making them a valuable tool for zone trading.
4.3 Trading Breakouts from Supply and Demand Zones (How to Trade Breakouts from Supply and Demand Zones)
Breakout trading involves capitalizing on price moves that breach supply or demand zones, indicating strong momentum in the direction of the breakout. This strategy is especially effective in volatile markets.
Identifying Valid Breakouts vs. False Breakouts
Valid breakouts are typically accompanied by strong price momentum and increased volume. False breakouts, on the other hand, often result in the price quickly returning to the zone. Traders can use tools like the Average True Range (ATR) to gauge the strength of a breakout.
Entry Strategies for Breakouts
Traders can enter breakout trades by placing pending orders just beyond the boundaries of the zone. For example, a buy stop order above a supply zone can capture an upward breakout, while a sell stop order below a demand zone can profit from a downward breakout.
Managing Risk in Breakout Trades
Stop-loss orders for breakout trades should be placed just inside the zone to minimize losses if the breakout fails. Additionally, traders can use trailing stops to lock in profits as the breakout progresses.
| Aspect | Description |
|---|---|
| Basic Zone Trading | Buying near demand zones and selling near supply zones, with stop-loss and profit targets. |
| Price Action Confirmation | Using candlestick patterns to confirm reactions within supply and demand zones. |
| Volume Confirmation | Monitoring volume spikes at zones to validate buying or selling interest. |
| Breakout Trading | Capturing momentum when prices break beyond supply or demand zones. |
| Managing Risk | Placing stop-loss orders just beyond zones or inside them for breakout trades to limit losses. |
5. Trading Supply and Demand Zones on Different Timeframes
Supply and demand zones are versatile tools that can be applied across multiple timeframes, allowing traders to adapt their strategies to various trading styles. Whether you’re a scalper seeking quick profits or a swing trader looking for long-term trends, understanding how these zones function on different timeframes is crucial. This section explores how supply and demand zones appear on various timeframes and the benefits of multi-timeframe analysis.
5.1. Supply and Demand Zones on Different Timeframes
Supply and demand zones are not confined to a single timeframe; they manifest on all charts, from monthly to minute-by-minute intervals. The key difference lies in their significance and the type of trading opportunities they present.
Higher Timeframes (Daily, Weekly, Monthly)
On higher timeframes, supply and demand zones represent major market levels where institutional buying or selling has occurred. These zones are often more significant and reliable because they reflect large-scale market activity. Traders who focus on higher timeframes often use these zones for swing or position trading, aiming to capitalize on long-term trends.
Lower Timeframes (Hourly, 15-Minute, 5-Minute)
Lower timeframes reveal more granular supply and demand zones, capturing smaller price movements. These zones are typically used by day traders or scalpers who look for quick entry and exit opportunities. While these zones may be less reliable than those on higher timeframes, they offer the advantage of frequent trading opportunities.
Interpreting Timeframe-Specific Zones
The importance of a supply or demand zone increases with the timeframe on which it appears. A zone identified on a weekly chart is generally more influential than one on a 15-minute chart because it reflects broader market participation and sentiment.
5.2. Multi-Timeframe Analysis: Combining Higher and Lower Timeframe Zones
Multi-timeframe analysis involves integrating supply and demand zones from different timeframes to create a comprehensive trading strategy. This approach allows traders to align their short-term trades with the broader market context.
Identifying Higher Timeframe Zones
Traders start by marking key supply and demand zones on higher timeframes, such as the daily or weekly chart. These zones act as major levels of interest and provide the overall market structure.
Refining Entries on Lower Timeframes
Once the higher timeframe zones are identified, traders zoom into lower timeframes to look for precise entry and exit points. For example, if a price approaches a weekly demand zone, a trader might use the 15-minute chart to identify a bullish candlestick pattern or a small demand zone for entry.
Advantages of Multi-Timeframe Analysis
- Enhanced Accuracy: Combining zones from multiple timeframes reduces the likelihood of false signals.
- Better Risk Management: Higher timeframe zones provide a broader perspective for placing stop-loss orders and setting profit targets.
- Increased Confidence: Aligning trades with higher timeframe trends boosts confidence in the trade setup.
Scalping, Day Trading, and Swing Trading with Supply and Demand Zones
Different trading styles utilize supply and demand zones in unique ways:
- Scalping: Traders focus on small zones in lower timeframes, aiming for quick profits from brief price movements.
- Day Trading: Day traders combine zones from hourly and 15-minute charts to identify intraday opportunities while aligning with broader trends.
- Swing Trading: Swing traders rely heavily on higher timeframe zones, entering trades that align with significant price levels for extended holding periods.
| Aspect | Description |
|---|---|
| Higher Timeframes | Major zones on daily, weekly, or monthly charts reflecting institutional activity. |
| Lower Timeframes | Smaller zones on hourly or minute charts offering frequent trading opportunities. |
| Multi-Timeframe Analysis | Combining zones from higher and lower timeframes for better accuracy and precision. |
| Scalping | Utilizing small, lower timeframe zones for quick profits. |
| Day Trading | Focusing on intraday zones while aligning with broader trends. |
| Swing Trading | Targeting higher timeframe zones for long-term trades. |
6. Risk Management in Supply and Demand Zone Trading
Risk management is an essential aspect of any trading strategy, particularly when trading supply and demand zones. While these zones provide high-probability setups, no trading strategy is foolproof. Effective risk management ensures that traders can protect their capital, minimize losses, and achieve consistent profitability over time.
6.1. Importance of Proper Risk Management
Trading supply and demand zones involves anticipating market reversals or breakouts, which can sometimes fail. Without proper risk management, a single unexpected market movement could result in significant losses. By incorporating risk management into their strategies, traders can:
- Safeguard their capital by limiting losses on any single trade.
- Preserve their ability to trade in the long term.
- Reduce emotional decision-making, fostering a disciplined approach.
6.2. Determining Appropriate Position Size
One of the key principles of risk management is determining the correct position size for each trade. This involves calculating how much of your trading capital to risk on a single trade, typically expressed as a percentage. For example, a common rule is to risk no more than 1-2% of your total trading account on any single trade.
Steps to Determine Position Size:
- Identify the distance between your entry point and stop-loss level in pips or points.
- Calculate your desired risk amount as a percentage of your account balance.
- Use a position sizing calculator or formula to determine the number of units or contracts to trade.
Setting Stop-Loss Orders Effectively
Stop-loss orders are a cornerstone of risk management in supply and demand zone trading. A stop-loss order automatically closes a trade if the price moves against the trader by a specified amount, preventing further losses.
Stop-Loss Placement:
- For demand zones, place the stop-loss slightly below the lower boundary of the zone to account for potential wicks or false breaks.
- For supply zones, set the stop-loss slightly above the upper boundary of the zone.
Proper stop-loss placement ensures that minor market fluctuations do not prematurely exit a trade, while still protecting against significant adverse movements.
6.3. Managing Risk-Reward Ratios
A favorable risk-reward ratio is another critical component of risk management. This ratio compares the potential profit of a trade to its potential loss. A common benchmark is a 1:2 risk-reward ratio, meaning the potential profit is at least twice the potential loss.
How to Calculate Risk-Reward:
- Measure the distance from the entry point to the stop-loss level (risk).
- Measure the distance from the entry point to the target price level (reward).
- Divide the reward by the risk to determine the ratio.
By maintaining a consistent risk-reward ratio, traders can remain profitable even if only a portion of their trades are successful.
| Aspect | Description |
|---|---|
| Importance of Risk Management | Protects capital, minimizes losses, and ensures long-term trading sustainability. |
| Position Sizing | Calculating trade size based on account risk percentage and stop-loss distance. |
| Stop-Loss Placement | Setting stop-loss orders beyond supply or demand zone boundaries to limit losses. |
| Risk-Reward Ratios | Comparing potential profit to loss, aiming for favorable ratios like 1:2 or higher. |
7. Best Supply and Demand Strategy for Swing Trading
Swing trading involves holding trades for several days to weeks, aiming to capitalize on medium-term price movements. For swing traders, supply and demand zones are particularly valuable because they identify key levels where institutional buying or selling activity has occurred. These zones offer reliable entry and exit points for trades aligned with the broader market trends. This section outlines the most effective ways to incorporate supply and demand zones into swing trading strategies.
7.1. Focusing on Higher Timeframe Zones
Swing traders prioritize higher timeframes, such as daily and weekly charts, to identify significant supply and demand zones. These zones represent areas of heightened market activity and are more reliable due to the larger volume of orders executed by institutions at these levels.
Why Higher Timeframe Zones Matter
Higher timeframe zones filter out the “noise” of minor intraday fluctuations, allowing swing traders to focus on the most meaningful price levels. These zones often act as strong barriers, where prices are more likely to reverse or consolidate.
7.2. Combining Supply and Demand Zones with Swing Trading Indicators
While supply and demand zones provide a strong foundation, combining them with other technical indicators enhances accuracy. Swing traders can use tools like moving averages, Fibonacci retracements, or Relative Strength Index (RSI) to confirm entries and exits.
- Moving Averages: Identify the broader trend direction and align trades with it. For instance, only look for buying opportunities in a demand zone during an uptrend.
- Fibonacci Retracements: Measure potential retracement levels within a trend to find confluences with supply or demand zones.
- RSI: Identify overbought or oversold conditions to confirm reversals at supply or demand zones.
7.3. Example Swing Trading Setups Using Supply and Demand
Buying from a Demand Zone in an Uptrend
- On the daily chart, identify a strong demand zone that coincides with a rising trend.
- Wait for the price to pull back into the zone and observe a bullish candlestick pattern, such as a hammer or engulfing candle, as confirmation.
- Place a buy order within the demand zone and set a stop-loss slightly below its lower boundary.
- Target the next significant resistance level or supply zone as the profit level.
Selling from a Supply Zone in a Downtrend
- On the weekly chart, identify a supply zone that aligns with a downward trend.
- Wait for the price to rally into the zone and confirm a reversal with a bearish candlestick pattern, such as a shooting star or bearish engulfing candle.
- Enter a short position within the supply zone and place a stop-loss just above its upper boundary.
- Set the profit target at the next demand zone or support level.
Advantages of Supply and Demand Strategies for Swing Trading
- Reliability: Higher timeframe zones are more reliable due to the involvement of institutional players.
- Flexibility: Supply and demand zones provide a broad range for entries and exits, accommodating varying market conditions.
- Improved Risk-Reward Ratios: Swing trading offers the opportunity to aim for larger profit targets, which often result in favorable risk-reward ratios.
| Aspect | Description |
|---|---|
| Higher Timeframe Zones | Focus on daily and weekly charts for more reliable supply and demand zones. |
| Combining Indicators | Use tools like moving averages, Fibonacci retracements, and RSI to confirm trade setups. |
| Buying from Demand Zone | Enter long positions in demand zones during uptrends with confirmation from bullish patterns. |
| Selling from Supply Zone | Enter short positions in supply zones during downtrends with confirmation from bearish patterns. |
| Advantages for Swing Trading | Reliability, flexibility in entries and exits, and better risk-reward ratios. |
8. Conclusion
The concept of supply and demand zones is a cornerstone of technical analysis, offering traders a reliable framework for understanding market dynamics and identifying high-probability trading opportunities. From identifying key levels of institutional buying and selling to executing strategies across different timeframes, supply and demand zones provide versatility and precision that can significantly enhance trading performance.
Recap of Key Concepts and Strategies
Supply and demand zones are areas on a price chart where significant imbalances between buyers and sellers lead to notable price movements. These zones are more dynamic and flexible than traditional support and resistance levels, making them invaluable for modern traders. Understanding how to identify, draw, and trade these zones enables traders to align their strategies with market psychology and order flow.
The strategies discussed include:
- Zone Trading: Buying at demand zones and selling at supply zones with proper stop-loss and profit target placements.
- Confirmation Techniques: Using price action and volume to validate supply and demand zones.
- Breakout Trading: Capturing momentum by identifying and trading breakouts from established zones.
- Multi-Timeframe Analysis: Combining zones from higher and lower timeframes for better accuracy and entry refinement.
- Swing Trading Strategies: Utilizing higher timeframe zones and additional technical indicators to capture medium-term price movements.
Importance of Practice and Continuous Learning
Mastery of supply and demand zones requires consistent practice and a commitment to learning. Traders should focus on backtesting their strategies using historical data to refine their approach and gain confidence in their methods. Market conditions change over time, and continuous learning ensures that traders stay adaptable and informed.
Encouragement to Develop Personal Strategies
While the strategies outlined in this guide provide a solid foundation, every trader’s journey is unique. Traders are encouraged to adapt these principles to suit their trading style, risk tolerance, and financial goals. By doing so, they can develop personalized strategies that align with their strengths and preferences.
Final Thoughts
Trading is both an art and a science, and supply and demand zones offer a structured yet flexible approach to navigating the complexities of financial markets. By combining these zones with sound risk management and ongoing analysis, traders can achieve consistency and long-term success. The journey to mastering supply and demand trading is one of patience, discipline, and continuous improvement, but the rewards are well worth the effort.