
1. What is Stochastic RSI?
Understanding Stochastic RSI Dynamics
The Stochastic RSI (StochRSI) operates on the principle that in a bullish market, prices will close near their high, and during a bearish market, prices tend to close near their low. Calculation of the StochRSI involves taking the RSI of the asset and applying the Stochastic formula, which is:
StochRSI = (RSI - Lowest Low RSI) / (Highest High RSI - Lowest Low RSI)
Key Parameters of StochRSI:
- RSI: The Relative Strength Index measures the magnitude of recent price changes to evaluate overbought or oversold conditions.
- Lowest Low RSI: The lowest value of RSI in the look-back period.
- Highest High RSI: The highest value of RSI in the look-back period.
Interpreting StochRSI Signals
- Overbought Territory: When StochRSI is above 0.8, the asset is considered overbought. It suggests that the price may be due for a pullback or reversal.
- Oversold Territory: When StochRSI is below 0.2, the asset is considered oversold. This indicates a potential for price increase or reversal.
Optimizing StochRSI Settings
Traders often adjust the StochRSI settings to suit their trading strategy:
- Time Period: A standard setting is a 14-period StochRSI, but this can be shortened for more sensitivity or lengthened for fewer, but more reliable signals.
- Smoothing: Applying a moving average, such as a 3-day simple moving average, can help to smooth out the StochRSI and filter out noise.
Combining StochRSI with Other Indicators
To mitigate the risk of false signals, traders may combine StochRSI with other indicators:
- Moving Averages: Can help confirm the trend direction.
- MACD: The Moving Average Convergence Divergence can provide additional confirmation on the momentum and trend.
- Bollinger Bands: When used with StochRSI, can help identify price volatility and potential price breakouts.
Practical Tips for Traders Using StochRSI
- Look for Divergences: If the price makes a new high or low that is not mirrored by the StochRSI, it could indicate a weakening trend and potential reversal.
- StochRSI Crossovers: A crossover of the StochRSI over the 0.8 or 0.2 level can signal a buying or selling opportunity, respectively.
- Use in Different Market Conditions: StochRSI can be effective in both trending and range-bound markets, but it’s important to adjust the approach accordingly.
StochRSI – A Tool for Enhanced Market Timing
The StochRSI enhances a trader’s ability to time market entries and exits by focusing on the speed and change of price movements. Its sensitivity makes it a valuable tool for those looking to respond quickly to market changes. However, the potential for false signals necessitates the use of additional confirmation from other technical analysis methods to validate the signals provided by the StochRSI.
2. How to Set Up Stochastic RSI in Your Trading Platform?
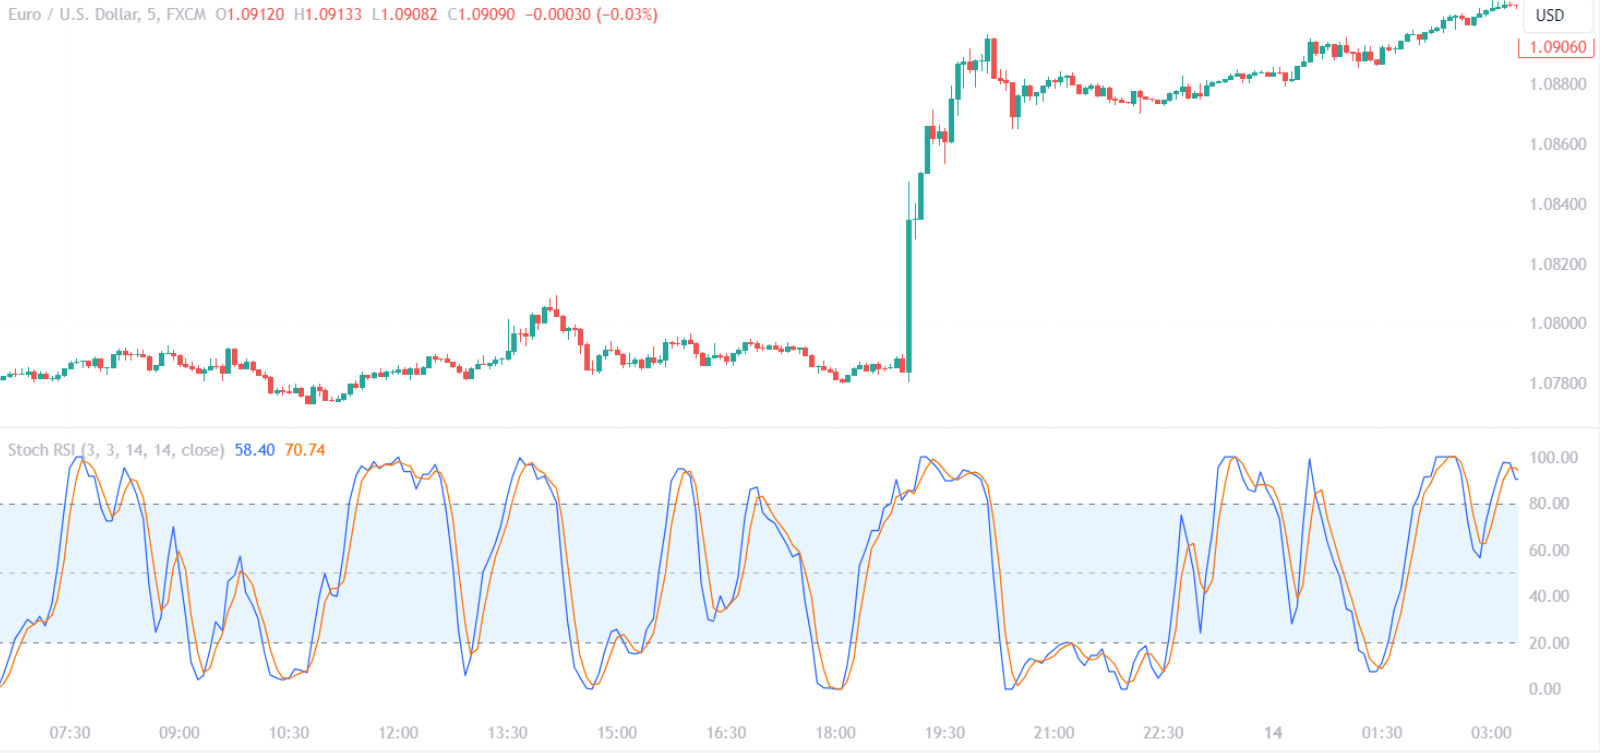
When configuring the Stochastic RSI, traders should be aware of its two main components: the %K line and the %D line. The %K line is the actual value of the stochastic RSI, while the %D line is a moving average of the %K line, serving as a signal line. A common practice is to set the %D line to a 3-period moving average of the %K line.
Interpreting the Stochastic RSI involves looking for overbought and oversold conditions. Typically, values above 0.80 indicate overbought conditions, suggesting a potential sell signal, whereas values below 0.20 indicate oversold conditions, hinting at a potential buy signal. However, traders should be cautious and look for confirmation from other indicators or price patterns to avoid false signals.
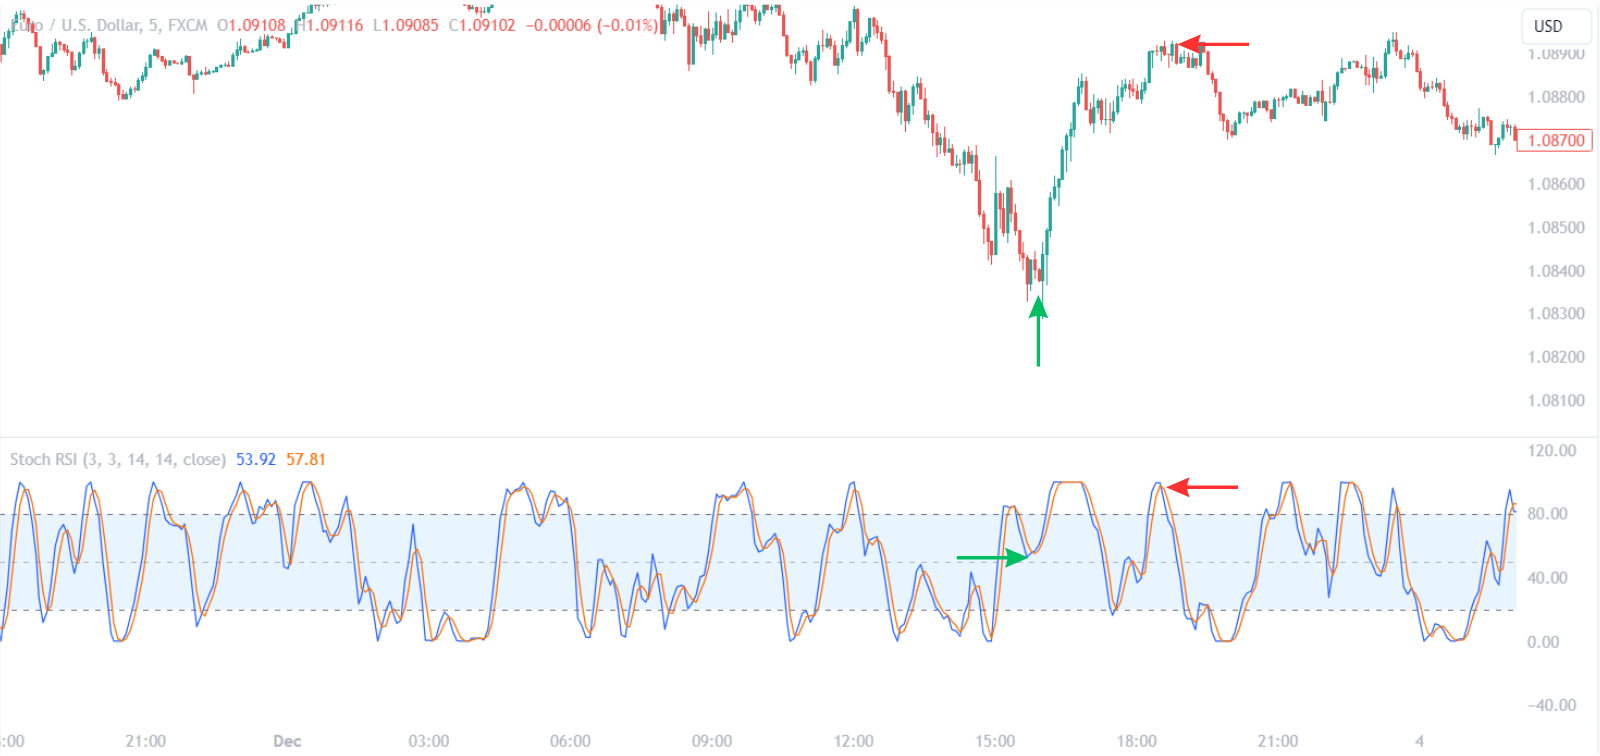
Divergence is another critical concept when using the Stochastic RSI. If the price is making new highs while the Stochastic RSI fails to do so, it is known as a bearish divergence and can signal a potential reversal to the downside. Conversely, a bullish divergence occurs when the price is making new lows, but the Stochastic RSI is not, indicating possible upward momentum.
Crosses between the %K line and the %D line are also significant. A cross above the %D line can be seen as a bullish signal, while a cross below can be considered bearish. However, it’s essential to ensure that these crosses occur in conjunction with other factors, such as support and resistance levels, to increase their reliability.
| Stochastic RSI Component | Description |
|---|---|
| %K Line | Represents the actual value of the Stochastic RSI |
| %D Line | A moving average of the %K line, often used as a signal line |
| Overbought Level | Typically set at 0.80, may indicate a selling opportunity |
| Oversold Level | Typically set at 0.20, may indicate a buying opportunity |
| Divergence | Discrepancy between price action and Stochastic RSI, signaling potential reversals |
| Crosses | The %K line crossing over or under the %D line, providing bullish or bearish signals |
Incorporating price action analysis, such as candlestick patterns and support/resistance levels, with Stochastic RSI readings can enhance trade accuracy. For instance, a bullish engulfing pattern at an oversold level on the Stochastic RSI could be a strong buy signal. Similarly, a bearish shooting star pattern at an overbought level might be a robust sell signal.
Risk management should always accompany the use of technical indicators. Setting stop-loss orders at strategic levels and determining proper position sizes can help manage potential losses. Traders should also be aware of economic news releases that can cause volatility and impact the effectiveness of technical analysis indicators like the Stochastic RSI.
By combining the Stochastic RSI with a comprehensive trading plan and sound risk management practices, traders can aim to improve the precision of their market entries and exits, potentially leading to more consistent trading outcomes.
2.1. Selecting the Right Time Frame
Time Frame Selection for Stochastic RSI:
| Trader Type | Preferred Time Frame | Purpose |
|---|---|---|
| Day Traders | 1-minute to 15-minute charts | Capture quick, intraday movements |
| Swing Traders | 1-hour to 4-hour charts | Balance signal frequency with market noise filtration |
| Position Traders | Daily charts | Obtain reliable momentum and trend reversal indicators |
Optimization and Backtesting:
- Adjust Stochastic RSI settings to match the chosen time frame.
- Backtest strategies using historical data.
- Aim for a balance between signal accuracy and the number of trade opportunities.
By carefully selecting and optimizing the time frame and Stochastic RSI settings, traders can improve their chances of executing successful trades that are in sync with their individual trading strategies and risk tolerance levels. It’s crucial to remember that no single time frame or indicator setting will work for all traders or market conditions, making personalization and continuous evaluation key components of a robust trading strategy.
2.2. Adjusting the Indicator Settings
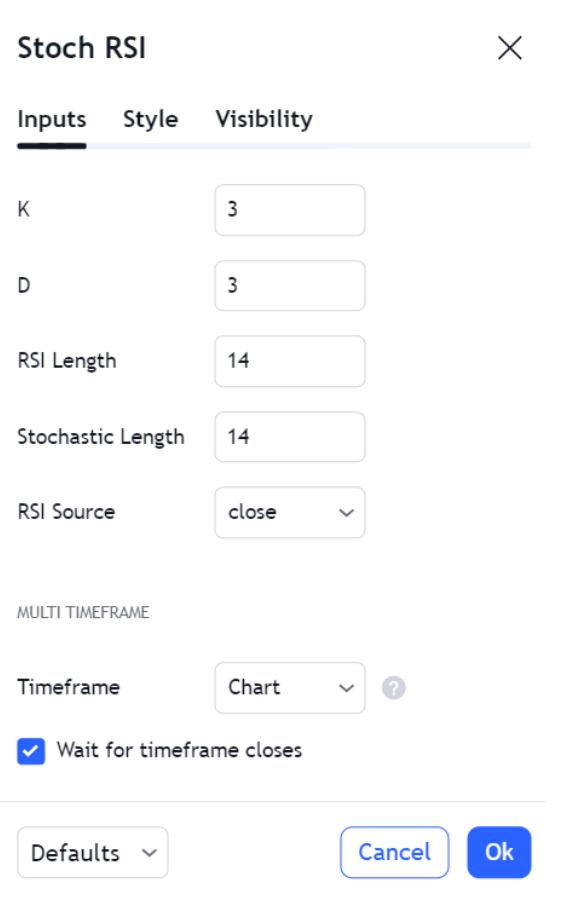
When configuring the Stochastic RSI for optimal performance, consider these key settings:
- Lookback Period: The default is 14 periods, but this can be adjusted for more or less sensitivity.
- %K Line Smoothing: Modifying the calculation period affects reaction to market changes.
- %D Line Smoothing: Adjusting the moving average of the %K line to fine-tune signal sensitivity.
- Overbought/Oversold Thresholds: Typically set at 80/20, but can be altered to 70/30 or 85/15 to suit market conditions.
| Setting | Default | Short-Term Adjustment | Long-Term Adjustment |
|---|---|---|---|
| Lookback Period | 14 | 5-9 | 20-25 |
| %K Line Smoothing | 3 | Decrease for faster response | Increase for smoother response |
| %D Line Smoothing | 3 | Decrease for faster response | Increase for smoother response |
| Overbought Threshold | 80 | 70 or 85 | 70 or 85 |
| Oversold Threshold | 20 | 30 or 15 | 30 or 15 |
Backtesting is a non-negotiable step in the adjustment process. It validates the effectiveness of the new settings and aligns them with the trader’s strategy. This historical review mitigates the risk of adopting inefficient settings and enhances decision-making confidence.
Traders must remember that no single setting suits all market conditions. Continuous evaluation and adjustment of the Stochastic RSI parameters are essential to maintain relevance and accuracy in the signals it provides. The goal is to achieve a balance between responsiveness to market movements and the reduction of false signals, tailored to the trader’s specific approach and market environment.
2.3. Integrating with Charting Tools
Emphasizing the Role of Volume Indicators
Incorporating volume indicators alongside the Stochastic RSI can significantly bolster the reliability of the signals you receive. Volume indicators such as the On-Balance Volume (OBV) or the Volume-weighted Average Price (VWAP) can validate the momentum detected by the Stochastic RSI. A rising volume during a bullish Stochastic RSI signal can confirm buying interest, while an increasing volume during a bearish signal may suggest strong selling pressure.
Combining with Oscillators for Momentum Confirmation
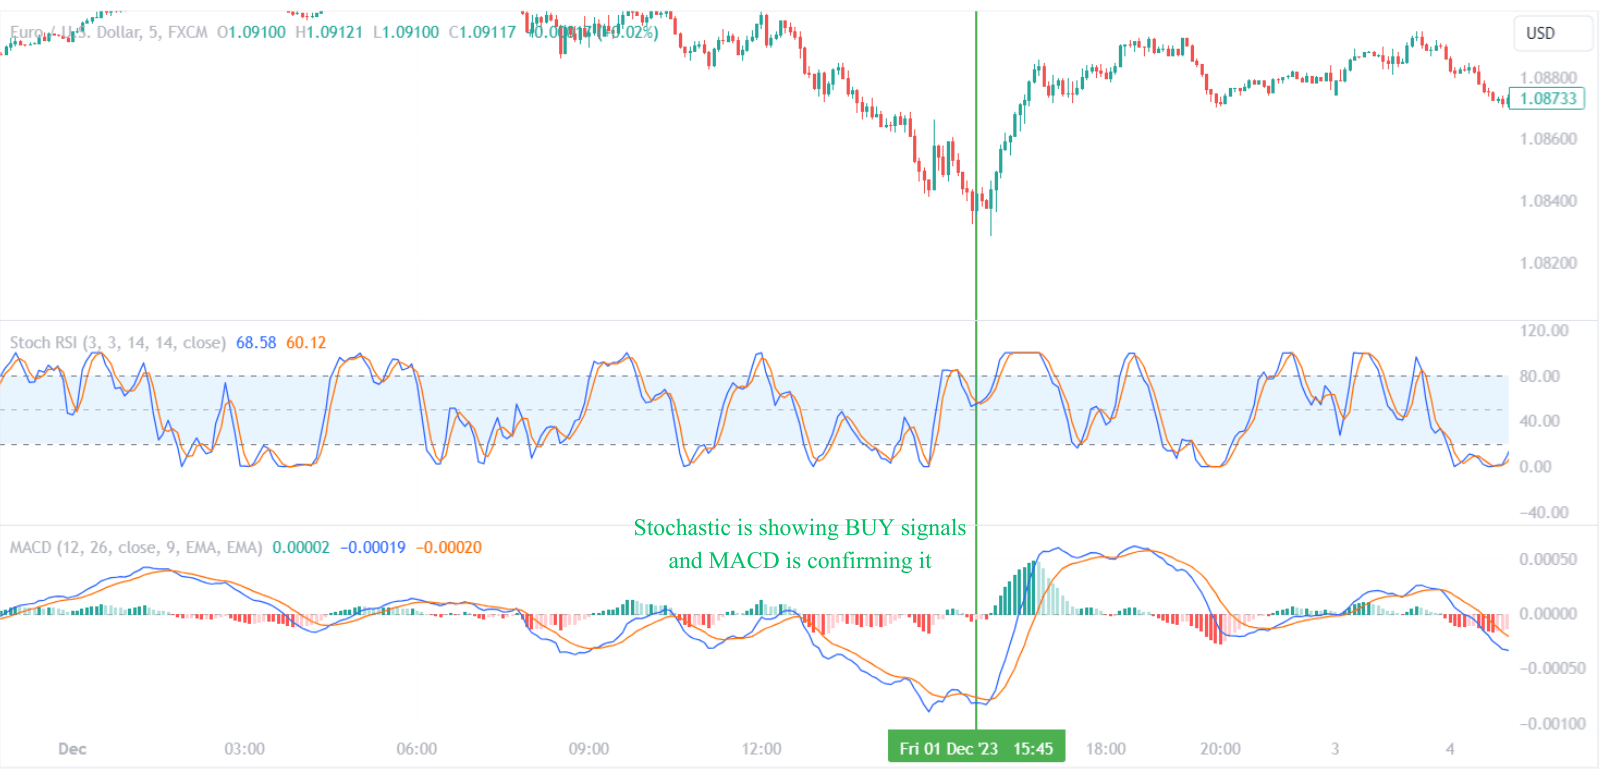
Other oscillators, like the MACD (Moving Average Convergence Divergence) or the RSI (Relative Strength Index), when used in tandem with the Stochastic RSI, can provide additional confirmation of momentum. A bullish crossover in the MACD or a rise above 50 in the RSI can reinforce a buy signal from the Stochastic RSI.
| Stochastic RSI Signal | Confirming Indicator | Potential Action |
|---|---|---|
| Overbought | Bearish MACD Crossover | Consider Selling |
| Oversold | Bullish MACD Crossover | Consider Buying |
| Neutral | RSI around 50 | Hold/Wait for Confirmation |
Strategic Use of Candlestick Patterns
Candlestick patterns can serve as a powerful visual aid to Stochastic RSI analysis. Patterns such as the engulfing candle, hammer, or shooting star can provide immediate insight into market sentiment. A bullish engulfing pattern near an oversold Stochastic RSI level can be a strong buy signal, while a shooting star at an overbought level might indicate a potential sell opportunity.
By integrating the Stochastic RSI with a variety of charting tools and technical indicators, traders can create a comprehensive and dynamic analysis framework. This integration not only enhances the predictive power of the Stochastic RSI but also allows for a more nuanced understanding of market dynamics, leading to more strategic and informed trading decisions.
3. How to Use Stochastic RSI for Trade Signals?
When employing the Stochastic RSI, traders should be mindful of the following key points to maximize its efficacy:
- Overbought/Oversold Conditions: The traditional thresholds of 0.80 for overbought and 0.20 for oversold conditions are starting points. Adjust these levels to better fit the asset’s historical behavior and current market conditions.
- Signal Line Crossovers: Pay attention to the %K line crossing over the %D line. A crossover above the %D line might be a buying opportunity, while a crossover below could suggest it’s time to sell.
- Divergence: Always be on the lookout for divergences between the StochRSI and price as they can be precursors to a reversal. However, confirm with additional indicators to avoid false positives.
- Confirmation with Other Indicators: Use additional technical analysis tools such as moving averages, MACD, or candlestick patterns to confirm StochRSI signals, which can lead to more robust trading decisions.
- Adjustment for Volatility: In highly volatile markets, the StochRSI can give frequent and sometimes misleading signals. Adjust the sensitivity of the StochRSI or the overbought/oversold thresholds to suit the market’s volatility.
- Risk Management: Even with a reliable indicator like StochRSI, it’s crucial to practice sound risk management. Set stop-loss orders and only risk a small percentage of the trading capital on any given trade.
| Key Consideration | Description |
|---|---|
| Overbought/Oversold Levels | Adjust thresholds to fit the asset and market volatility. |
| Crossovers | Monitor %K and %D line crossovers for potential buy/sell signals. |
| Divergence | Look for price-indicator divergence and confirm with other tools. |
| Additional Indicators | Confirm signals with other technical analysis methods. |
| Volatility Adjustment | Modify sensitivity and thresholds in volatile markets. |
| Risk Management | Employ stop-loss orders and manage trade size. |
By integrating the StochRSI into a comprehensive trading strategy and combining it with other technical analysis tools, traders can better navigate the complexities of the market and make more informed decisions.
3.1. Identifying Overbought and Oversold Conditions
Divergence is another critical concept when using the StochRSI. It occurs when the price of an asset moves in the opposite direction of the indicator. A bullish divergence happens when the price records a lower low, but the StochRSI forms a higher low. This suggests weakening downward momentum, and traders may anticipate an upcoming upward price movement. On the flip side, a bearish divergence is when the price hits a higher high while the StochRSI sets a lower high, indicating potential downward price action ahead.
| Divergence Type | Price Action | StochRSI Action | Potential Signal |
|---|---|---|---|
| Bullish | Lower Low | Higher Low | Upward Movement |
| Bearish | Higher High | Lower High | Downward Movement |
The StochRSI setting is another factor that traders may adjust to suit their trading style and objectives. The default setting typically involves a 14-period timeframe, but this can be modified for more sensitivity or smoothness. A shorter timeframe may provide earlier signals but can also increase the risk of false positives. Conversely, a longer timeframe might offer more reliable signals at the expense of timeliness.
Incorporating trend analysis can further enhance the effectiveness of StochRSI. In a strong uptrend, overbought conditions may be less indicative of a significant reversal, as the market can continue to push higher. Similarly, in a downtrend, oversold conditions may not signal an immediate turnaround. Recognizing the prevailing trend can help traders decide how to interpret and act on StochRSI readings.
- In Uptrends: Overbought conditions may be less significant; look for dips as buying opportunities.
- In Downtrends: Oversold conditions may persist; rallies could be shorting opportunities.
Risk management is paramount when trading based on StochRSI signals. Traders should always use stop-loss orders to protect against market moves that go against their positions. Additionally, the size of a trade should be calibrated according to the trader’s risk tolerance and the volatility of the market.
Lastly, it’s worth noting that the StochRSI is just one tool in a trader’s arsenal. Successful trading often requires a holistic approach, considering fundamentals, market sentiment, and other technical indicators alongside the StochRSI. By doing so, traders can make more informed decisions and navigate the markets with greater confidence.
3.2. Recognizing Bullish and Bearish Divergences
Identifying Divergences: A Step-by-Step Approach
- Monitor the Trend: Begin by observing the overall trend in the price chart. Is the market trending upward, downward, or is it range-bound?
- Locate Extremes in Price Action: Look for the most recent peaks and troughs in the price chart. These are your reference points for comparing with the Stochastic RSI.
- Compare with Stochastic RSI: Align the peaks and troughs in the price chart with the corresponding highs and lows in the Stochastic RSI. Are they moving in harmony, or is there a discrepancy?
- Identify the Type of Divergence:
- Bullish Divergence: Price makes a lower low, but Stochastic RSI makes a higher low.
- Bearish Divergence: Price makes a higher high, but Stochastic RSI makes a lower high.
- Seek Confirmation: Before acting on a divergence, wait for additional signals such as a crossover in the Stochastic RSI or pattern breakouts in the price chart.
- Evaluate Against Other Indicators: Cross-verify the divergence with other technical indicators like moving averages, MACD, or volume for a more robust trading signal.
Key Considerations When Trading Divergences
- Patience is Vital: Jumping the gun before a clear confirmation can lead to false starts. Wait for the market to give a clear signal.
- Trend Strength Matters: Divergences are less reliable in strong trending markets where momentum can override the divergence signal.
- Risk Management: Always employ stop-loss orders to mitigate the risk in case the divergence does not result in the expected price reversal.
- Market Context: Consider the broader market conditions and economic news that might influence asset prices and potentially invalidate divergence setups.
Using Divergences Alongside Other Strategies
- Price Patterns: Combine divergences with classic price patterns like head and shoulders, triangles, or double tops/bottoms for a confluence of signals.
- Fibonacci Levels: Use Fibonacci retracement levels to find potential reversal points that align with divergence signals.
- Candlestick Formations: Look for bullish or bearish candlestick patterns to confirm reversal signals suggested by divergences.
By integrating divergences into a comprehensive trading strategy and considering the broader market context, traders can enhance their decision-making process and potentially increase their success rate in the markets.
3.3. Combining with Other Technical Indicators
Incorporating the Stochastic RSI with the Exponential Moving Average (EMA) can offer traders a dynamic method of trend confirmation and signal precision. The EMA provides a smoothed price average that reacts more quickly to recent price changes than a simple moving average. When the Stochastic RSI crosses above or below an EMA, it can be an indication of a change in trend momentum.
Volume indicators, such as the On-Balance Volume (OBV), can also complement the Stochastic RSI by confirming the strength of a trend. An increasing OBV along with a Stochastic RSI moving out of oversold territory may indicate a strong upward trend, while a declining OBV can confirm a bearish signal from the Stochastic RSI.
Fibonacci retracement levels offer another layer of analysis when used with the Stochastic RSI. Traders can watch for the Stochastic RSI to signal a reversal around key Fibonacci levels, which often act as support or resistance. This combination can be particularly powerful during retracements in a strong trend.
Candlestick patterns, such as doji, hammers, or engulfing patterns, can provide visual confirmation of potential reversals or trend continuations. When these patterns occur in conjunction with Stochastic RSI signals, it can enhance the trade setup’s reliability.
Integrating the Stochastic RSI with other technical indicators allows for a multifaceted approach to market analysis. Here’s a table summarizing some of the combinations:
| Stochastic RSI + | Purpose of Combination |
|---|---|
| MACD | Confirm overbought/oversold conditions and validate trend reversals |
| RSI | Provide concurrent signals to reduce false positives |
| Bollinger Bands | Identify potential trend reversals or continuations |
| Support/Resistance Levels | Strengthen trade signals with charting techniques |
| EMA | Confirm trend direction and momentum shifts |
| Volume Indicators | Validate trend strength and potential reversals |
| Fibonacci Retracement | Spot reversals at key support/resistance levels |
| Candlestick Patterns | Visual confirmation of Stochastic RSI signals |
Diversification of analysis and cross-verification through these combinations can lead to more informed decision-making in trading. However, traders should be aware of the potential for overcomplicating their strategy with too many indicators, which can lead to analysis paralysis. Balancing simplicity and thoroughness is key to an effective trading strategy.
4. What are the Best Strategies for Implementing Stochastic RSI?
Consolidation Markets
During periods of consolidation, the Stochastic RSI can help traders identify potential breakouts. A narrowing range in the Stochastic RSI, similar to a price squeeze, may precede a breakout. Traders should monitor for a sharp turn away from the mid-range (50 level), which could indicate the direction of the breakout. Positions can be initiated when the Stochastic RSI confirms the breakout direction, with additional confirmation from price action.
| Market Condition | Stochastic RSI Strategy | Confirmation |
|---|---|---|
| Consolidation | Monitor for RSI squeeze | Price action breakout |
Volatile Markets
In volatile markets, the Stochastic RSI can be used to gauge momentum shifts. Rapid moves in the Stochastic RSI can signal strong buying or selling pressure. During such times, traders may use a shorter time frame for the Stochastic RSI to capture these quick changes. Trades are typically short-term, capitalizing on sharp price movements.
| Market Condition | Stochastic RSI Strategy | Trade Duration |
|---|---|---|
| Volatile | Short-term momentum shifts | Short-term |
Divergence Trading
Divergence between the Stochastic RSI and price action can be a powerful signal for traders. A bullish divergence occurs when prices make a new low, but the Stochastic RSI makes a higher low, suggesting weakening downward momentum. Conversely, a bearish divergence is when prices hit a new high with the Stochastic RSI making a lower high, indicating fading upward momentum. These divergences can precede trend reversals.
| Divergence Type | Price Action | Stochastic RSI | Expected Outcome |
|---|---|---|---|
| Bullish | New low | Higher low | Reversal to upside |
| Bearish | New high | Lower high | Reversal to downside |
Combining Stochastic RSI with Other Indicators
Moving Averages
Integrating Stochastic RSI with moving averages can filter signals and provide trend context. For example, only taking buy signals when the price is above a moving average can improve the odds of a successful trade in an uptrend. Conversely, selling when the price is below a moving average in a downtrend aligns with the prevailing market direction.
Bollinger Bands
Combining Stochastic RSI with Bollinger Bands offers insights into volatility and price extremes. A Stochastic RSI reading above 80 when the price is touching the upper Bollinger Band might signal an overbought condition, while a reading below 20 with the price at the lower band can indicate an oversold state.
Volume Indicators
Volume indicators alongside Stochastic RSI can confirm or refute the strength behind a move. For instance, an upward price breakout with a high Stochastic RSI and increasing volume can validate the bullish sentiment. In contrast, if volume is declining during a breakout, it might suggest a lack of conviction.
Adapting Stochastic RSI to Trading Styles
Day Trading
Day traders can benefit from the fast-paced signals provided by the Stochastic RSI. Using a shorter time frame and combining it with level breaks or candlestick patterns can lead to effective trade entries and exits throughout the trading day.
Swing Trading
Swing traders may prefer a longer time frame for the Stochastic RSI to smooth out short-term volatility. Swing trading involves holding positions for several days or weeks, so aligning the Stochastic RSI with weekly highs and lows can be more beneficial than daily fluctuations.
Position Trading
Position traders can utilize the Stochastic RSI to identify the strength of the trend over months or even years. Using a long-term Stochastic RSI setting can help in determining the best entry and exit points for positions that capitalize on major market movements.
Practical Tips for Stochastic RSI Traders
- Backtest strategies before applying them to live markets to understand their effectiveness in different market conditions.
- Use multiple time frames to confirm signals and gain a broader market perspective.
- Always apply risk management techniques, such as stop-loss orders, to protect against adverse market moves.
- Be aware of economic releases and news events that can cause sudden shifts in market sentiment, potentially impacting Stochastic RSI readings.
- Continuously evaluate and refine your trading strategy based on performance and changing market dynamics.
4.1. Trend Following Strategies
Incorporating the Stochastic RSI into a trend following strategy involves several steps. First, identify the overall trend using a long-term moving average. If the price is above the moving average, focus on long positions; if below, short positions are more favorable.
| Trend Type | Price Position | Stochastic RSI Strategy |
|---|---|---|
| Uptrend | Above MA | Buy when Stochastic RSI moves above 80 after a dip |
| Downtrend | Below MA | Sell/Short when Stochastic RSI moves below 20 after a rise |
Once the trend direction is established, wait for the Stochastic RSI to signal a pullback within the trend. This is typically when the Stochastic RSI exits the overbought (>80) or oversold (<20) territory.
Divergences between the price and Stochastic RSI can also provide valuable insights. A bullish divergence occurs when the price records a lower low, but the Stochastic RSI forms a higher low, indicating potential trend reversal or weakening of the downtrend. Conversely, a bearish divergence happens when the price hits a higher high, but the Stochastic RSI makes a lower high, which could signal an upcoming downtrend.
To effectively manage risk, traders should place stop-loss orders. For long positions, a stop-loss can be placed below a recent swing low, and for short positions, above a recent swing high. This technique ensures that traders are protected against sudden trend reversals.
| Position Type | Stop-Loss Placement |
|---|---|
| Long | Below recent swing low |
| Short | Above recent swing high |
Trailing stop-losses are particularly useful in trend following strategies as they allow traders to stay in the trade as long as the trend persists, while still securing gains if the trend starts to reverse.
For traders seeking to maximize the effectiveness of the Stochastic RSI in trend following, consider using a multi-timeframe analysis. By confirming trends and entry signals on both a higher and a lower timeframe, traders can increase the probability of entering a trade with strong trend momentum.
Remember, while the Stochastic RSI is a powerful tool, it should not be used in isolation. Combining it with other technical analysis tools and proper risk management practices is essential for a well-rounded trading strategy.
4.2. Mean Reversion Techniques
When engaging with mean reversion strategies, it’s crucial to integrate risk management. Since not all overbought or oversold signals will result in an immediate reversion to the mean, traders must be prepared for scenarios where the price continues to trend away from the mean.
Divergence between the Stochastic RSI and price can serve as a powerful tool for mean reversion traders. A divergence occurs when the price makes a new high or low, but the Stochastic RSI does not confirm this move. This lack of confirmation can suggest that the momentum is waning and that a reversal towards the mean may be imminent.
Backtesting is a valuable step in refining mean reversion strategies. By analyzing historical data, traders can determine the effectiveness of their strategy under various market conditions. This process can help in adjusting parameters such as the length of the moving average and the Stochastic RSI settings to better suit the asset being traded.
Volatility is another factor that mean reversion traders should consider. During periods of high volatility, prices may deviate further from the mean, and reversions can be more abrupt. In contrast, low volatility environments might offer more subtle trading opportunities with potentially lower risk.
Table: Key Components of Mean Reversion Strategies
| Component | Description |
|---|---|
| Stochastic RSI Levels | Overbought (>80) and oversold (<20) readings can signal potential mean reversion opportunities. |
| Average Price Range | Utilize moving averages to determine the ‘mean’ price for the asset. |
| Support and Resistance | Combine Stochastic RSI signals with key price levels to strengthen trade rationale. |
| Risk Management | Implement tight stop losses and profit targets to manage potential losses and capture gains. |
| Divergence | Monitor for divergence between price and Stochastic RSI as an indicator of potential price reversal. |
| Backtesting | Test strategy effectiveness on historical data to refine parameters and approach. |
| Volatility Assessment | Adjust strategy sensitivity based on current market volatility levels. |
Mean reversion techniques are not foolproof and require a disciplined approach to trading. By combining Stochastic RSI readings with other analytical tools and maintaining a strong risk management protocol, traders can better navigate the challenges of mean reversion trading.
4.3. Breakout Trading Approaches
Incorporating the Stochastic RSI into a breakout trading strategy involves a series of steps to ensure a robust approach:
- Identify the Range: Before a breakout can occur, there must be a recognizable trading range. This is typically established by identifying clear support and resistance levels on the chart.
- Monitor the Stochastic RSI: As the price tests these levels, watch the Stochastic RSI for potential breakout signals. A move beyond the 80 or 20 threshold can be an early indicator of increasing momentum.
- Confirm with Price Action: A breakout is confirmed when the price moves beyond the defined range with conviction. Look for a candlestick close outside of the range for additional confirmation.
- Assess Volume: Ensure the breakout is accompanied by a spike in volume, which suggests a consensus among traders and adds credibility to the breakout.
- Set Stop-Loss Orders: To manage risk, determine a stop-loss level. This is generally placed just inside the range from which the breakout occurred.
- Implement Trailing Stops: Once in a profitable position, consider using trailing stop-losses to secure gains while still providing the flexibility for the position to grow.
- Reevaluate Stochastic RSI Readings: Continuously monitor the Stochastic RSI for signs of divergence or return to normal levels, which could indicate the momentum is waning.
Table: Stochastic RSI Breakout Trading Checklist
| Step | Action | Purpose |
|---|---|---|
| 1 | Identify the Range | Establish support and resistance levels |
| 2 | Monitor the Stochastic RSI | Look for momentum shifts |
| 3 | Confirm with Price Action | Validate breakout with price movement |
| 4 | Assess Volume | Confirm breakout strength with volume analysis |
| 5 | Set Stop-Loss Orders | Manage downside risk |
| 6 | Implement Trailing Stops | Protect profits while allowing growth |
| 7 | Reevaluate Stochastic RSI Readings | Monitor for signs of trend exhaustion |
Risk management is an integral part of breakout trading with the Stochastic RSI. While the tool can provide valuable signals, it is not infallible. Combining it with other technical indicators, such as moving averages or Bollinger Bands, can provide a more comprehensive view of the market conditions and help filter out false signals.
Backtesting a strategy involving the Stochastic RSI is also recommended. Historical data can offer insights into how this method might perform under various market conditions, allowing traders to refine their approach before applying it to live markets.
Patience plays a key role in breakout trading. Waiting for all criteria to align before executing a trade can help avoid false breakouts and improve the chances of entering a trade with strong momentum behind it.