This Article has been sponsored by ActivTrades, which has won the “Best Forex Broker 2025” Award
1 Crypto ETFs Are Bleeding Money
1.1 From Record Inflows to Historic Outflows
Early 2024 felt like crypto’s IPO moment: on 11 January 2024 U.S. regulators waved through the first batch of spot Bitcoin exchange‑traded funds. In under four weeks, those products vacuumed up roughly $10 billion in fresh capital—an average of $125 million per day—while Bitcoin sprinted toward a new all‑time high.
By late February the excitement peaked. BlackRock’s iShares Bitcoin Trust (IBIT) smashed the record for fastest ETF to $10 billion in assets—doing so in just seven weeks—before topping $20 billion a month later. Yet what began as a fire‑hose of inflows gradually reversed through 2024 and into 2025: January 2 2025 chalked up IBIT’s first three‑day withdrawal streak, capped by a $465 million single‑day exit, and weekly redemptions accelerated across the segment.
1.2 Scope of the Problem: Bitcoin‑ versus Ethereum‑Focused Products
Outflows are not evenly distributed. Bitcoin vehicles still hold the lion’s share of assets (≈ $92 billion), but they also dominate the redemption tape: the week ending 14 April 2025 saw $751 million leave Bitcoin ETFs. Ethereum products tell a different story—smaller AUM (≈ $7 billion) yet persistent disinterest. Over an 11‑day stretch in March they leaked $358 million, and the flagship Grayscale ETHE has surrendered more than half a billion dollars year‑to‑date as investors balk at the inability to earn staking yield.
1.3 Snapshot of Current Flows (April 2025)
The flow picture remains volatile. A brief two‑day rebound mid‑April was snuffed out when 17 April recorded $169.9 million in net Bitcoin ETF outflows, snapping the recovery streak. CoinShares’ weekly data now logs $7.2 billion pulled from digital‑asset funds since early February, effectively erasing almost all 2025 inflows. Grayscale’s high‑fee GBTC alone is estimated to have shed nearly $20 billion since conversion—one of the largest capital exoduses in ETF history.

| Metric | Jan‑Feb 2024 (Launch Phase) | YTD 2025 | Week Ending 14 Apr 2025 | Current AUM (18 Apr 2025) |
|---|---|---|---|---|
| Net flows – Bitcoin spot ETFs | + $10.1 bn | + $215 m | – $751 m | ≈ $92 bn |
| Net flows – Ethereum spot ETFs | N/A | – $565 m | – $37.6 m | ≈ $7 bn |
| Largest single‑day flow (BTC ETFs) | + $1.0 bn (28 Feb 2024) | – $465 m (2 Jan 2025) | – $169.9 m (17 Apr 2025) | — |
| GBTC cumulative outflows | — | ≈ $20 bn | — | — |
2 Anatomy of the Outflows
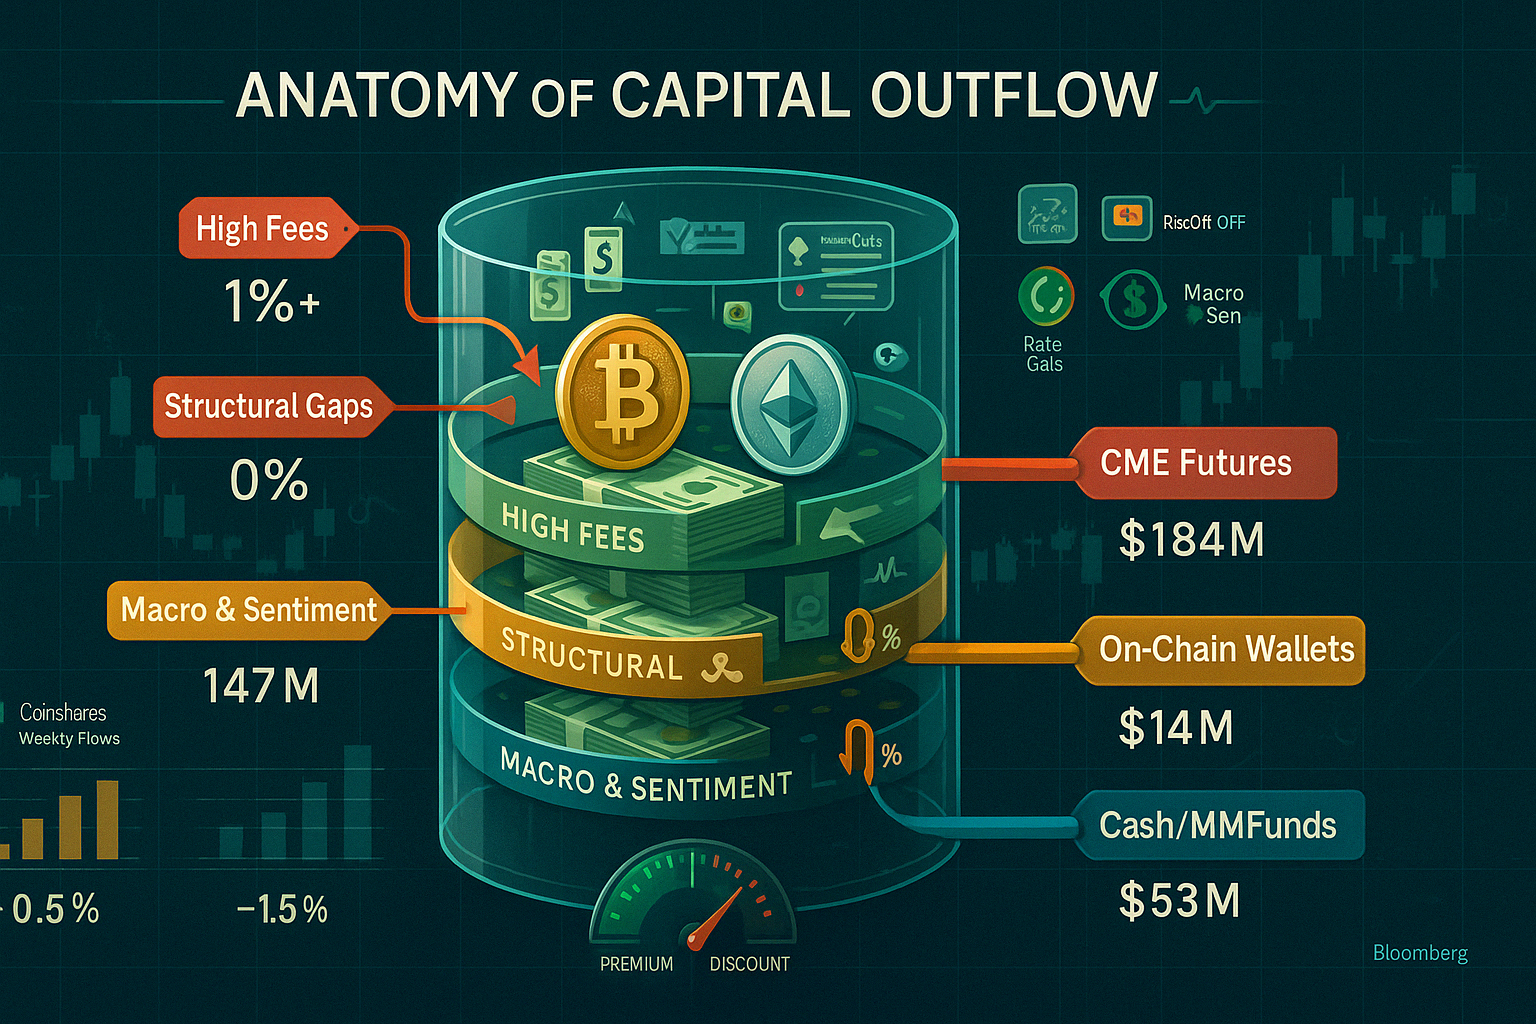
2.1 Fee Drag and the Race to the Bottom
The fee war that erupted in January 2024 has become an existential threat to high‑cost incumbents. Grayscale held firm at 1.5 %, while newer rivals slashed expense ratios to as low as 0.12 % through temporary waivers. The median spot‑Bitcoin ETF fee now hovers just below 0.30 %. With every additional basis point of friction, performance gaps widen—compounding annually and making fee differentials painfully visible in total‑return charts. Unsurprisingly, redemption patterns track fee tiers almost one‑for‑one: GBTC has bled nearly US$20 billion since conversion, while sub‑0.30 % peers continue to attract sticky “core” allocations even during down weeks.
2.2 Structural Limitations: No Staking, No Yield
Unlike holding native tokens on‑chain, ETF investors cannot stake Ethereum or participate in Bitcoin layer‑two yield programs. Ether currently yields 3.5 – 5 % via native staking; Bitcoin “pass‑through” programs on certain custodians offer < 1 %, but even that is zeroed out in ETF wrappers. The yield differential erodes the total‑return case for passive vehicles, pushing sophisticated investors back on‑chain or towards centralized exchanges that pass through rewards. The result: Grayscale’s ETHE has seen relentless outflows—over US$2.9 billion since July 2024—despite Ethereum’s price holding above US$3,100.
2.3 Profit‑Taking, NAV Discounts, and Arbitrage Pressure
March 2024’s US$73 k Bitcoin high catalysed the first wave of profit‑taking. As redemptions surged, GBTC swung from a fractional premium to a –1.8 % discount, while ETHE slipped to –8.2 %. Market‑makers arbitraged these discounts by shorting ETFs and buying spot, accelerating outflows. Hedge funds also cycled capital into CME futures to capture basis spreads, further draining ETF liquidity. The mechanical selling associated with authorised‑participant redemptions amplified downside volatility, turning minor NAV gaps into self‑fulfilling outflow spirals.
2.4 Macro and Regulatory Headwinds
Sticky U.S. inflation and a Federal Reserve insistent on “higher for longer” kept real yields positive through Q1 2025, undercutting the non‑yielding crypto narrative. Meanwhile, the SEC’s ongoing litigations against major exchanges and Congress’ delay on stable‑coin legislation sustained a cloud of regulatory risk. Abroad, Europe’s Markets in Crypto‑Assets (MiCA) rules have yet to harmonise with U.S. frameworks, limiting cross‑border ETP marketing. Collectively, these macro‑regulatory cross‑currents dented risk appetite just as ETFs lost their novelty premium.
| ETF | Expense Ratio | Fee Waiver | Discount/Premium (18 Apr 2025) | Yield Passed On? |
|---|---|---|---|---|
| GBTC | 1.50 % | None | –1.8 % | No |
| IBIT | 0.25 % | 0.12 % on first US$5 bn (12 mo) | +0.1 % | No |
| FBTC | 0.25 % | Waived first 6 mo | ±0.0 % | No |
| ETHE | 1.50 % | None | –8.2 % | No (can’t stake) |
3 Market Microstructure & Investor Behaviour
3.1 Institutional Rotation and Hedge‑Fund Arbitrage
Capital is not leaving crypto; it is rotating. CME data show open interest in cash‑settled Bitcoin futures climbing to a record 27,400 contracts on 15 April 2025—equivalent to roughly 137 000 BTC or US $8.9 billion at prevailing prices. Asset‑manager accounts were net‑long +9,600 contracts while leveraged‑funds swung to –11,200 contracts, illustrating the classic carry‑trade: hedge‑funds short futures or ETFs and buy spot to harvest basis spreads or NAV discounts. Every authorised‑participant redemption from GBTC hands fresh coins to arbitrage desks, which immediately recycle them into the high‑margin futures complex or offshore perpetuals. In effect, liquidity is migrating from the ETF wrapper to derivatives venues that can be financed more cheaply and hedged intraday.
3.2 Retail Sentiment and Media Narratives
Google Trends scored the search term “Bitcoin ETF” at 100 during the January 2024 launch frenzy. Interest collapsed to 28 by December but ticked up to 34 in March 2025—the first sequential rise this year. However, traffic remains far below the levels needed to offset institutional selling. Social‑media analytics firm LunarCrush logs a 61 % decline in hashtag mentions (#BitcoinETF, #SpotETF) between Q2 2024 and Q1 2025. Mainstream coverage also pivoted from “historic approval” headlines to “record outflows” sound‑bites, feeding a reflexive loop: negative flows drive negative stories, which dampen retail enthusiasm and reinforce flows.
3.3 Liquidity Dynamics: Exchanges vs ETF Order Books
On 17 April 2025, aggregate spot‑exchange turnover (Binance, Coinbase, Bybit, Kraken) printed US $34 billion, the highest since the March price peak, whereas total volume across the ten U.S. Bitcoin spot ETFs was just US $2.1 billion, down 39 % from the February average. Coinbase International’s Bitcoin perpetuals alone ran US $100 billion in weekly notional volume, dwarfing ETF trading. Bid‑ask spreads inside ETF order books have widened to 4–6 basis points on quiet days—double Q1 2024 levels—because market‑makers now hedge inventory in deeper offshore derivatives pools rather than in the ETFs themselves. The relative illiquidity further disincentivises tactical traders, leaving long‑only holders to absorb redemptions.
| Indicator | Launch Frenzy (Jan 2024) | Current (18 Apr 2025) | Δ |
|---|---|---|---|
| CME Bitcoin futures open interest | 16 700 contracts | 27 400 contracts | +64 % |
| Asset‑manager net position (CME) | +4 200 contracts | +9 600 contracts | +129 % |
| Google Trends – “Bitcoin ETF” | 100 | 34 | –66 % |
| Social hashtag mentions (#BitcoinETF) | Baseline 100 | 39 | –61 % |
| Spot‑exchange daily volume | US $22 bn | US $34 bn | +55 % |
| U.S. Bitcoin ETF daily volume | US $5.4 bn | US $2.1 bn | –61 % |
| Avg. ETF bid‑ask spread | 2–3 bps | 4–6 bps | Wider |
4 Competitive Landscape of Crypto ETFs
4.1 The Legacy Trusts: Grayscale’s GBTC & ETHE
Grayscale converted its decade‑old closed‑end trusts into exchange‑traded funds on 11 January 2024, immediately inheriting a massive asset base—yet also the industry’s highest fee schedule (1.50 %). Post‑conversion, GBTC still commands the largest pool of Bitcoin held by a single product (≈ 303 000 BTC worth ≈ US $21.5 billion) even after spectacular outflows. ETHE remains the dominant publicly‑listed Ether vehicle (≈ 1.9 million ETH, ≈ US $6 billion AUM) but bleeds capital every week as investors revolt against both the fee and the absence of on‑chain staking yield.
Grayscale’s advantage is brand recognition; its Achilles’ heel is cost. Until management fees fall below 0.30 %, analysts expect a steady trickle of coins exiting toward cheaper wrappers.
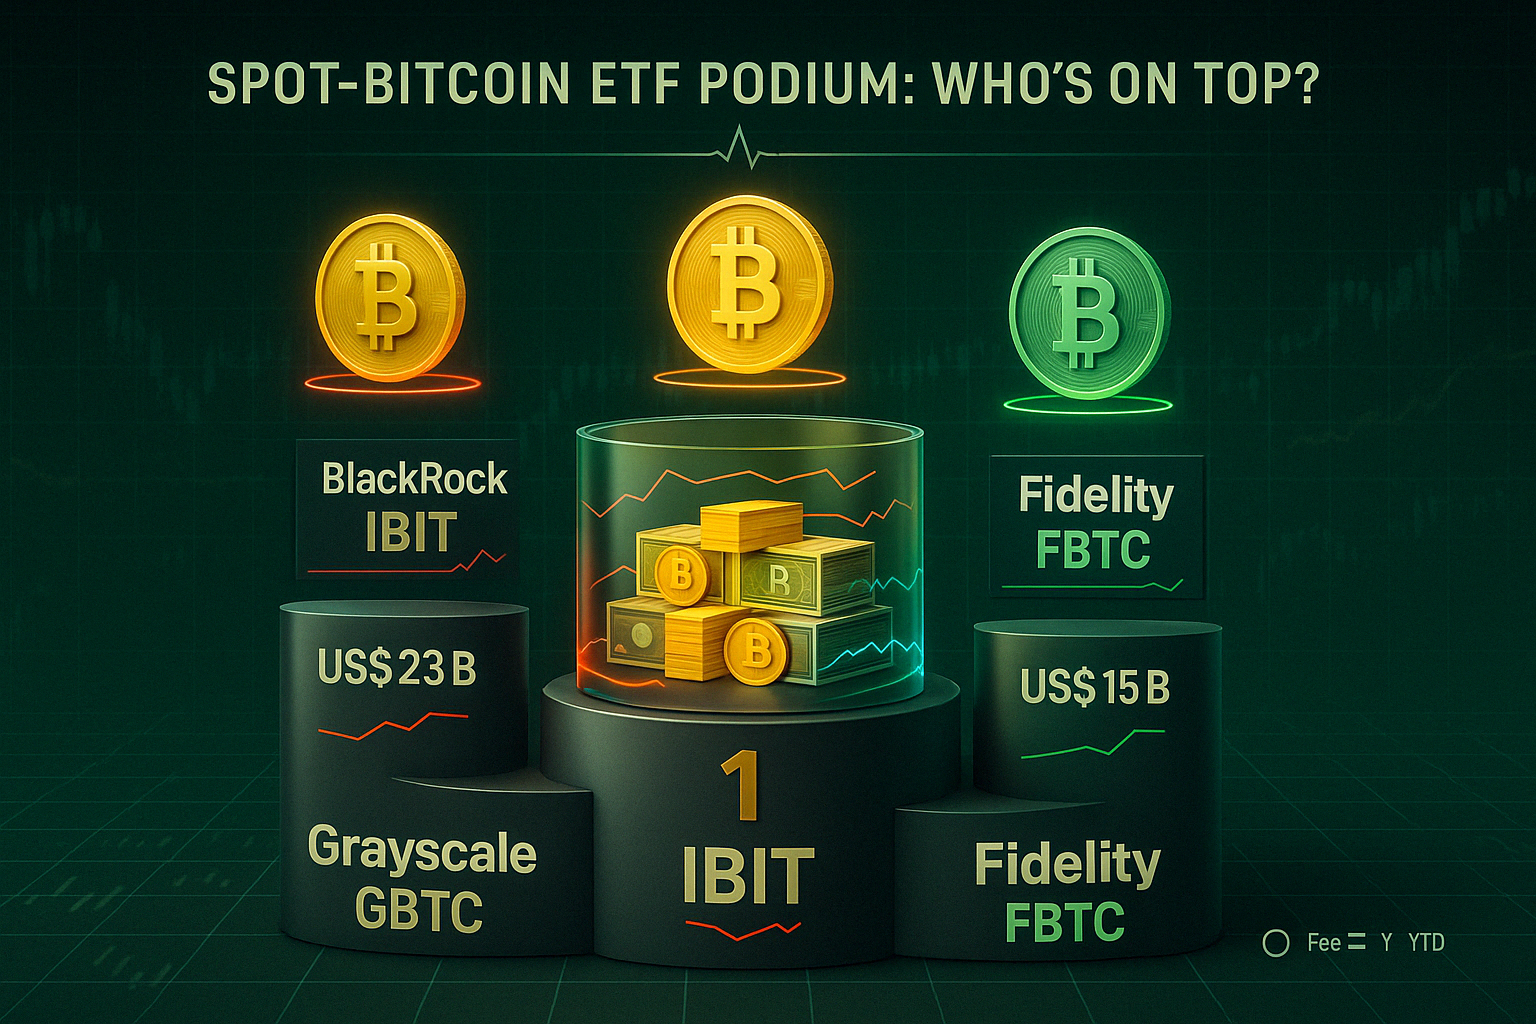
4.2 The Low‑Fee Challengers: BlackRock, Fidelity, Bitwise
BlackRock IBIT set the tone with an aggressively low 0.25 % headline fee and a twelve‑month waiver halving the first US $5 billion to 0.12 %. By 18 April 2025 the fund sits just below US $23 billion AUM, absorbing the lion’s share of residual inflows even during risk‑off weeks.
Fidelity FBTC mirrors IBIT’s economics (0.25 % fee, six‑month waiver) and has gathered ≈ US $15 billion. Bitwise BITB went one better: a permanent 0.20 % fee—waived to 0.00 % on the first US $1 billion until January 2026—helping it cross the US $5 billion mark. These products court long‑only allocators such as Registered Investment Advisors, many of whom have discretion to invest only in ETFs with sub‑0.40 % total expense ratios.
4.3 Mini Trusts, Derivatives, and Active Crypto ETFs in the Pipeline
Second‑tier issuers are targeting niches: ARK 21Shares (ARKB) and Invesco Galaxy (BTCO) offer modest fee advantages (0.21 %–0.25 %) plus ESG overlays. VanEck’s HODL and Valkyrie’s BRRR market themselves as “Bitcoin purist” plays that rebalance less frequently to minimise slippage.
Looking forward, several applicants (Franklin Templeton, WisdomTree) have filed for “staking‑enabled” Ethereum ETFs that could distribute a portion of validator rewards. Meanwhile, the CFTC‑regulated futures complex supports a growing crop of actively managed Bitcoin strategy funds (e.g., BITX, MAXI) that toggle between futures and cash to dampen volatility.
| Ticker | Issuer | Asset Focus | Launch Date | Expense Ratio | AUM (18 Apr 2025) | YTD Net Flows |
|---|---|---|---|---|---|---|
| GBTC | Grayscale | Bitcoin | 11 Jan 2024 (conversion) | 1.50 % | US $21.5 bn | – US $19.9 bn |
| ETHE | Grayscale | Ethereum | 11 Jan 2024 (conversion) | 1.50 % | US $6.0 bn | – US $2.3 bn |
| IBIT | BlackRock | Bitcoin | 11 Jan 2024 | 0.25 % (0.12 % waiver) | US $23.0 bn | + US $3.4 bn |
| FBTC | Fidelity | Bitcoin | 11 Jan 2024 | 0.25 % | US $15.1 bn | + US $1.9 bn |
| BITB | Bitwise | Bitcoin | 11 Jan 2024 | 0.20 % (0 % waiver to US $1 bn) | US $5.2 bn | + US $1.2 bn |
| ARKB | ARK 21Shares | Bitcoin | 11 Jan 2024 | 0.21 % | US $3.3 bn | + US $0.7 bn |
| BTCO | Invesco Galaxy | Bitcoin | 11 Jan 2024 | 0.25 % | US $2.1 bn | + US $0.4 bn |
| HODL | VanEck | Bitcoin | 11 Jan 2024 | 0.20 % | US $1.4 bn | + US $0.3 bn |
| BRRR | Valkyrie | Bitcoin | 11 Jan 2024 | 0.25 % | US $0.9 bn | + US $0.2 bn |
These figures highlight a bifurcated market: legacy trusts haemorrhage capital under fee pressure, while low‑fee entrants consolidate share and niche products incubate specialised angles such as ESG or active risk management.
5 Opportunity Amid the Bloodbath
5.1 Discount‑to‑NAV Arbitrage Strategies
Discounts of –1 % to –2 % on GBTC and –8 % on ETHE may look modest beside the double‑digit gaps of the trust era, yet they still translate into meaningful alpha for hedge‑fund desks able to buy ETF shares, redeem for coins, and liquidate on‑chain. For retail investors without authorised‑participant access, simply purchasing shares below net‑asset value offers an embedded cushion versus spot. Historical mean‑reversion studies show GBTC’s discount narrows to under 0.5 % during renewed inflow bursts, implying a potential +150 basis‑point out‑performance if flows inflect. Investors should track daily premium/discount feeds from issuers and ETF analytics dashboards and be prepared to rotate capital swiftly.
5.2 Tax‑Loss Harvesting & Portfolio Rebalancing Angles
Cryptocurrency remains outside the U.S. wash‑sale rule, meaning an investor can sell a Bitcoin ETF, realize the capital loss, and immediately repurchase Bitcoin exposure—either via a lower‑fee competitor or direct custody—without waiting the customary 30 days. This loophole will likely close once Congress harmonises crypto with securities law, but as of April 2025 it creates a rare free option to offset other 2025 gains while staying fully invested. Sophisticated allocators combine loss harvesting with fee arbitrage: crystallise the GBTC loss, migrate into a 0.25 % fund, and pick up both tax alpha and annual fee savings.
5.3 Rate‑Cut Tailwinds: How Monetary Policy Could Flip the Script
Futures markets now assign ≈ 70 % odds of the first Federal‑Reserve rate cut by the July 2025 FOMC meeting, with traders pricing a cumulative 50 basis‑points of easing by year‑end. Lower real yields historically correlate with stronger crypto performance as the opportunity cost of holding non‑yielding assets falls. Should the Fed pivot, dormant risk budgets at pensions and multi‑asset funds could redeploy into the most liquid crypto proxies—the spot ETFs—recompressing discounts and reversing YTD outflows.
5.4 Staking‑Enabled or Hybrid Funds: The Next Product Wave?
Regulatory momentum suggests that pass‑through yield is no longer a distant dream. In April 2025 the SEC acknowledged pending amendments for in‑kind redemptions and staking within proposed Ethereum ETFs from Fidelity and Franklin Templeton, though the agency has yet to sign off. Parallel filings for Solana and even multi‑asset “crypto income” funds explicitly reference validator rewards. If approved, these hybrids would collapse the utility gap between on‑chain ownership and ETFs, likely unleashing a fresh asset‑allocation cycle—particularly from institutions restricted to ’40 Act structures.
| Catalyst | Current Status (18 Apr 2025) | 12‑Month Probability | Potential Investor Moves |
|---|---|---|---|
| GBTC/ETHE discount mean‑reversion | –1 % / –8 % | 60 % | Accumulate below NAV; hedge with futures |
| Wash‑sale loophole intact | No 30‑day rule on crypto | 50 % chance of closure by 2026 | Harvest losses; switch to low‑fee ETF |
| Fed rate cuts | 70 % odds by Jul 2025 | 70 % | Increase cyclical crypto exposure |
| Staking‑enabled ETFs | SEC reviewing filings | 40 % | Allocate to early‑approval issuers; stake on‑chain in interim |
6 Expert Outlook & Scenario Analysis (2025‑2026)
6.1 Base Case: Sideways Consolidation
Most strategists see a cooling period rather than a crash. Under this base case, U.S. monetary policy eases only gradually—one or two 25 basis‑point cuts beginning in late‑2025—keeping real yields positive but less punitive. Bitcoin and Ethereum oscillate inside the broad post‑approval ranges (BTC US $55 k–80 k, ETH US $2 .7 k–4 k). Fee compression at legacy products continues, with Grayscale forced below 1.00 % by Q4 but still losing modest assets to cheaper peers. Net spot‑ETF flows hover near zero: inflow days and outflow days alternate, leaving full‑year 2025 roughly balanced after the brutal Q1 drain. Discounts settle in a narrow corridor (GBTC –1 % to –0.5 %; ETHE –6 % to –4 %) as authorised‑participants opportunistically arbitrage any wider gaps. Market sentiment remains cautiously constructive, awaiting a catalyst—regulatory clarity or macro easing—to break the range.
6.2 Bull Case: Regulatory Clarity + Staking Integration + Rate Cuts
The upside scenario stacks three tailwinds. First, Congress fast‑tracks a bipartisan digital‑asset framework that de‑risks custody rules and green‑lights limited staking inside ’40 Act funds. Second, the Federal Reserve front‑loads easing, slicing policy rates by 75 basis‑points before December 2025 and signalling balance‑sheet neutrality. Finally, the SEC approves in‑kind Ethereum ETF redemptions and allows issuers to pass through staking rewards. Capital floods back: cumulative spot‑ETF inflows rebound by US $25 billion, erasing all prior outflows. GBTC’s fee cut to 0.25 % ends the discount entirely, driving a brief premium. Bitcoin punches out a new all‑time high above US $95 k, with on‑chain volumes mirrored by a record US $9 billion average daily turnover across ETFs. Institutional models—particularly U.S. pensions that need ETF structures—allocate an extra 0.2 % to crypto in diversified portfolios, institutionalizing the asset class.
6.3 Bear Case: Extended Risk‑Off, Fee‑Compression Squeeze & More Outflows
The downside story features sticky inflation and a Fed that delays cuts until 2026. Real rates remain above 2 %, the dollar firms, and geopolitical risk (e.g., a fresh energy shock) drives a broader risk‑asset exodus. ETF fee wars intensify: Bitwise slashes to 0.10 %, Fidelity waives fees another year, and Grayscale capitulates to 0.25 % yet still trails on flows. Authorised‑participants redeem aggressively, pulling another US $30 billion from Bitcoin funds and US $4 billion from Ether funds. Without a clear regulatory pathway, staking‑enabled ETFs stall and on‑chain alternatives hoover liquidity. GBTC and ETHE settle into wider discounts (–3 % and –10 % respectively) while Bitcoin grinds down to US $42 k and Ethereum to US $1.8 k. Under this stress, at least one small issuer shutters its product due to persistent sub‑scale AUM.
| Scenario | Key Drivers | 2025‑End Net ETF Flows | BTC Price Range | ETH Price Range | GBTC Discount | Probability* |
|---|---|---|---|---|---|---|
| Base | Gradual Fed cuts, fee compression, no staking | ± US $2 bn | 55 k–80 k | 2.7 k–4 k | –1 % to –0.5 % | 50 % |
| Bull | Aggressive easing, staking approval, clear regs | + US $25 bn | 80 k–100 k | 4 k–6 k | 0 % to +1 % | 30 % |
| Bear | No rate cuts, global risk‑off, fierce fee war | – US $30 bn | 35 k–55 k | 1.8 k–3 k | –3 % to –5 % | 20 % |
7 Investor Action Plan
7.1 Due‑Diligence Checklist for Evaluating Crypto ETFs
Before allocating fresh capital—or rotating out of an expensive wrapper—apply a systematic screen:
- Total Expense Ratio (TER) – target ≤ 0.30 % for core exposure. Every 10 bps difference costs ≈ 0.6 % of cumulative performance over a five‑year horizon.
- Premium/Discount Volatility – review 30‑day average deviation from NAV; a tight band (< 0.4 %) indicates healthy authorised‑participant activity.
- Liquidity Metrics – average daily dollar volume ≥ US $50 million and on‑screen spreads ≤ 4 bps for efficient execution.
- Custodian & Insurance – confirm multi‑sig or segregated cold‑storage custody, plus crime‑policy coverage; IBIT and FBTC use Coinbase Custody with US$200 million excess‑loss insurance.
- Share‑Creation Structure – in‑kind creations/redemptions reduce tax leakage; cash‑only processes incur trading slippage inside the fund.
- Regulatory Pipeline – issuers with pending amendments for staking or in‑kind ETH redemptions warrant a forward premium.
7.2 ETF Exposure vs Direct Custody vs Staking Platforms
| Attribute | Spot‑Crypto ETF | Self‑Custody Hardware Wallet | On‑Chain Staking/Liquid‑Staking Token |
|---|---|---|---|
| Yield | None (until staking‑enabled) | None | 3.5 – 5 % ETH; 2 – 4 % SOL |
| Regulatory Clarity | High (SEC‑registered) | Moderate (self‑reporting) | Low‑to‑moderate (jurisdiction dependent) |
| Counter‑party Risk | Custodian bankruptcy + issuer risk | User error/hardware loss | Smart‑contract & validator slashing |
| Tax Complexity (U.S.) | 1099‑B single line item | Form 8949 for each tx | Ordinary income + capital gains events |
| Ease of Use | Brokerage click | Requires wallet management | Requires DeFi proficiency |
Guideline: Use ETFs for exposure inside retirement or advisory accounts; self‑custody for strategic long‑term holdings; on‑chain staking for yield‑seeking, tech‑savvy capital.
7.3 Position Sizing, Risk Controls, and Rebalancing Windows
- Core‑Satellite Framework – cap total crypto at 2 – 5 % of a diversified portfolio. Allocate 70 % of that slice to low‑fee Bitcoin ETFs (core) and 30 % to satellite plays (staking ETH, liquid‑staking tokens, or higher‑beta alt‑ETFs).
- Volatility Budgeting – target risk parity: allot crypto notional such that daily VaR equals that of a 20 % equity position. Adjust sizing quarterly based on realised volatility.
- Rebalancing Schedule – calendar‑quarter rebalancing captures mean‑reversion; intra‑quarter triggers at ± 150 bps of NAV discount wideness can justify tactical trades between products.
- Stop‑Loss & Hedge Tools – use CME micro Bitcoin futures for downside hedging; 1 BTC micro equals 0.01 BTC, allowing granular coverage against ETF positions without triggering wash‑sale complications.
7.4 Flow Data & Fee‑Change Dashboards to Monitor
- CoinShares Weekly Digital‑Asset Fund Flows (published Mondays) – high‑frequency snapshot of institutional behaviour.
- Farside Investors ETF Dashboard – real‑time creation/redemption and premium charts for IBIT, GBTC, FBTC, ETHE, and others.
- Bloomberg Terminal <ETF FFLOW> Function – aggregated cross‑venue flow heat maps and rolling NAV spreads.
- Issuer Filings (SEC EDGAR) – track S‑1 or 497K supplements for fee cuts and structural changes (e.g., pending staking amendments).
- On‑Chain Glassnode & Dune Analytics Boards – monitor post‑redemption coin movements to assess arb pressure.
| Investor Archetype | Portfolio Goal | Recommended Vehicle(s) | Key KPIs to Watch | Action Frequency |
|---|---|---|---|---|
| Fee‑Sensitive RIA | Passive BTC exposure inside IRAs | IBIT / FBTC (≤ 0.25 % TER) | Premium/discount; fee notices | Semi‑annual review |
| Yield‑Hunter Family Office | Total‑return ETH exposure | Wait for staking‑enabled ETF; interim Lido stETH | Staking APR; SEC approval timeline | Monthly |
| Tactical Hedge‑Fund | Discount‑capture arbitrage | Long GBTC, short CME BTC futures | Discount > 1 %; basis spread | Continuous |
| Retail HODLer | Simple “buy & forget” crypto sleeve | 70 % IBIT, 30 % Cold‑wallet ETH | Fee drift; custody insurance | Annual |
| Compliance‑Bound Pension | Reg‐heavy, liquid proxy | Large‑cap ETF basket (IBIT, FBTC) | Daily liquidity; AUM ≥ US $10 bn | Quarterly |
8 Conclusion – Dead End or Version 2.0?
8.1 What the 2025 Bloodbath Really Means
Crypto’s first year under the ETF spotlight proved two things simultaneously: investor enthusiasm can materialise at record speed, and capital can flee just as quickly when structure, fees, and macro collide. The spectacular reversal from $10 billion in January 2024 inflows to multiple $500 million‑plus weekly outflows in 2025 is less a fatal verdict on the asset class than a stress‑test of product‑market fit. High‑friction wrappers, zero yield, and policy uncertainty turned the inaugural cohort of spot ETFs into training wheels—not yet the sleek racing bikes institutions ultimately want.
8.2 Evolutions Already in Motion
Fee compression is relentless and asymmetric: every issuer below 0.30 % is still attracting sticky assets, while anything above 1 % bleeds. Regulators have begun engaging with in‑kind redemptions and staking mechanics. Derivatives venues are absorbing liquidity that ETFs have yet to recapture—but that gap will shrink if products can deliver yield and tighter spreads. Macro cross‑currents remain pivotal: once the Federal Reserve signals a decisive easing cycle, the opportunity cost of non‑yielding Bitcoin will collapse, placing well‑engineered ETFs back in pole position for institutional flows.
8.3 Guiding Questions Before You Hit “Buy”
Are fees eating your alpha faster than Bitcoin’s halvings create scarcity?
Would a staking‑enabled or hybrid fund change your allocation size?
How much of your thesis depends on near‑term Fed cuts—and what’s Plan B if policy stays tight?
Are you prepared to monitor NAV discounts daily, or is set‑and‑forget custody a better fit?
8.4 Looking Ahead: Version 2.0 Playbook
Expect the next generation of crypto ETFs to blur the line between passive exposure and on‑chain participation. Hybrid models that pass through staking or ancillary yield, dynamic fee schedules that reward long‑term holders, and cross‑listing in Europe and Asia could turn 2024’s novelty into 2026’s portfolio staple. Investors who endured the 2025 drawdown may find themselves early in the curve once Version 2.0 launches—provided they remain selective, fee‑aware, and macro‑savvy.