1. Overview of the Stochastic Momentum Index (SMI) Indicator
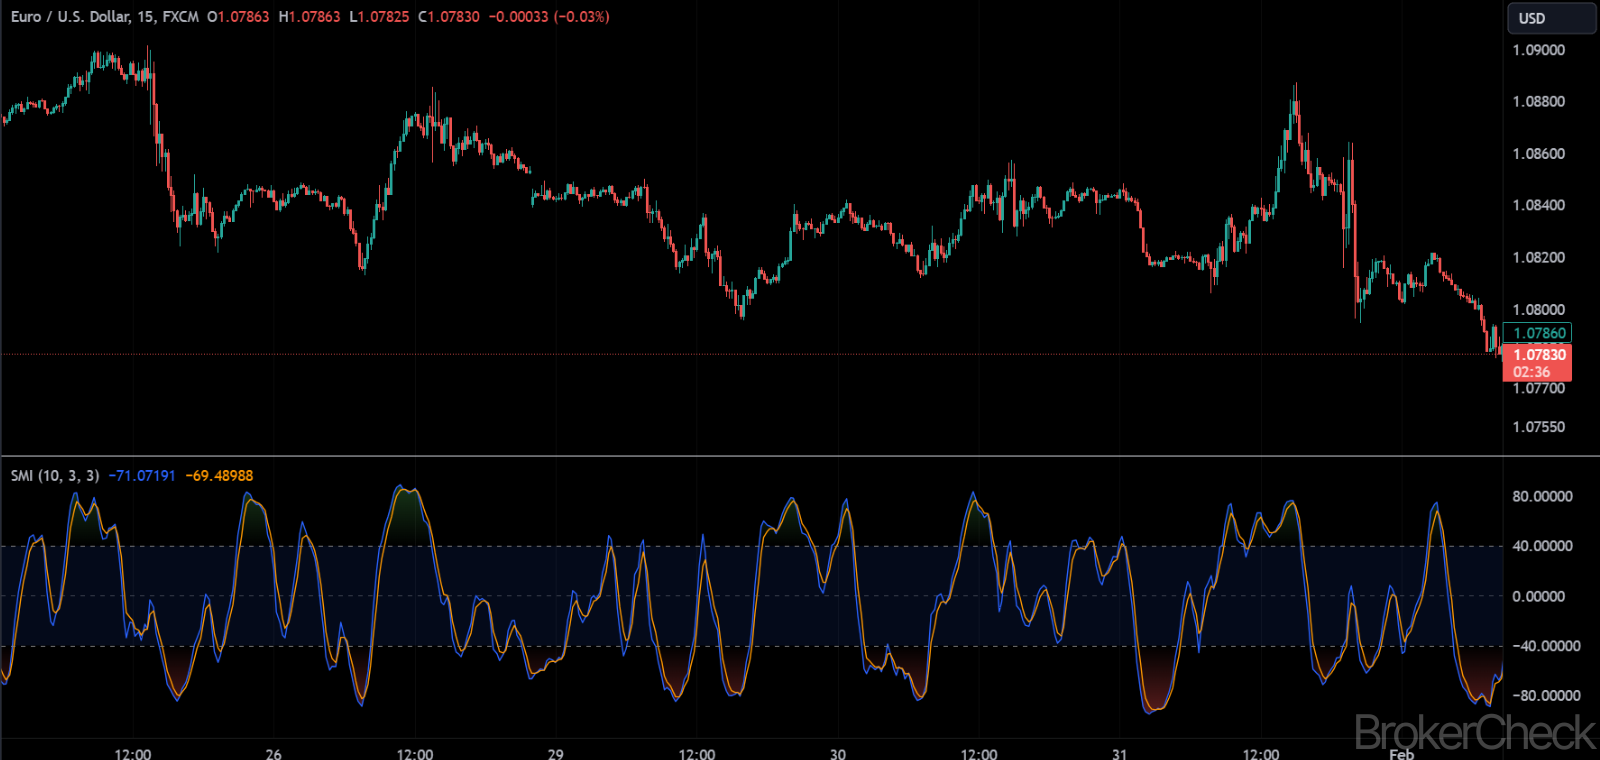
The Stochastic Momentum Index (SMI) is an advanced version of the traditional stochastic oscillator, a momentum indicator that measures the position of a security’s price in relation to its high/low range over a set period. Developed by William Blau in the early 1990s, the SMI aims to provide a more refined insight into the momentum of a financial instrument by considering where the close price is relative to the midpoint of the same high/low range. This results in an indicator that is smoother, more responsive, and better suited to identifying the current trend’s strength or weakness.
1.1. Definition and Calculation
The SMI takes the concept of the stochastic oscillator further by focusing on the distance between the closing price and the midpoint of the high/low range, rather than the closing price’s position within the high/low range itself. The formula for calculating the SMI involves several steps, which include smoothing the difference between the close and the midpoint, as well as smoothing the possible range. These values are then used to calculate the SMI value, which is plotted against a signal line to generate trading signals.
1.2. Purpose and Use
The primary purpose of the SMI is to identify the direction of price momentum and potential reversal points within a market. It is especially useful in distinguishing between bullish and bearish price movements and can help traders determine optimal entry and exit points. Due to its sensitivity and accuracy, the SMI is a valuable tool for both short-term traders and long-term investors looking to capitalize on market trends.
1.3. Basic Principles
The SMI operates under a few basic principles:
- Zero Line Crosses: The SMI value crossing above or below the zero line indicates bullish or bearish momentum, respectively.
- Divergence: A divergence occurs when the price of a security makes a new high or low that is not confirmed by the SMI, potentially indicating a reversal.
- Overbought/Oversold Levels: Unlike traditional stochastic oscillators, the SMI does not have fixed overbought and oversold levels, giving it flexibility in various market conditions.
| Feature | Description |
|---|---|
| Type | Momentum Indicator |
| Developed by | William Blau |
| Purpose | To measure momentum by comparing the closing price to the midpoint of the high/low range |
| Calculation Complexity | Moderate, involves smoothing and comparison |
| Primary Use | Identifying trend strength, direction, and potential reversals |
| Best for | Traders and investors seeking to refine entry/exit points based on momentum |
2. Calculation Process of the Stochastic Momentum Index (SMI) Indicator
The calculation of the Stochastic Momentum Index (SMI) is a multi-step process that refines the price data to produce an indicator capable of highlighting momentum with greater precision than traditional stochastic oscillators. This section breaks down the calculation process into its fundamental components, explaining each step in detail to provide a clear understanding of how the SMI is derived.
2.1. Formula Breakdown
The SMI calculation involves several key formulas:
- Calculation of the D Line:
- D = (Close – (High + Low) / 2) / High – Low
- This formula computes the difference between the closing price and the midpoint of the high/low range, then divides it by the range (high – low) of the price in the period. This value is then smoothed using a simple or exponential moving average.
- Smoothing the D Line:
- First smoothing: Apply a 3-period exponential moving average (EMA) to the D line.
- Second smoothing: Apply another smoothing, typically a 3-period EMA, to the result from the first smoothing.
- Calculation of the SMI:
- SMI = ((Dsmoothed – Dsmoothed average) / (0.5 x Drangesmoothed)) x 100
- The SMI is calculated by taking the smoothed D value, subtracting the smoothed average of D, and then dividing by half the smoothed range of D, finally multiplying by 100 to express it as a percentage.
- Signal Line:
- A signal line, which is typically a simple moving average of the SMI, is also calculated to generate trading signals through crossovers.
2.2. Step-by-Step Calculation
To calculate the SMI:
- Determine High, Low, and Close: Identify the high, low, and closing prices for the period being analyzed.
- Compute the D Line: Use the formula provided to calculate the D line value.
- Smooth the D Line: Apply the specified exponential moving averages to smooth the D line, doing so twice.
- Calculate the SMI: Follow the formula to derive the SMI value.
- Derive the Signal Line: Calculate the moving average of the SMI for the period specified (often 9 periods).
2.3. Parameters and Adjustments
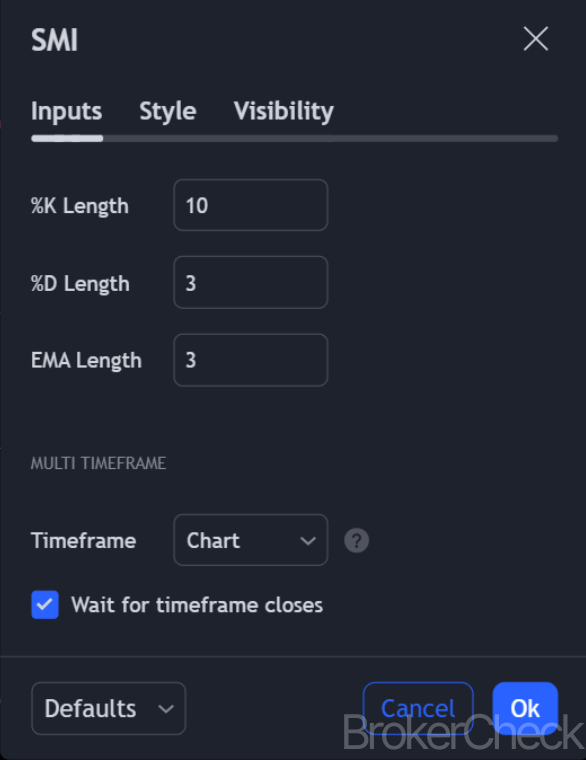
The standard parameters for the SMI calculation are:
- Length for the D line smoothing: 3 periods.
- Length for the SMI smoothing: 3 periods for the first smoothing of the D line and another 3 for the second smoothing.
- Signal line period: Typically set to 9 periods.
However, these parameters can be adjusted to suit different trading styles and timeframes. Increasing the smoothing periods will make the SMI less sensitive and smoother, which might be preferable for long-term trend analysis. Decreasing the periods will make the SMI more responsive, suitable for short-term trading.
| Step | Process | Description |
|---|---|---|
| 1 | High, Low, Close | Determine the high, low, and close prices for the period. |
| 2 | D Line Calculation | Calculate the D line value. |
| 3 | D Line Smoothing | Apply EMA to smooth the D line. |
| 4 | SMI Calculation | Derive the SMI value using the smoothed D line. |
| 5 | Signal Line | Calculate the moving average of the SMI as the signal line. |
3. Optimal Values for Setup in Different Timeframes
The Stochastic Momentum Index (SMI) is versatile, allowing adjustments to its parameters to suit various trading strategies and timeframes. This adaptability is crucial for traders aiming to maximize the indicator’s effectiveness across different market conditions. This section explores optimal SMI setup values for short-term, medium-term, and long-term trading timeframes, providing insights into how adjustments to these parameters can enhance trading decisions.
3.1. Short-term Trading
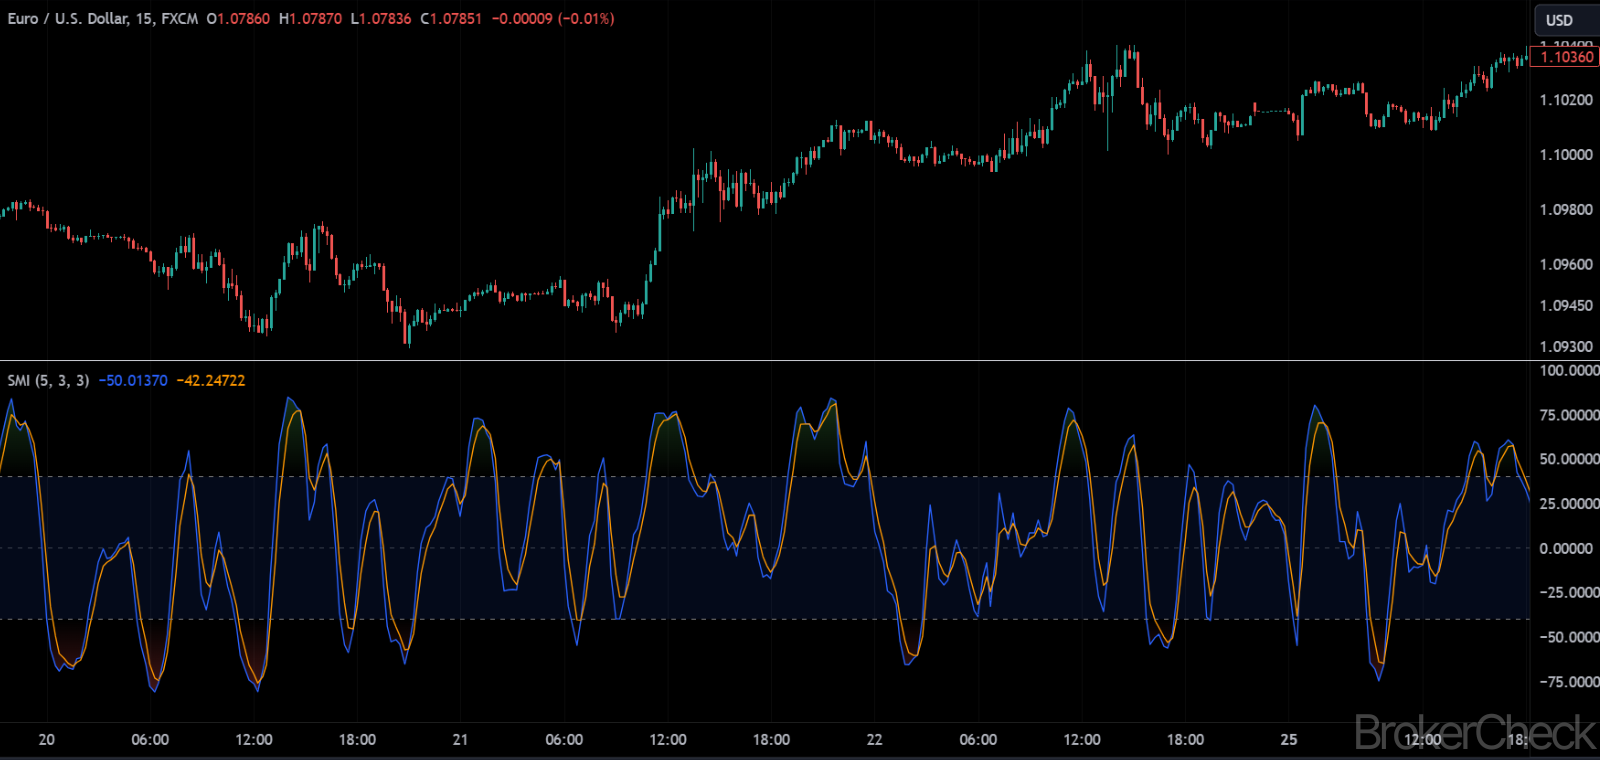
Short-term traders, such as day traders or scalpers, require fast and responsive indicators to keep pace with the rapid movements in the market. For these traders, the SMI settings need to be adjusted for higher sensitivity.
- Length: Decreasing the length parameter (the number of periods used for calculation) can make the SMI more responsive. A common setting for short-term trading is 5 periods.
- Signal Line Smoothing: A lower smoothing period for the signal line, such as 3, can help in generating quicker signals for entry and exit.
- Optimal Values: Length = 5, D = 3, Smoothing = 3
These settings can help short-term traders identify momentum changes more quickly, albeit at the risk of increasing the rate of false signals due to market noise.
3.2. Medium-term Trading
Medium-term traders, including swing traders, need a balance between responsiveness and the ability to filter out market noise. Adjusting the SMI to moderate settings can provide a good compromise.
- Length: A moderate length setting, such as 9 to 12 periods, offers a balance between sensitivity and the ability to smooth out short-term volatility.
- Signal Line Smoothing: A smoothing period of 5 to 8 helps in filtering out noise while still being responsive to significant market moves.
- Optimal Values: Length = 9 to 12, D = 5, Smoothing = 5 to 8
These settings are designed to provide medium-term traders with reliable signals that reflect underlying trends without reacting to minor price fluctuations.
3.3. Long-term Trading
Long-term traders, such as position traders, benefit from indicators that highlight longer-term trends and minimize the impact of short-term volatility. For the SMI, this means extending the calculation periods.
- Length: Increasing the length parameter to 14 to 20 periods helps in identifying longer-term momentum shifts.
- Signal Line Smoothing: A higher smoothing period, such as 9 to 14, reduces the sensitivity to short-term fluctuations.
- Optimal Values: Length = 14 to 20, D = 9, Smoothing = 9 to 14
These settings aim to provide long-term traders with a clear view of the market’s overarching momentum trends, reducing the noise associated with shorter-term market movements.
| Trading Style | Length | D | Smoothing | Purpose |
|---|---|---|---|---|
| Short-term | 5 | 3 | 3 | High sensitivity to capture quick market movements |
| Medium-term | 9 to 12 | 5 | 5 to 8 | Balance between sensitivity and noise reduction |
| Long-term | 14 to 20 | 9 | 9 to 14 | Focus on long-term trends, minimizing short-term volatility |
4. Interpretation of the Stochastic Momentum Index (SMI)
Interpreting the Stochastic Momentum Index (SMI) correctly is key to leveraging its full potential in trading strategies. This section delves into the nuances of reading and applying SMI signals to identify trading opportunities, understand market sentiment, and anticipate potential price movements.
4.1. Identifying Trend Direction
The SMI provides clear insights into the trend direction based on its position relative to the zero line:
- Above Zero Line: When the SMI value is above the zero line, it indicates upward momentum, suggesting that the market is in a bullish phase.
- Below Zero Line: Conversely, an SMI value below the zero line signifies downward momentum, indicating a bearish market environment.
4.2. Momentum Divergence
Divergence between the SMI and price action is a powerful signal that can precede reversals:
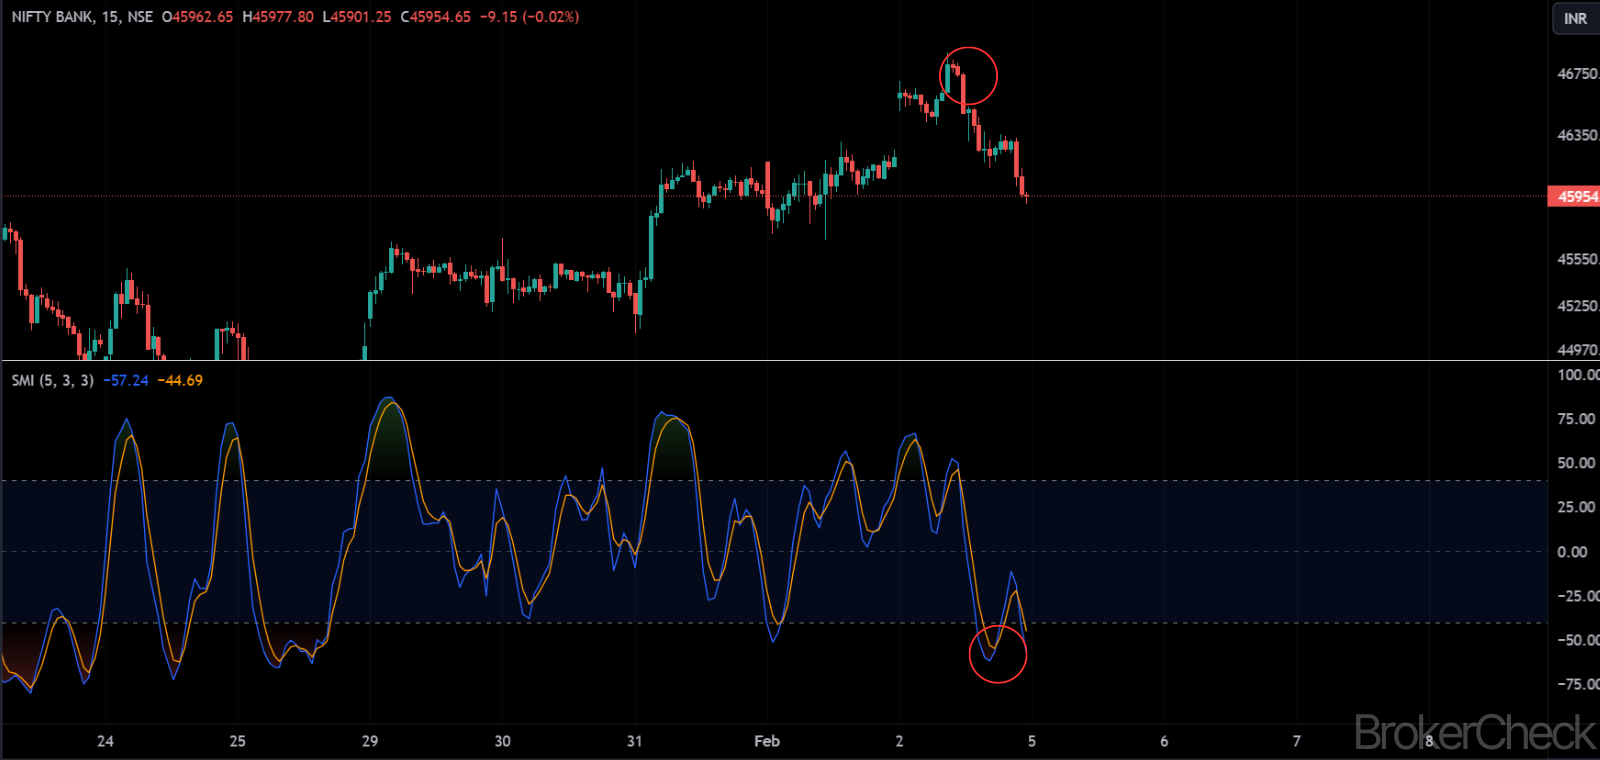
- Bullish Divergence: Occurs when the price records a lower low, but the SMI forms a higher low. This indicates weakening downward momentum and a potential upward reversal.
- Bearish Divergence: Forms when the price achieves a higher high, but the SMI creates a lower high, signaling weakening upward momentum and a possible downward reversal.
4.3. Overbought and Oversold Conditions
While the SMI does not have fixed overbought and oversold levels, traders can set their thresholds to identify extreme market conditions:
- Overbought Threshold: Traders might consider levels significantly above the zero line (e.g., +40) as indicating overbought conditions, suggesting a pullback or reversal could be imminent.
- Oversold Threshold: Similarly, levels well below the zero line (e.g., -40) might be used to signal oversold conditions, potentially foreshadowing an upward correction or reversal.
4.4. Crossovers as Trading Signals
The interaction between the SMI and its signal line can generate trading signals:
- Bullish Signal: A crossover of the SMI above its signal line can be seen as a bullish signal, especially if it occurs below the zero line and moves upward.
- Bearish Signal: A crossover of the SMI below its signal line is considered bearish, particularly if it takes place above the zero line and heads downward.
| Signal | Interpretation | Implication |
|---|---|---|
| SMI Above Zero | Bullish Momentum | Potential for continuation of an uptrend |
| SMI Below Zero | Bearish Momentum | Possibility of a downtrend persisting |
| Bullish Divergence | Weakening Downward Momentum | Possible upward reversal |
| Bearish Divergence | Weakening Upward Momentum | Potential downward reversal |
| Overbought/Oversold Conditions | Extreme Market Conditions | Reversal likely if accompanied by divergence/crossover |
| Crossovers | SMI and Signal Line Interaction | Immediate trading signals for bullish/bearish moves |
5. Combining the Stochastic Momentum Index (SMI) with Other Indicators
To enhance trading strategies and improve decision-making, traders often combine the Stochastic Momentum Index (SMI) with other technical indicators. This synergy can help confirm signals, reduce false positives, and provide a more comprehensive view of market conditions. This section explores effective combinations of the SMI with other indicators to improve trading outcomes.
5.1. SMI and Moving Averages
Combining the SMI with moving averages (MAs) can help identify trend direction and momentum shifts within the context of the trend:
- Strategy: Use a longer-term MA (e.g., 50 or 200 periods) to determine the overall trend direction. Buy signals are more reliable when the SMI turns positive above the MA (indicating a bullish momentum in an uptrend), and sell signals are more credible when the SMI turns negative below the MA (indicating bearish momentum in a downtrend).
5.2. SMI and Relative Strength Index (RSI)
The RSI, another momentum oscillator, measures the speed and change of price movements. When used with the SMI, it can help confirm overbought or oversold conditions:
- Strategy: Look for convergence or divergence between the SMI and RSI for stronger signals. For example, if both indicators show overbought conditions but then diverge, with the SMI crossing below its signal line while the RSI begins to fall, it may indicate a potential reversal from an overbought state.
5.3. SMI and Bollinger Bands
Bollinger Bands® provide insights into market volatility and price levels relative to moving averages. The SMI can be used to confirm breakout signals provided by Bollinger Bands®:
- Strategy: When price breaks above or below the Bollinger Bands®, confirmation from the SMI (such as crossing above or below the zero line or signal line) can provide additional confirmation of a potential trend continuation or reversal.
5.4. SMI and MACD
The Moving Average Convergence Divergence (MACD) is a trend-following momentum indicator. Combining the MACD with the SMI offers insights into both trend and momentum:
- Strategy: Look for situations where the MACD and the SMI provide concurrent signals. For instance, a bullish signal is reinforced if the MACD crosses above its signal line at the same time the SMI crosses above its signal line or zero line.
| Indicator Combination | Strategy | Purpose |
|---|---|---|
| SMI and Moving Averages | Confirm SMI signals with MA trend direction | Filter signals to align with the overall trend |
| SMI and RSI | Look for overbought/oversold conditions and divergence | Confirm momentum shifts and potential reversals |
| SMI and Bollinger Bands® | Use SMI to confirm Bollinger Bands® breakouts | Validate trend continuations or reversals |
| SMI and MACD | Confirm concurrent signals from both indicators | Strengthen the reliability of trend and momentum signals |
6. Risk Management with the Stochastic Momentum Index (SMI)
Effective risk management is crucial when trading with the Stochastic Momentum Index (SMI), as with any trading indicator. This section outlines strategies for using the SMI to manage trading risks, ensuring that traders can maximize their potential for profit while minimizing losses.
6.1. Setting Stop-Loss Orders
One of the most fundamental risk management techniques involves setting stop-loss orders. The SMI can help determine appropriate levels for these orders:
- Above/Below Signal Line Cross: Traders can set stop-loss orders just above or below the point where the SMI crosses its signal line, depending on whether they are going long or short.
- Beyond Recent Highs/Lows: Another approach involves setting stop-loss orders beyond the most recent high or low that preceded the trade signal, using the SMI to confirm the trend’s direction.
6.2. Using the SMI for Position Sizing
Position sizing can be adjusted based on the strength of the SMI signal:
- Strong Signals: For signals that occur with significant divergence or in oversold/overbought regions, traders might opt for larger position sizes due to the higher probability of a strong move.
- Weaker Signals: When signals are less pronounced or occur without additional confirmation, reducing position size can help manage risk.
6.3. Incorporating Divergence for Risk Assessment
Divergence between the SMI and price action can serve as an early warning system for changing market conditions:
- Risk Reduction: If a divergence signal occurs shortly after entering a trade, it may be prudent to tighten stop-loss orders or reduce position size to manage risk.
- Exit Strategy: Persistent divergence following a trade entry can be a signal to exit the position, even if the stop-loss has not been triggered, to avoid potential losses from a reversing trend.
6.4. Combining the SMI with Other Indicators
No indicator should be used in isolation for risk management. Combining the SMI with other indicators can provide a more robust risk management strategy:
- Trend Indicators: Using trend indicators like moving averages can help confirm the trend direction suggested by the SMI, providing a stronger basis for trade decisions.
- Volume Indicators: Volume indicators can confirm the strength of the SMI signal, with higher volume on signal confirmation indicating a more reliable move.
| Strategy | Description | Purpose |
|---|---|---|
| Stop-Loss Orders | Set based on SMI signals or recent highs/lows | To limit potential losses on a trade |
| Position Sizing | Adjust size based on the strength of SMI signals | To manage the risk associated with the uncertainty of trade outcomes |
| Divergence for Risk Assessment | Monitor divergence for early risk signals | To adjust or exit trades preemptively to manage potential losses |
| Combining Indicators | Use SMI with other technical indicators | For a more comprehensive risk management approach |