Introducing the Rainbow Indicator: A Combination of Moving Averages for Trend-Following
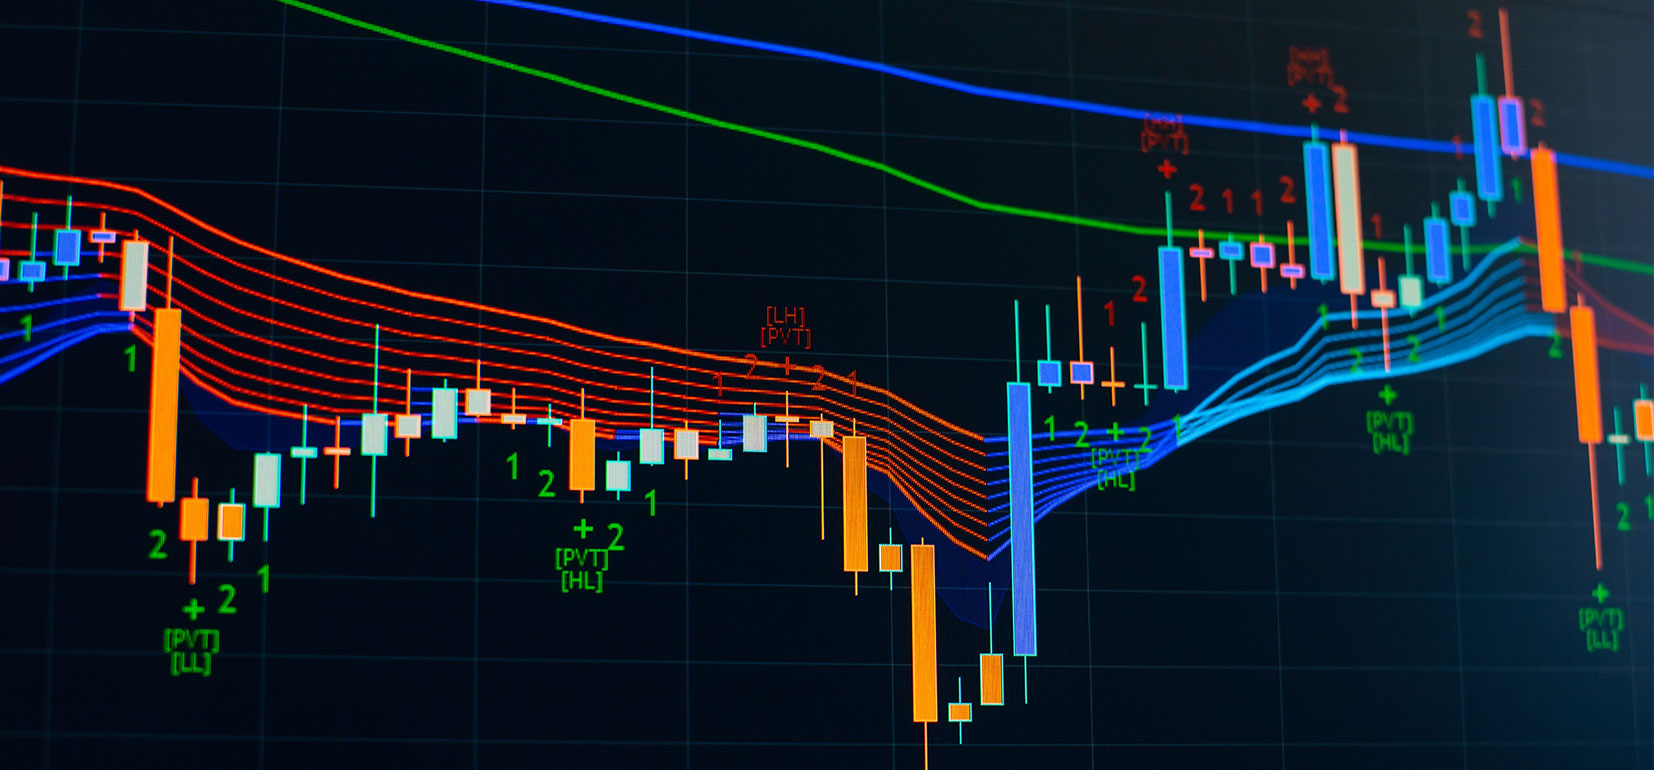
The Rainbow Indicator is a unique technical analysis tool that combines various moving averages to confirm trend changes and help traders make informed decisions. Developed by Sofien Kaabar, the Rainbow Indicator is a blend of smoothed moving averages that work together to identify the beginning or end of a trend. In this article, we’ll take a closer look at how the Rainbow Indicator works and how it can be used in your trading strategy.
First, let’s define what a moving average is. A moving average is a trend-following indicator that shows the average price of a security over a set period of time. It is calculated by adding up the closing prices for a given number of periods and then dividing the total by the number of periods. The resulting average is then plotted on a chart to show the security’s overall price trend.
There are several types of moving averages, including simple moving averages, exponential moving averages, and weighted moving averages. Each type is calculated differently and may be more suitable for different types of markets or trading styles.
The Rainbow Indicator is a combination of smoothed moving averages that are used together to confirm trend changes. It is a blend of the simple moving average, exponential moving average, and smoothed moving average, which can be transformed into one another using a simple formula. This versatility makes the Rainbow Indicator a powerful tool for both trend-following and contrarian trading.
So, how does the Rainbow Indicator work? When the different moving averages are aligned in the same direction, it is a strong indication of a trend. When the moving averages are moving in opposite directions, it may be a sign that the trend is changing. By using the Rainbow Indicator, traders can identify these changes and make informed decisions about when to enter or exit a trade.
To build the Rainbow Indicator from scratch, you’ll need to have a solid understanding of Python programming. Sofien Kaabar has published a book, “The Book of Trading Strategies,” which provides a more complete description of the Rainbow Indicator and other complex trading strategies, as well as code that is continuously updated on the book’s dedicated Github page.
How is the Rainbow Indicator calculated?
The Rainbow Indicator is calculated by combining different moving averages, including the simple moving average, exponential moving average, and smoothed moving average. To calculate these moving averages, you will need to have a solid understanding of Python programming.
To calculate the simple moving average, you will need to add up the closing prices for a given number of periods and then divide the total by the number of periods. The resulting average is then plotted on a chart to show the security’s overall price trend.
To calculate the exponential moving average, you will need to use the following formula:
EMA = (Price * α) + (EMA * (1 – α))
where EMA is the exponential moving average, Price is the current price of the security, and α is the smoothing factor. The smoothing factor determines how much weight is given to the current price versus the previous period’s exponential moving average.
To calculate the smoothed moving average, you can use the following formula:
SMA = (Price * α) + (SMA * (1 – α))
where SMA is the smoothed moving average, Price is the current price of the security, and α is the smoothing factor. The smoothed moving average is similar to the exponential moving average, but it gives more weight to the current price and therefore tends to provide less lag.
Why is the Rainbow Indicator a Powerful Tool for Confirming Trend Changes?
The Rainbow Indicator is a powerful tool for confirming trend changes because it combines various moving averages to provide a unique perspective on the market. A moving average is a trend-following indicator that shows the average price of a security over a set period of time. By using different types of moving averages, such as the simple moving average, exponential moving average, and smoothed moving average, the Rainbow Indicator can identify shifts in the market and help traders make informed decisions about when to enter or exit a trade.
When the different moving averages used in the Rainbow Indicator are aligned in the same direction, it is a strong indication of a trend. When the moving averages are moving in opposite directions, it may be a sign that the trend is changing. By using the Rainbow Indicator, traders can identify these changes and make informed decisions about when to enter or exit a trade.
The Rainbow Indicator is also a powerful tool because it is a blend of different moving averages, which provides a more comprehensive view of the market. Each type of moving average has its own strengths and weaknesses, and by combining them, the Rainbow Indicator is able to smooth out short-term fluctuations and highlight longer-term trends. This can be particularly useful in volatile markets, where it can be difficult to discern the underlying trend using a single moving average.
In addition, the Rainbow Indicator is a versatile tool that can be used for both trend-following and contrarian trading. When the moving averages are aligned in the same direction, it is a strong indication of a trend, which can be useful for trend-following traders. When the moving averages are moving in opposite directions, it may be a sign that the trend is changing, which can be useful for contrarian traders who are looking to profit from market reversals.
Overall, the Rainbow Indicator is a powerful tool for confirming trend changes because it combines various moving averages to provide a unique perspective on the market, smooth out short-term fluctuations, and highlight longer-term trends. It is a versatile tool that can be used for both trend-following and contrarian trading, making it a valuable addition to any trader’s toolkit.
How to Use the Rainbow Indicator to Enhance Your Trading Strategy
The Rainbow Indicator is a powerful technical analysis tool that combines various moving averages to confirm trend changes and help traders make informed decisions. If you are interested in using the Rainbow Indicator to enhance your trading strategy, here are a few tips to keep in mind:
- Use it in conjunction with other technical and fundamental analysis tools: The Rainbow Indicator is a valuable tool, but it should not be used in isolation. It is important to use it in conjunction with other technical and fundamental analysis tools to get a more comprehensive view of the market.
- Look for divergences: One way to use the Rainbow Indicator is to look for divergences between the different moving averages. When the moving averages are moving in opposite directions, it may be a sign that the trend is changing, which can be a good opportunity to enter or exit a trade.
- Use it to confirm trend changes: The Rainbow Indicator is particularly useful for confirming trend changes. When the different moving averages are aligned in the same direction, it is a strong indication of a trend. When the moving averages are moving in opposite directions, it may be a sign that the trend is changing. By using the Rainbow Indicator to confirm trend changes, you can make more informed decisions about when to enter or exit a trade.
- Don’t rely on it too heavily:While the Rainbow Indicator can be a valuable tool, it is important not to rely on it too heavily. It is a lagging indicator, meaning it is based on past price data and may not provide timely signals for current market conditions. It is always a good idea to use the Rainbow Indicator in conjunction with other technical and fundamental analysis tools to get a more comprehensive view of the market. Additionally, it is important to have a well-developed risk management plan in place to protect against potential losses.
By keeping these tips in mind, you can use the Rainbow Indicator to enhance your trading strategy and make more informed decisions about when to enter or exit a trade. However, it is important to remember that there are no guarantees in the world of investing, and there is always the possibility of losing money. It is always a good idea to thoroughly research the market and seek the advice of a financial advisor or professional before making any investment decisions.
Is the Rainbow Indicator the best of both worlds for trend following and contrarian trading?
Some people may think that the Rainbow Indicator is the best of both worlds for trend-following and contrarian trading because it combines different moving averages and can be transformed into one another using a simple formula. This versatility makes the Rainbow Indicator a powerful tool for both trend-following and contrarian trading.
For trend-following traders, the Rainbow Indicator can be useful for identifying strong trends and making informed decisions about when to enter or exit a trade. When the different moving averages used in the Rainbow Indicator are aligned in the same direction, it is a strong indication of a trend.
For contrarian traders, the Rainbow Indicator can be useful for identifying potential market reversals. When the moving averages are moving in opposite directions, it may be a sign that the trend is changing, which can be a good opportunity to enter or exit a trade.
Overall, the Rainbow Indicator’s versatility and ability to confirm trend changes makes it a valuable tool for both trend-following and contrarian traders. However, it is important to remember that the Rainbow Indicator is not a guarantee of success and there are no guarantees in the world of investing. It is always a good idea to use the Rainbow Indicator in conjunction with other technical and fundamental analysis tools and to have a well-developed risk management plan in place to protect against potential losses. It is also a good idea to thoroughly research the market and seek the advice of a financial advisor or professional before making any investment decisions.


