
What Is ALMA Indicator
The Arnaud Legoux Moving Average (ALMA) is a technical indicator used in financial markets to smooth out price data and help identify market trends. It was developed by Arnaud Legoux and Dimitrios Kouzis Loukas, aiming to reduce the lag often associated with traditional moving averages while improving smoothness and responsiveness.
Principle
ALMA operates on a unique principle. It uses a Gaussian distribution to create a smooth and responsive moving average. This approach allows it to closely follow the price data, making it a valuable tool for traders who rely on precision and timeliness in their analyses.
Features
- Reduced Lag: One of the standout features of ALMA is its ability to reduce lag, a common problem with many moving averages. By doing so, it provides a more accurate representation of current market conditions.
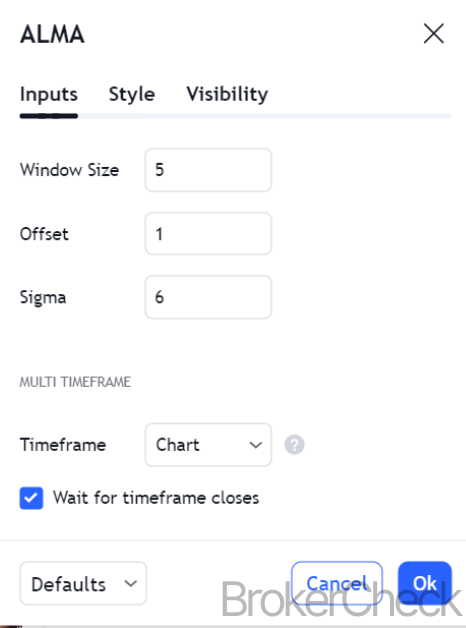
- Customization: ALMA allows traders to adjust parameters, such as the window size and the offset, enabling them to tailor the indicator to different trading styles and market conditions.
- Versatility: It is suitable for various financial instruments, including stocks, forex, commodities, and indices, across different timeframes.
Application
Traders typically use ALMA to identify trend direction, potential reversal points, and as a basis for other trading signals. Its smoothness and reduced lag make it particularly useful in markets that exhibit a lot of noise or erratic price movements.
| Feature | Description |
|---|---|
| Type | Moving Average |
| Purpose | Identifying trends, smoothing price data |
| Key Advantage | Reduced lag compared to traditional moving averages |
| Customization | Adjustable window size and offset |
| Suitable Markets | Stocks, Forex, Commodities, Indices |
| Timeframes | All, with customizable settings |
Calculation Process of the ALMA Indicator
Understanding the calculation process of the Arnaud Legoux Moving Average (ALMA) is crucial for traders who wish to customize this indicator according to their trading strategy. The ALMA’s unique formula sets it apart from traditional moving averages by incorporating a Gaussian filter.
Formula
The ALMA is calculated using the following formula:
ALMA(t) = ∑i=0N-1 w(i) · Price(t-i) / ∑i=0N-1 w(i)
Where:
- is the value of ALMA at time .
- is the window size or the number of periods
- is the weight of the price at time
- is the price at time
Weight Calculation
The weight is calculated using a Gaussian distribution, which is defined as:
w(i) = e-½(σ(i-M)/M)2
Where:
- is the standard deviation, typically set to 6.
- is the offset, which adjusts the window’s center. It’s calculated as
Steps in Calculation
- Determine Parameters: Set the window size , the offset , and standard deviation .
- Calculate Weights: Using the Gaussian distribution formula, compute the weights for each price within the window.
- Compute Weighted Sum: Multiply each price by its corresponding weight and sum these values.
- Normalize: Divide the weighted sum by the sum of the weights to normalize the value.
- Repeat Process: Calculate ALMA for each period to create the moving average line.
| Step | Description |
|---|---|
| Set Parameters | Choose window size , offset , and standard deviation |
| Calculate Weights | Use Gaussian distribution to determine weights |
| Compute Weighted Sum | Multiply each price by its weight and sum up |
| Normalize | Divide the weighted sum by the sum of weights |
| Repeat | Perform for each period to plot ALMA |
Optimal Values for Setup in Different Timeframes
Setting up the ALMA (Arnaud Legoux Moving Average) Indicator with optimal values is crucial for its effectiveness in different trading timeframes. These settings can vary depending on the trading style (scalping, day trading, swing trading, or position trading) and the specific market conditions.
Timeframe Considerations
Short-Term (Scalping, Day Trading):
- Window Size (N): Smaller window sizes (e.g., 5-20 periods) provide faster signals and greater sensitivity to price movements.
- Offset (m): A higher offset (closer to 1) can be used to reduce lag, important in fast-paced markets.
Medium-Term (Swing Trading):
- Window Size (N): Moderate window sizes (e.g., 21-50 periods) strike a balance between sensitivity and smoothing.
- Offset (m): A moderate offset (around 0.5) helps maintain a balance between lag reduction and signal reliability.
Long-Term (Position Trading):
- Window Size (N): Larger window sizes (e.g., 50-100 periods) smooth out short-term fluctuations, focusing on long-term trends.
- Offset (m): A lower offset (closer to 0) is often suitable, as immediate market changes are less critical.
Standard Deviation (σ)
- The standard deviation (usually set to 6) remains constant across different timeframes. It determines the width of the Gaussian curve, impacting the weights assigned to prices.
Customization Tips
- Market Volatility: In highly volatile markets, a slightly larger window size can help filter out noise.
- Market Conditions: Adjust the offset to suit prevailing market conditions; a higher offset in trend phases and a lower one in ranging markets.
- Trial and Error: Experimentation with different settings in a demo account is advised to find the most suitable parameters for individual trading strategies.
| Timeframe | Window Size (N) | Offset (m) | Notes |
|---|---|---|---|
| Short-Term | 5-20 | Closer to 1 | Suitable for fast-paced, short-term trades |
| Medium-Term | 21-50 | Around 0.5 | Balances sensitivity and smoothing |
| Long-Term | 50-100 | Closer to 0 | Focuses on long-term trends, less sensitive to short-term changes |
Interpretation of the ALMA Indicator
Proper interpretation of the Arnaud Legoux Moving Average (ALMA) is crucial for traders to make informed decisions. This section explains how to read and use the ALMA in trading scenarios.
Trend Identification
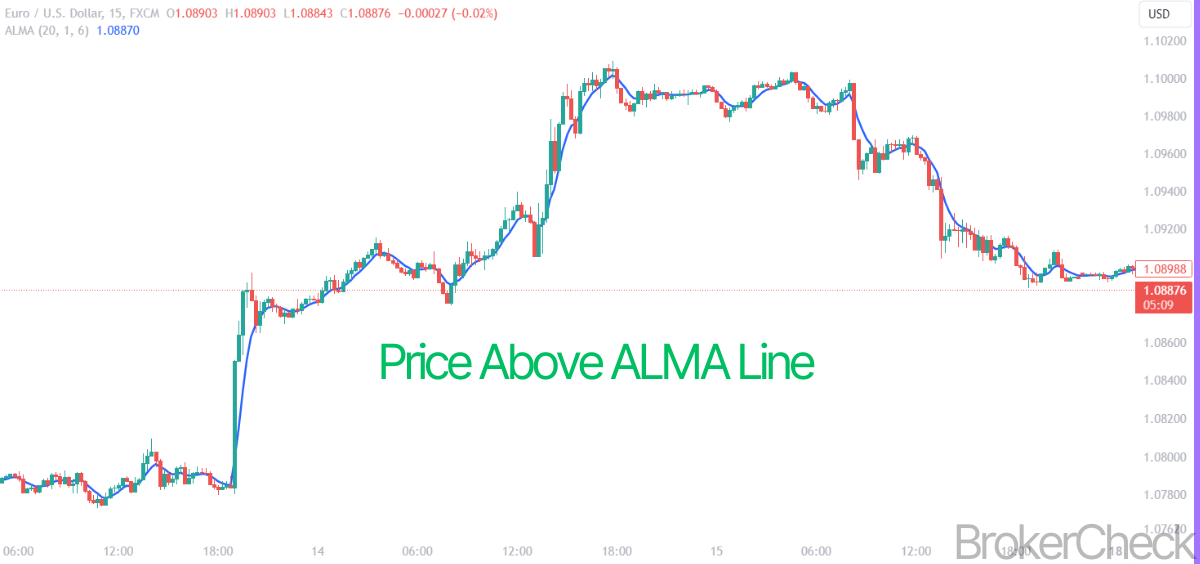
- Uptrend Signal: When the ALMA line moves upward or the price is consistently above the ALMA line, it is generally considered an uptrend signal, suggesting bullish market conditions.
- Downtrend Signal: Conversely, a downward moving ALMA or price action below the ALMA line indicates a downtrend, pointing to bearish conditions.
Price Reversal
- Reversal Indication: A crossover of the price and the ALMA line can signal a potential reversal. For instance, if the price crosses above the ALMA line, it might indicate a shift from a downtrend to an uptrend.
Support and Resistance
- The ALMA line can act as a dynamic support or resistance level. In an uptrend, the ALMA line may serve as support, while in a downtrend, it can act as resistance.
Momentum Analysis
- By observing the angle and separation of the ALMA line, traders can gauge market momentum. A steeper angle and increasing distance from the price may indicate strong momentum.
| Signal Type | Description |
|---|---|
| Uptrend | ALMA moving upward or price above ALMA line |
| Downtrend | ALMA moving downward or price below ALMA line |
| Price Reversal | Crossover of price and ALMA line |
| Support/Resistance | ALMA line acts as dynamic support or resistance |
| Momentum | Angle and separation of ALMA line indicate market momentum |
Combining ALMA with Other Indicators
Integrating the Arnaud Legoux Moving Average (ALMA) with other technical indicators can enhance trading strategies by providing more robust signals and reducing false positives. This section explores effective combinations of ALMA with other popular indicators.
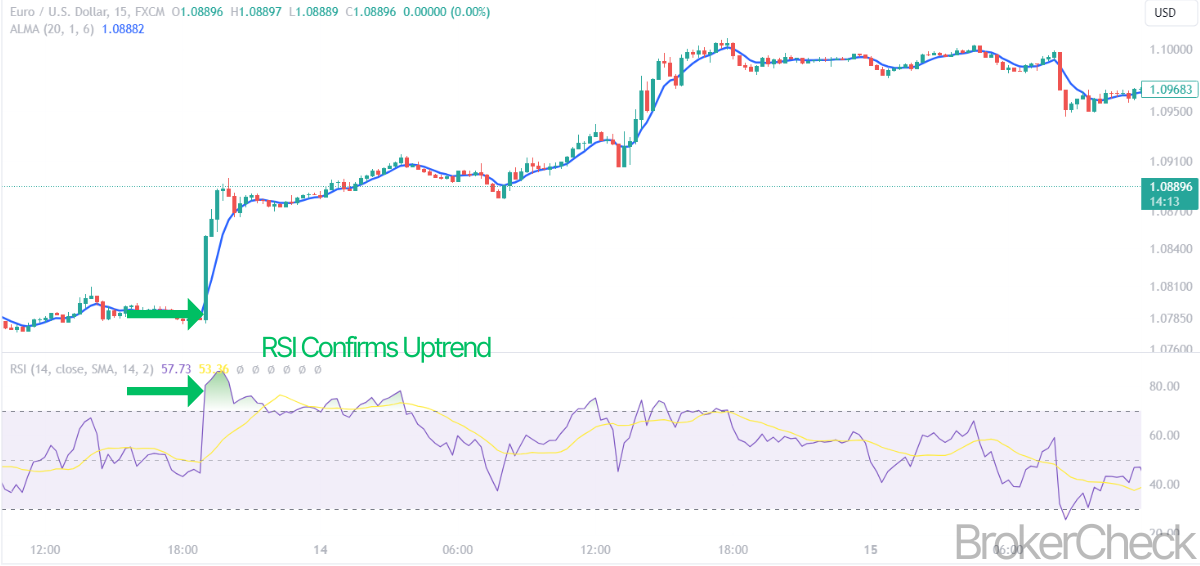
ALMA and RSI (Relative Strength Index)
Combination Overview: RSI is a momentum oscillator that measures the speed and change of price movements. When combined with ALMA, traders can identify trend direction with ALMA and use RSI to gauge overbought or oversold conditions.
Trading Signals:
- A buy signal can be considered when the ALMA indicates an uptrend, and the RSI moves out of the oversold territory (>30).
- Conversely, a sell signal might be suggested when the ALMA shows a downtrend and the RSI exits the overbought zone (<70).
ALMA and MACD (Moving Average Convergence Divergence)
Combination Overview: MACD is a trend-following momentum indicator. Pairing it with ALMA allows traders to confirm trends (ALMA) and identify potential reversals or momentum shifts (MACD).
Trading Signals:
- Bullish signals occur when the ALMA is in an uptrend, and the MACD line crosses above the signal line.
- Bearish signals are identified when the ALMA is in a downtrend, and the MACD line crosses below the signal line.
ALMA and Bollinger Bands
Combination Overview: Bollinger Bands are a volatility indicator. Combining them with ALMA offers insights into trend strength (ALMA) and market volatility (Bollinger Bands).
Trading Signals:
- A narrowing of Bollinger Bands during a trend indicated by ALMA suggests a continuation of the trend.
- A breakout from the Bollinger Bands concurrent with ALMA trend signals can indicate a strong move in the direction of the breakout.
| Indicator Combination | Purpose | Trading Signal |
|---|---|---|
| ALMA + RSI | Trend Direction and Momentum | Buy: Uptrend with RSI >30; Sell: Downtrend with RSI <70 |
| ALMA + MACD | Trend Confirmation and Reversal | Bullish: ALMA Up & MACD Cross Up; Bearish: ALMA Down & MACD Cross Down |
| ALMA + Bollinger Bands | Trend Strength and Volatility | Continuation or breakout signals based on band movement and ALMA trend |
Risk Management with the ALMA Indicator
Effective risk management is crucial in trading, and the Arnaud Legoux Moving Average (ALMA) can be a valuable tool in this regard. This section discusses strategies for using ALMA to manage trading risks.
Setting Stop-Loss and Take-Profit
Stop-Loss Orders:
- Traders can place stop-loss orders below the ALMA line in an uptrend or above it in a downtrend. This strategy helps minimize potential losses if the market moves against the trade.
- The distance from the ALMA line can be adjusted based on the trader’s risk tolerance and market volatility.
Take-Profit Orders:
- Setting take-profit levels near key ALMA levels or when the ALMA line starts to flatten or reverse can help in securing profits at optimal points.
Position Sizing
Using the ALMA to inform position sizing can help manage risk. For instance, traders might choose smaller positions when the ALMA indicates a weaker trend and larger positions during strong trends.
Diversification
Combining ALMA-based strategies with other trading methods or instruments can spread risk. Diversification helps in mitigating the impact of adverse market movements on the overall portfolio.
ALMA as a Risk Indicator
The angle and curvature of the ALMA line can serve as indicators of market volatility. A steeper ALMA might suggest higher volatility, prompting more conservative trading strategies.
| Risk Management Strategy | Description |
|---|---|
| Stop-Loss and Take-Profit | Set orders around key ALMA levels to manage potential losses and secure profits |
| Position Sizing | Adjust position sizes based on ALMA trend strength |
| Diversification | Use ALMA in combination with other strategies for risk spread |
| ALMA as Risk Indicator | Use ALMA’s angle and curvature to gauge market volatility and adjust strategies accordingly |