1. What is the Advance Decline Ratio?
The Advance Decline Ratio (ADR) is a market breadth indicator used by traders to gauge the overall health of the market. It measures the momentum of the market by comparing the number of stocks that have advanced in price to the number of stocks that have declined.
A high ADR suggests that a greater number of stocks are increasing in price, which may indicate a bullish market sentiment. Conversely, a low ADR implies more stocks are falling than rising, often reflecting bearish sentiment.
2. How is the Advance Decline Ratio Calculated?
The Advance Decline Ratio (ADR) is calculated by dividing the number of advancing stocks by the number of declining stocks on a particular exchange for a given trading day.
ADR = Advancing Stocks / Declining Stocks
For example, on a trading day with 1200 advancing stocks and 800 declining stocks, the ADR would be:
ADR = 1200 / 800 = 1.5
Below is a breakdown of this formula:
2.1. Identifying Advancing and Declining Issues
Determining the number of advancing and declining issues requires a systematic approach. Typically, data providers or stock exchanges offer a daily count of these figures. For accuracy, it’s essential to verify the source and ensure the data reflects the closing prices of stocks after each trading session.
When assessing advancing issues, a stock must have closed higher than its previous closing price to be counted. Conversely, declining issues are those stocks with a closing price lower than the previous day. Stocks that remain unchanged are usually excluded from the calculation.
In practice, the real-time tracking of advancing and declining issues can be facilitated through trading software or financial websites, which may offer live updates. This allows traders to respond promptly to shifts in market sentiment.
Lastly, while the ADR provides a snapshot of market momentum, it’s important to consider the absolute numbers. For instance, a market with a larger number of total issues might produce a more stable ADR compared to a market with fewer issues, where individual stocks can cause significant swings in the ratio.
2.2. Calculating the Ratio
Calculating the Advance Decline Ratio (ADR) involves a simple division of the day’s advancing stocks by the declining stocks. The result, a numerical value, provides traders with a quick reference to the market’s breadth and momentum.
Real-time monitoring is possible through various trading platforms and financial information services that provide live data feeds. This immediate access to information empowers traders to make timely decisions based on current market conditions.
Historical analysis is also a key component of utilizing the ADR. By examining past data, traders can identify patterns or trends in market sentiment. A persistent increase or decrease in the ADR can signal long-term market trends.
Volatility in the market can affect the ADR’s reliability; hence, some traders apply a moving average to the ratio to mitigate the effects of short-term price fluctuations. By doing so, the ADR becomes a smoother indicator, better suited for identifying overarching market trends rather than daily market noise.
3. How do You Interpret the Advance Decline ratio?
Interpreting the Advance Decline Ratio (ADR) hinges on recognizing its implications for market trends and potential reversal signals. The ADR is not an absolute indicator but rather a tool to corroborate other market analyses. This is how you can interpret the ADR:
3.1. Analyzing Market Trends
Analyzing market trends with the Advance Decline Ratio (ADR) provides traders with insights into the breadth and depth of market movements. The ADR’s fluctuations offer a glimpse into the underlying strength or weakness of the market beyond what headline indices might suggest.
- A consistent upward movement in the ADR can reflect a robust bullish trend, with a majority of stocks contributing to the rally. This broad participation often bolsters trader confidence in the sustainability of the upward trend.
- Conversely, a downward trajectory in the ADR may reveal underlying market weakness, even if the headline indices have not yet fully reflected this sentiment.
Moving averages applied to the ADR can help smooth out short-term noise, offering a clearer view of the market’s direction. A moving average that trends upwards over time supports the notion of a strong, bullish market, whereas a downtrend in the moving average could indicate bearish conditions.
| Trend Analysis Using ADR | Interpretation |
| Upward Movement in ADR | Potential bullish market trend |
| Downward Movement in ADR | Possible bearish market trend or impending reversal |
| Breadth Expansion (Rising ADR) | Increasing buying interest; bullish signal |
| Breadth Contraction (Falling ADR) | Mounting selling pressure; bearish signal |
| Divergence (Market Up, ADR Down) | Fewer stocks driving the market; a possible trend reversal |
| Moving Average of ADR Trending Up | Strong bullish market conditions |
| Moving Average of ADR Trending Down | Indication of bearish market conditions |
3.2. Detecting Bullish and Bearish Signals
Detecting bullish and bearish signals through the Advance Decline Ratio (ADR) involves observing the ratio’s movement over time and identifying key thresholds that may indicate shifts in market sentiment.
- Bullish signals are typically associated with an ADR trending above 1, indicating that the number of advancing stocks outpaces the declining ones.
- Conversely, bearish signals emerge when the ADR trends below 1, suggesting that decliners are overtaking advancers.
Key Bullish Indicators:
- Sustained ADR values above 1, particularly when combined with increasing market indices.
- ADR is moving average on an upward trajectory, smoothing out daily fluctuations and highlighting a bullish trend.
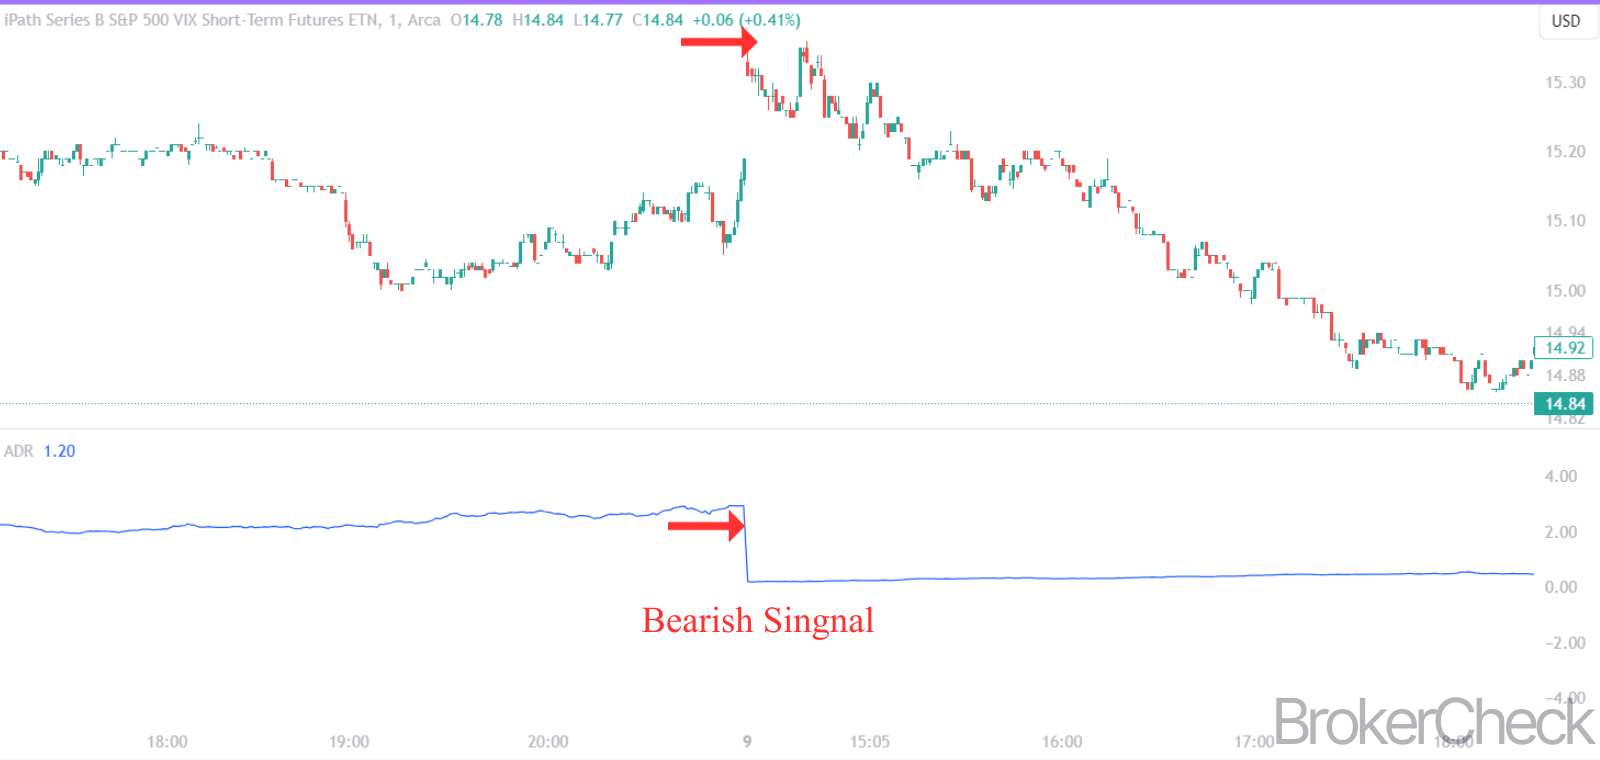
Key Bearish Indicators:
- ADR is consistently below 1, hinting at a dominance of declining stocks over advancing ones.
- Downward trending ADR moving average, which may signal growing bearish sentiment.
| Signal Type | ADR Trend | ADR Value | ADR Moving Average |
| Bullish | Upward | > 1 | Rising |
| Bearish | Downward | < 1 | Falling |
Traders also watch for divergences between the ADR and market indices. A bullish divergence occurs when the ADR rises while the market index is flat or falling, possibly foreshadowing a market turnaround. A bearish divergence transpires when the market index rises, but the ADR falls, which could signal an upcoming market peak or reversal.
| Divergence Type | Market Index | ADR Movement | Potential Signal |
| Bullish | Flat/Falling | Rising | Market Turnaround |
| Bearish | Rising | Falling | Market Peak/Reversal |
3.3. Recognizing Divergences
Recognizing divergences with the Advance Decline Ratio (ADR) is a critical technique for traders seeking to anticipate market reversals. A divergence occurs when the ADR and the market index move in opposite directions. This discrepancy can signal that the current trend may be losing momentum, and a reversal could be on the horizon.
Bullish Divergence is identified when the market index is declining or moving sideways, but the ADR is trending upwards. This suggests that despite the overall market stagnation or decline, many stocks are advancing, which could precede a market rally.
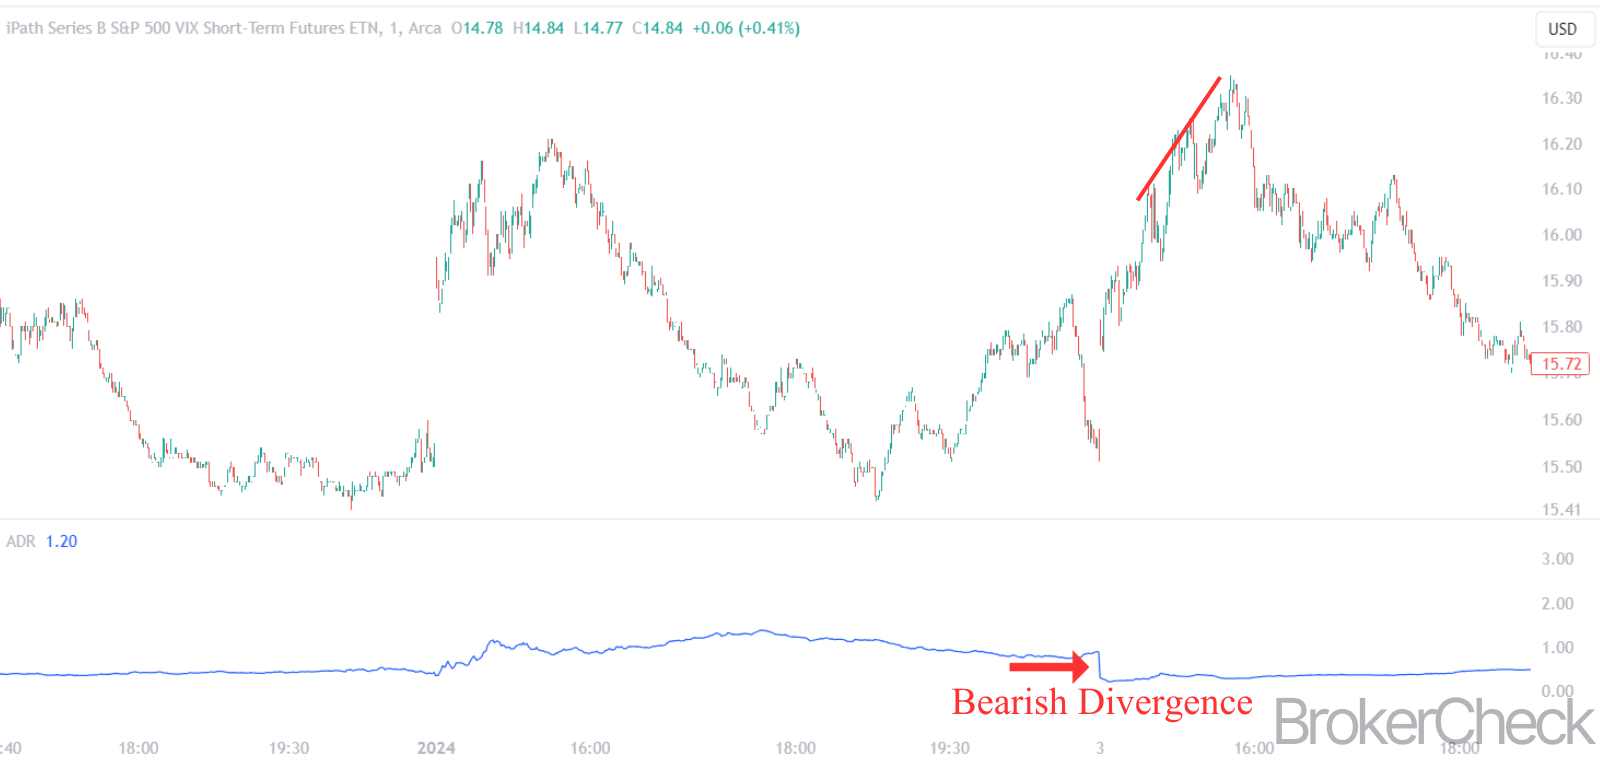
Bearish Divergence is observed when the market index is climbing, but the ADR starts to trend downwards. This indicates that the upward movement of the index is supported by fewer stocks, potentially forewarning a market top or a forthcoming downtrend.
| Market Condition | ADR Trend | Implication |
| Index Declining | Upward | Bullish Divergence |
| Index Rising | Downward | Bearish Divergence |
4. How to Incorporate the Advance Decline Ratio in Trading Strategies?
Incorporating the Advance Decline Ratio (ADR) into trading strategies requires a tactical approach that aligns with other technical analysis tools. The following points elaborate on the incorporation of ADR strategies:
4.1. Integrating with Technical Analysis Tools
Integrating the Advance Decline Ratio (ADR) with technical analysis tools broadens the horizon for traders, enabling a more comprehensive market analysis. By aligning the ADR with other indicators, traders can derive a multifaceted view of market sentiment and dynamics, enhancing the robustness of their trading strategies.
Combining ADR with Other Indicators: Key technical analysis tools to combine with the ADR include oscillators, trend-following indicators, and volatility measures. The ADR, when used with the Relative Strength Index (RSI), can highlight overbought or oversold conditions in the context of market breadth. Similarly, integrating the ADR with the Moving Average Convergence Divergence (MACD) can offer insights into the momentum behind market movements.
Synergy with Oscillators and Trend Lines: Oscillators like the RSI or Stochastic can signal potential reversals that, when confirmed with a corresponding move in the ADR, may validate a trade entry or exit. Trend lines and moving averages can act as dynamic support and resistance levels in conjunction with the ADR to identify sustainable trends.
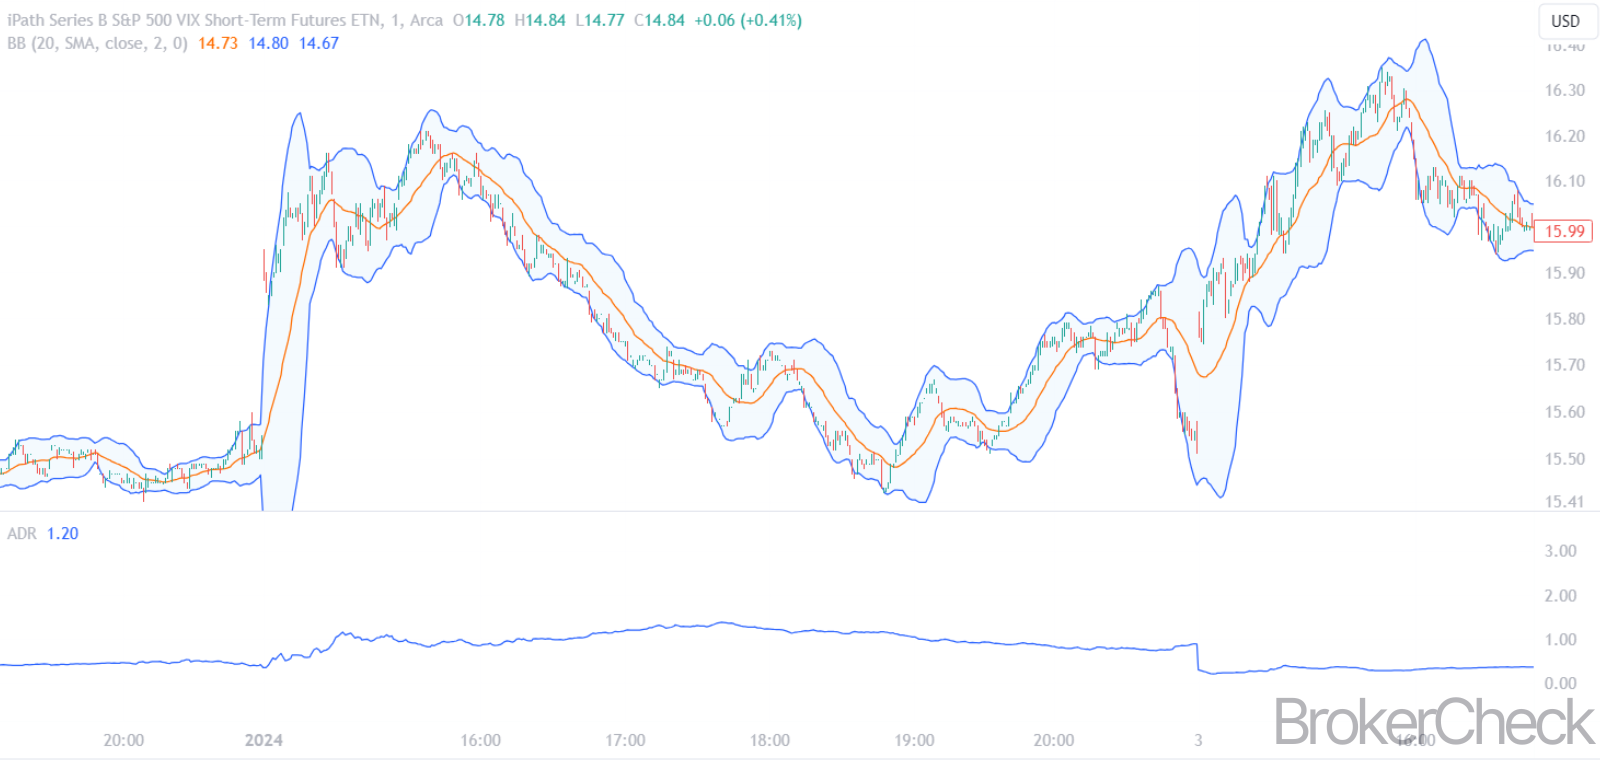
Volatility and ADR: Incorporating volatility indicators such as Bollinger Bands with the ADR can help traders understand the market’s stability. When the ADR indicates a strong trend but the price is at the edge of the Bollinger Bands, it may suggest a pause or pullback is due.
Enhancing Risk Management: The ADR also plays a role in risk management. A trader can use the ADR to gauge the market’s overall risk appetite, adjusting position sizes accordingly. For instance, a low ADR in a generally bullish market could suggest underlying weakness, prompting a more cautious approach.
Strategic Positioning with ADR:
- Confirm Trend Strength: Use the ADR to confirm the strength of a trend indicated by other technical tools.
- Identify Reversal Points: Watch for divergences between the ADR and price to pinpoint potential reversals.
- Optimize Trade Entries and Exits: Enter trades during ADR-supported trends and exit when the ADR signals weakening momentum.
| Technical Tool | ADR Integration | Purpose |
| RSI | Confirm overbought/oversold conditions | Validate trade signals |
| MACD | Assess momentum with ADR trend | Confirm trend continuation or reversal |
| Bollinger Bands | Compare ADR with price volatility | Identify potential pullbacks |
4.2. Timing Entry and Exit Points
Timing entry and exit points with precision are essential for traders looking to maximize their returns and minimize risks. The Advance Decline Ratio (ADR) serves as a critical indicator for determining the overall market sentiment and can significantly aid in this process.
Strategies for Entry and Exit Points:
- Long Entry: Initiate buy positions when the ADR shows a strong upward trend, especially if it is accompanied by an increasing moving average of the ADR. This suggests broad market participation and bullish sentiment.
- Short Entry: Consider short positions when the ADR trends downward, signaling widespread selling pressure and bearish market conditions.
- Exit Strategy: A reversal in the ADR’s direction can be an early sign to close a position. If the ADR trend starts to wane or diverges from the market index, it may indicate a potential shift in market dynamics.
Tactical Use of ADR for Market Timing:
| Market Condition | ADR Trend | Trade Action |
| Bullish Sentiment | Upward | Initiate/hold long |
| Bearish Sentiment | Downward | Initiate/hold short |
| Reversal Indication | Reversing | Exit/close position |
Traders should also consider the context of the ADR within the broader market framework. A rising ADR in a high-volume environment may confirm the strength of the trend, whereas a rising ADR in a low volume could be less convincing and warrant caution.
Volume and ADR Correlation:
| Volume Condition | ADR Movement | Market Implication |
| High Volume | Rising ADR | Strong bullish confirmation |
| Low Volume | Rising ADR | Questionable trend strength |
4.3. Setting Stop-Loss and Take-Profit Levels
Setting stop-loss and take-profit levels is a disciplined approach to risk management and capital preservation in trading. These levels allow traders to specify exit points on a position to lock in profits or cap losses before they become substantial.
Stop-Loss Levels: A stop-loss order is set at a specific price level that, if reached, will trigger the sale of the security to limit potential losses. The ADR can inform the placement of a stop-loss level by observing trend reversals or significant declines in the ratio, which may indicate a shift from bullish to bearish sentiment.
Take-Profit Levels: Conversely, a take-profit order is placed at a price level at which a trader wants to exit a position to realize gains. When the ADR shows a robust upward trend, traders may set take-profit levels to capitalize on the market strength before any reversal occurs.
Strategies for Setting ADR-Informed Stop-Loss and Take-Profit:
| Trade Type | ADR Indicator | Action |
| Long | ADR Declining | Set or adjust stop-loss |
| Long | ADR Rising | Set or adjust take-profit |
| Short | ADR Rising | Set or adjust stop-loss |
| Short | ADR Declining | Set or adjust take-profit |
Adjusting Levels Based on ADR: Traders might consider tightening stop-loss levels if the ADR shows signs of peaking, reflecting a potential downturn. Similarly, take-profit levels might be extended if the ADR indicates a strong, sustained upward trend, suggesting the potential for further gains.
Risk-Reward Ratios: Incorporating the ADR into setting risk-reward parameters can help traders maintain a favorable balance between potential profits and losses. A common risk-reward ratio is 1:2, where for every dollar risked, two dollars are expected in return. The ADR can provide insights into whether the current market conditions support such a ratio.
5. What Are the Limitations of the Advance Decline Ratio?
The Advance Decline Ratio (ADR), while a useful market breadth indicator, has inherent limitations that traders must acknowledge to effectively interpret its signals. Some of the limitations are elaborated below:
5.1. Ratio’s Sensitivity
The sensitivity of the Advance Decline Ratio (ADR) to daily market fluctuations can lead to varying interpretations of market sentiment. As a ratio that compares the number of advancing stocks to declining stocks, the ADR is inherently reactive to the day’s trading activities. This reactivity can amplify the impact of short-term events or trader sentiment, sometimes at the expense of reflecting broader market trends.
Short-term Sensitivity: The ADR can be highly sensitive to short-term market movements. A significant one-day rally or sell-off can skew the ratio, suggesting a stronger trend than may actually exist. This sensitivity necessitates a cautious approach when using the ADR for trading decisions based on a single day’s data.
Impact of Market Openings and Closings: The ADR can also be influenced by the initial trades at the market opening or the final trades before closing, which may not represent the overall trading session’s sentiment. Monitoring the ADR at different times of the day can provide insights into its intraday sensitivity.
ADR Fluctuations: Frequent fluctuations in the ADR can produce noise that obscures the underlying market trend. Traders often look for a consistent pattern over several days to confirm a trend rather than relying on short-term spikes or drops.
Economic Data Releases: Economic news releases can cause immediate reactions in the stock market, reflected in sharp movements in the ADR. While these reactions may be significant, they may not indicate a lasting trend, and the ADR’s sensitivity to these events requires careful analysis.
Intraday ADR Data: For traders who operate on an intraday basis, the ADR’s sensitivity can be both an advantage and a challenge. Rapid changes in the ratio can provide early signals of shifts in market sentiment but may also lead to premature or erroneous trading decisions if not corroborated by other indicators.
| Time of Day | ADR Sensitivity | Consideration |
| Market Open | High | May reflect overnight news or pre-market sentiment |
| Midday | Variable | Can be influenced by intraday news or trader positioning |
| Market Close | High | May be affected by end-of-day trading strategies or positioning |
5.2. Considering the Impact of Market Capitalization
Market capitalization, often referred to as market cap, is a critical element that traders must consider when assessing the impact of the Advance Decline Ratio (ADR). Market cap refers to the total value of a company’s outstanding shares and is calculated by multiplying the current market price of one share by the total number of outstanding shares.
Significance of Market Cap in ADR Analysis: The ADR does not account for the size of the companies in its calculation, treating each advancing and declining issue equally. This can lead to a skewed perception of market sentiment if a small number of large-cap stocks move differently than the broader market.
Large-Cap Stocks Versus Small-Cap Stocks: Large-cap stocks, typically with market caps over $10 billion, can have a disproportionate impact on market indices compared to small-cap stocks, which have market caps ranging from $300 million to $2 billion. Movements in large-cap stocks can drive index performance, potentially masking divergent trends in smaller companies.
Market Cap and ADR Discrepancies: A situation where large-cap stocks are rallying while small-cap stocks are declining might result in a flat or slightly positive ADR, failing to reveal underlying market weaknesses. Conversely, a broad advance in small-cap stocks with a few large-caps declining could show a robust ADR, overestimating the strength of market sentiment.
Strategies to Address Market Cap Impact:
- Weighted ADR Analysis: Traders may consider using a weighted version of the ADR that accounts for market cap, providing a more nuanced view of market movements.
- Sector-Specific ADRs: Analyzing ADRs within specific sectors can help isolate the impact of large-cap stocks within those industries.
- Complementary Indicators: Utilizing other market breadth indicators that consider market cap, such as the Market Cap Weighted Index, can complement the insights provided by the ADR.
Market Cap Impact on ADR Interpretation:
| Market Cap Size | Potential ADR Impact | Interpretation Strategy |
| Large-Cap | Can dominate ADR | Use weighted analysis or sector-specific ADRs |
| Small-Cap | May be overshadowed | Consider broader market trends and complementary indicators |
5.3. Recognizing the Influence of Market Conditions
Recognizing the influence of market conditions on the Advance Decline Ratio (ADR) is essential for traders who seek to gauge market sentiment accurately. The ADR is affected by various market conditions, which can alter its signals and the subsequent trading decisions based on those signals.
Market Types and ADR Response:
- Bull Markets: Bullish conditions may inflate the ADR as more stocks tend to close higher. However, during extended bull markets, the ADR may plateau or decline as fewer stocks participate in the rally, potentially signaling an upcoming correction.
- Bear Markets: In bearish conditions, the ADR often trends lower. A persistently low ADR indicates widespread selling, but a divergence where the ADR starts to rise could signal a bottoming process and a possible reversal.
- Sideways Markets: During periods of sideways or range-bound markets, the ADR may fluctuate without a clear trend, making it less reliable as a directional indicator.
Market Volatility and ADR:
| Volatility Level | ADR Interpretation | Trading Implication |
| High Volatility | May cause erratic ADR movements | Use caution, confirm with other indicators |
| Low Volatility | ADR trends may be more stable | Higher confidence in ADR signals |
Economic Cycles and ADR:
Economic expansions and contractions can also influence the ADR. During expansions, broad market participation can lead to a generally rising ADR. Conversely, economic downturns often result in widespread declines, which are reflected in a falling ADR.
Sector Rotation:
Sector rotation, where capital moves from one industry to another, can impact the ADR. A rally in a specific sector may not be sufficient to move the ADR significantly if other sectors are not participating. Analyzing sector-specific advance-decline data can provide deeper insights.
Global Events:
Global events, such as geopolitical tensions or international economic developments, can cause sudden shifts in market sentiment, impacting the ADR. Traders must stay attuned to such events and interpret the ADR within this broader context.
Market Liquidity:
Market liquidity, or the ease with which assets can be bought or sold, also affects the ADR. In highly liquid markets, the ADR may respond more smoothly to changes in sentiment. In contrast, in less liquid markets, the ADR may exhibit more abrupt changes.