


1. Introduction to the Relative Vigor Index (RVI)
The Relative Vigor Index (RVI) is a financial indicator used in technical analysis that measures the strength of a trend by comparing the closing price to the price range of a given period. The premise behind the RVI is rooted in the observation that prices tend to close higher than they open in uptrends and close lower than they open in downtrends.
The RVI is a momentum oscillator that oscillates around a central zero line. It is constructed by taking the ratio of the ‘vigor,’ or the difference between the closing and opening prices, to the range of prices within a certain period. The rationale is that in a strong uptrend, the closing price is typically higher than the opening price, reflecting the “vigor” of buyers. Conversely, in a strong downtrend, the closing price is often below the opening price, indicating the “vigor” of sellers.
1.1 Origin and Purpose
Developed with the intent to identify the strength of a trend, the RVI differs from other momentum indicators by focusing on the relationship between the closing price and the opening price, rather than the closing prices alone. This unique approach allows traders to gauge the enthusiasm of buyers or sellers within the market, providing insights into the potential continuation or reversal of current trends.
The RVI is particularly favored for its ability to signal potential reversals through divergence; that is, when the indicator and price action move in opposite directions. This aspect of the RVI makes it a valuable tool for traders looking to capitalize on early signs of trend exhaustion and potential shifts in market direction.
| Feature | Description |
|---|---|
| Type | Momentum Oscillator |
| Purpose | Measures the strength of a trend by comparing the closing price to the price range |
| Calculation | Ratio of the difference between closing and opening prices to the range of prices |
| Ideal Use | Identifying trend strength, potential reversals through divergence |
| Timeframes | Applicable across short-term, medium-term, and long-term trading strategies |
| Combination with Other Indicators | Often used with Moving Averages, MACD, and Stochastic Oscillator for enhanced signal accuracy |
| Advantages | Focuses on the opening and closing prices for trend strength, useful for spotting reversals |
| Limitations | May produce false signals in sideways or choppy market conditions |
2. Calculation of the RVI
The calculation of the Relative Vigor Index (RVI) involves several steps that are designed to highlight the trend’s vigor by comparing the closing price relative to the opening price over a selected period. The RVI’s formula is more complex than that of many other technical indicators, incorporating both a numerator and a denominator to normalize the vigor measure.
2.1 Formula Explanation
The RVI is calculated using the following formula:
RVI = SMA (Close – Open, n) / SMA (High – Low, n)
where:
- SMA refers to the Simple Moving Average.
- Close is the closing price of the period.
- Open is the opening price of the period.
- High is the highest price of the period.
- Low is the lowest price of the period.
- n is the number of periods used for the SMA calculation, typically set to 10.
2.2 Step-by-Step Calculation Process
- Calculate the Difference Between Close and Open Prices: For each period in your dataset, calculate the difference between the closing and opening prices. This figure represents the “vigor” of the market for that period.
- Calculate the Range (High – Low): For the same periods, calculate the range by subtracting the low from the high price. This step measures the volatility or the price movement extent within the period.
- Compute the Simple Moving Average (SMA) for Both Sets of Data: Apply the SMA to both the vigor (Close – Open) and the range (High – Low) calculations over n periods. The choice of n can vary, but a common practice is to use 10 periods to smooth out short-term fluctuations while still capturing the essence of the market’s movement.
- Divide the SMA of Vigor by the SMA of Range: The final step involves dividing the SMA of the vigor by the SMA of the range. This calculation normalizes the vigor in relation to the price movement extent, producing the RVI value.
The RVI’s design allows it to capture the market’s enthusiasm by focusing on the relationship between opening and closing prices, as opposed to simply looking at closing prices like many other oscillators. This calculation process, although slightly more complex, provides a nuanced view of market dynamics, making the RVI a valuable tool for assessing the strength and sustainability of trends.
The computation of the RVI highlights its unique approach to measuring market momentum, distinguishing it from other indicators by emphasizing the importance of opening and closing prices within a given period. By understanding and applying the RVI’s calculation method, traders can enhance their analysis of market trends and better predict potential reversals or continuations in price movements.
3. Optimal Values for Setup in Different Timeframes
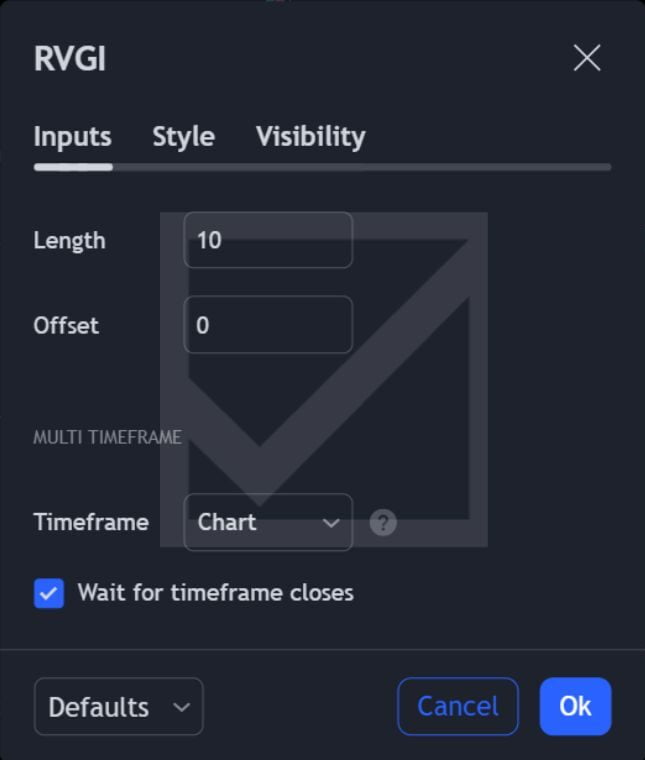
The Relative Vigor Index (RVI) can be adjusted to suit various trading strategies and timeframes. By tweaking its parameters, traders can optimize the RVI’s responsiveness and accuracy for short-term, medium-term, and long-term analysis. Understanding how to adjust the RVI settings for different trading scenarios is crucial for maximizing its effectiveness.
3.1 Short-Term Trading
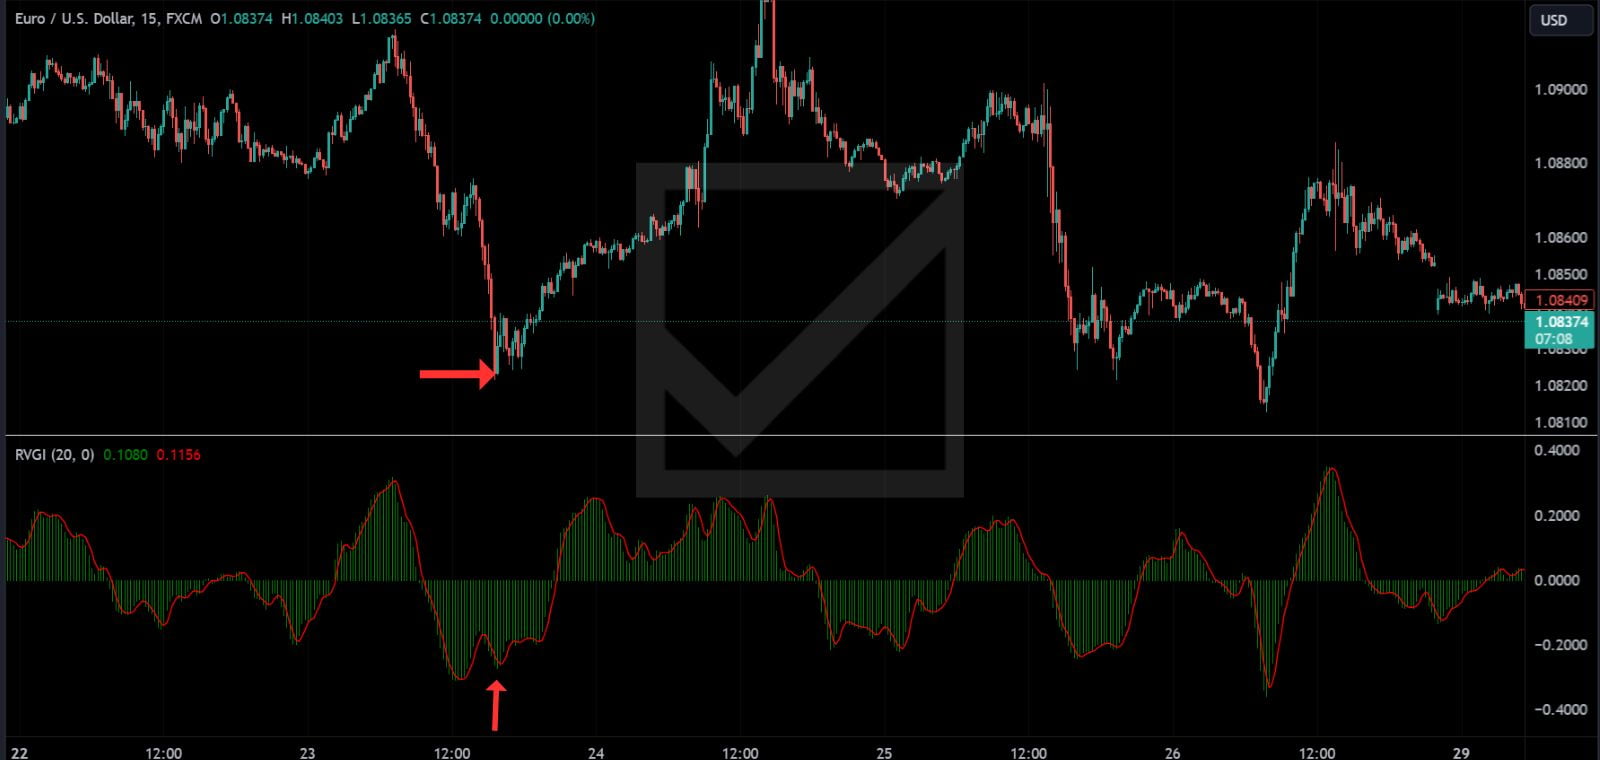
For traders focusing on short-term strategies, such as day trading or scalping, a lower period setting for the RVI can provide more sensitivity to immediate price movements. Reducing the number of periods (n) in the RVI calculation makes the indicator more responsive to recent price changes, which is critical for capturing quick profit opportunities in fast-moving markets.
- Optimal Value: A period setting of 4 to 7 is often recommended for short-term trading. This range offers a balance between sensitivity to price action and filtering out market noise.
3.2 Medium-Term Trading
Medium-term traders, including swing traders who hold positions for several days to a few weeks, require a balance between sensitivity and the ability to filter out short-term volatility. A moderate period setting for the RVI can help identify more sustainable trend changes without reacting too quickly to minor price fluctuations.
- Optimal Value: A period setting of 10 to 14 provides a good balance for medium-term trading. This setup helps in identifying significant trend shifts while avoiding false signals common in highly volatile or choppy market conditions.
3.3 Long-Term Trading
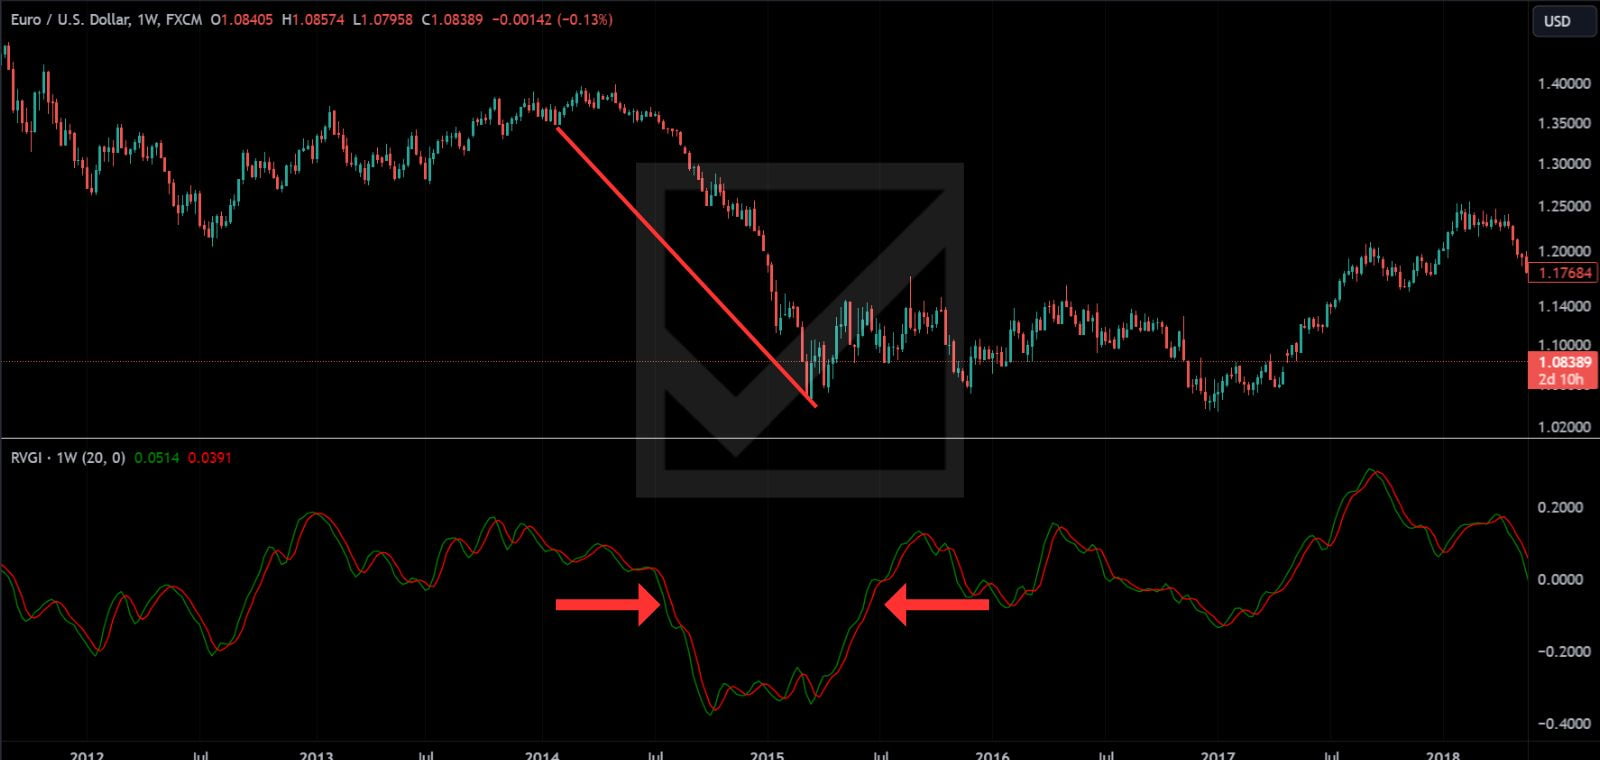
Long-term traders or investors, who hold positions for several weeks to months, benefit from a less sensitive RVI that focuses on overarching trends rather than short-term movements. A higher period setting smooths out the RVI curve, reducing the impact of short-term volatility and highlighting long-term momentum and trend shifts.
- Optimal Value: For long-term trading, a period setting of 14 to 20 is typically used. This range is less reactive to short-term market movements, allowing traders to focus on more significant trends that align with their investment horizon.
| Trading Style | Optimal RVI Period | Key Benefit |
|---|---|---|
| Short-Term Trading | 4 to 7 | Increased sensitivity to immediate price movements, beneficial for day trading and scalping. |
| Medium-Term Trading | 10 to 14 | Balanced responsiveness, suitable for swing trading and capturing medium-term trends. |
| Long-Term Trading | 14 to 20 | Focus on long-term trends, ideal for long-term investment strategies. |
Adjusting the RVI settings according to the trading timeframe is crucial for aligning the indicator’s sensitivity with the trader’s strategy. Whether focusing on rapid day trading or long-term investing, setting the RVI to the optimal period values enhances its utility and effectiveness in trend analysis. By carefully selecting the RVI settings, traders can better navigate different market conditions, improve their trading decisions, and increase their chances of success.
4. Interpretation of the RVI
The Relative Vigor Index (RVI) provides insights into the strength of a trend by comparing the closing price to the opening price within a given timeframe. Its interpretation is key to identifying potential reversals, continuations, and the overall momentum in the market. Here’s how to interpret the RVI in trading scenarios.
4.1 Reading RVI Values
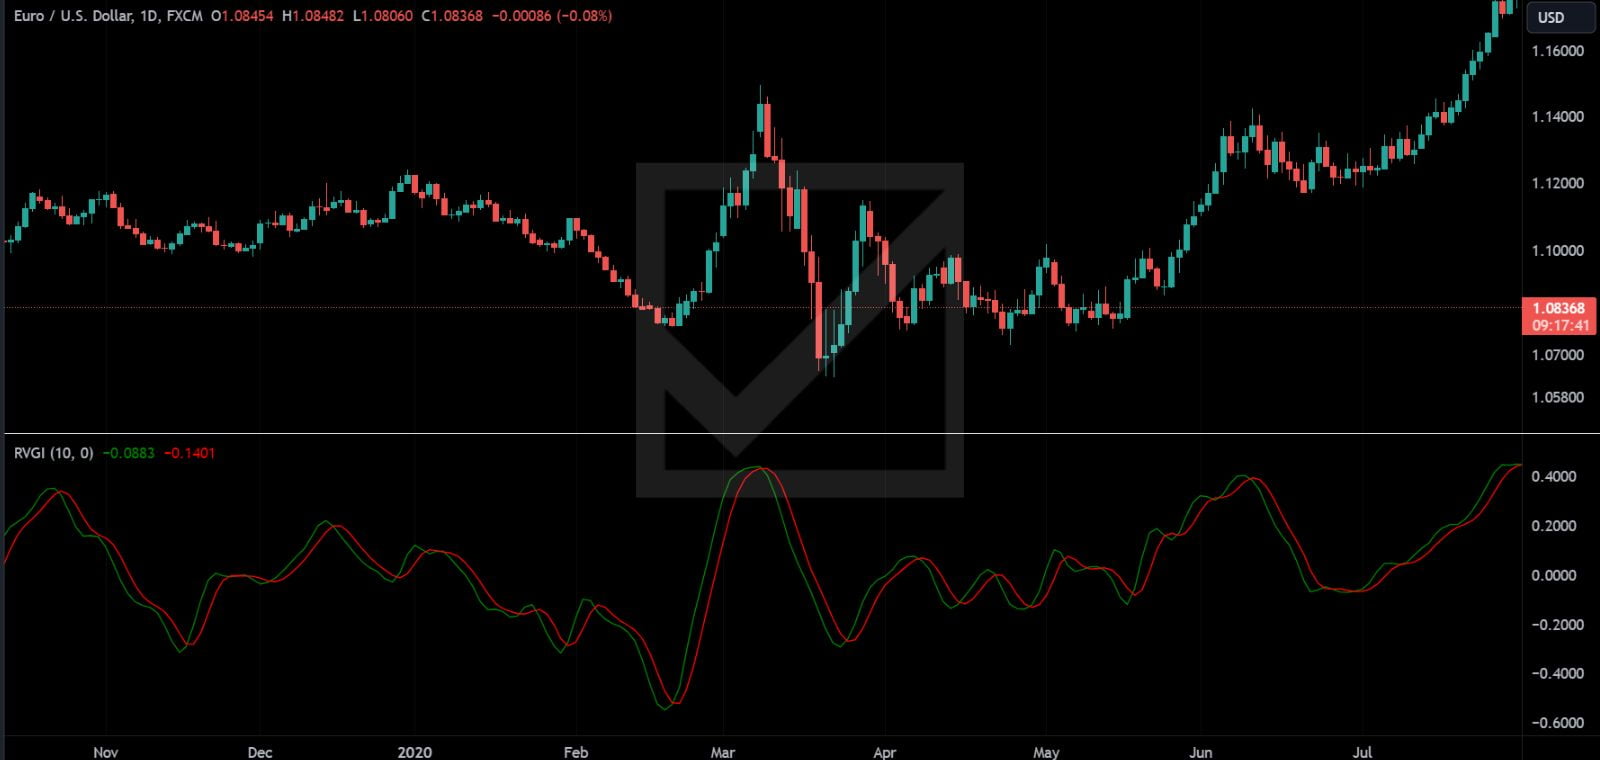
The RVI oscillates around a central zero line, with its value indicating the direction and strength of a trend.
- Above Zero: When the RVI is above zero, it suggests bullish momentum, indicating that the closing prices are generally higher than the opening prices over the selected period. This is seen as a potential buy signal.
- Below Zero: Conversely, when the RVI is below zero, it indicates bearish momentum, suggesting that closing prices are generally lower than the opening prices. This may be considered a sell signal.
4.2 Bullish and Bearish Divergences
Divergences between the RVI and price action are critical signals that can precede reversals.
- Bullish Divergence: Occurs when the price records a lower low, but the RVI forms a higher low. This indicates weakening downward momentum and a potential upward reversal.
- Bearish Divergence: This happens when the price makes a higher high, but the RVI records a lower high. This suggests that upward momentum is losing strength, pointing towards a potential downward reversal.
These divergences are particularly significant as they can signal changes in trend direction before they are reflected in the price, offering traders an opportunity to enter or exit trades ahead of reversals.
| Signal | RVI Position | Market Implication | Action Suggested |
|---|---|---|---|
| Bullish Momentum | Above Zero | Strong upward trend, closing prices are higher than opening prices | Consider buying or holding long positions |
| Bearish Momentum | Below Zero | Strong downward trend, closing prices are lower than opening prices | Consider selling or holding short positions |
| Bullish Divergence | RVI forms a higher low while price forms a lower low | Potential upward trend reversal, weakening bearish momentum | Prepare to buy or close short positions |
| Bearish Divergence | RVI forms a lower high while price forms a higher high | Potential downward trend reversal, weakening bullish momentum | Prepare to sell or close long positions |
Interpreting the RVI involves more than just observing its position relative to the zero line. Traders must also pay attention to divergences between the RVI and price action, as these can provide early warnings of trend reversals. By understanding how to read these signals, traders can make more informed decisions, better manage their risk, and potentially capitalize on market movements before they become apparent to the wider market.
5. Combining RVI with Other Indicators
While the Relative Vigor Index (RVI) is a powerful tool on its own, combining it with other technical indicators can enhance its effectiveness, providing clearer signals and reducing the likelihood of false positives. Here’s how the RVI can be integrated with other popular technical analysis tools.
5.1 RVI and Moving Averages
Moving Averages (MAs) are used to smooth out price data over a specified period, providing a clear view of the trend direction. When combined with the RVI, moving averages can help confirm trend directions and reversals.
- Strategy: Use a moving average to determine the trend direction. When the RVI crosses above zero in an uptrend (indicated by prices above the MA), it can confirm buy signals. Conversely, an RVI cross below zero during a downtrend (prices below the MA) confirms sell signals.
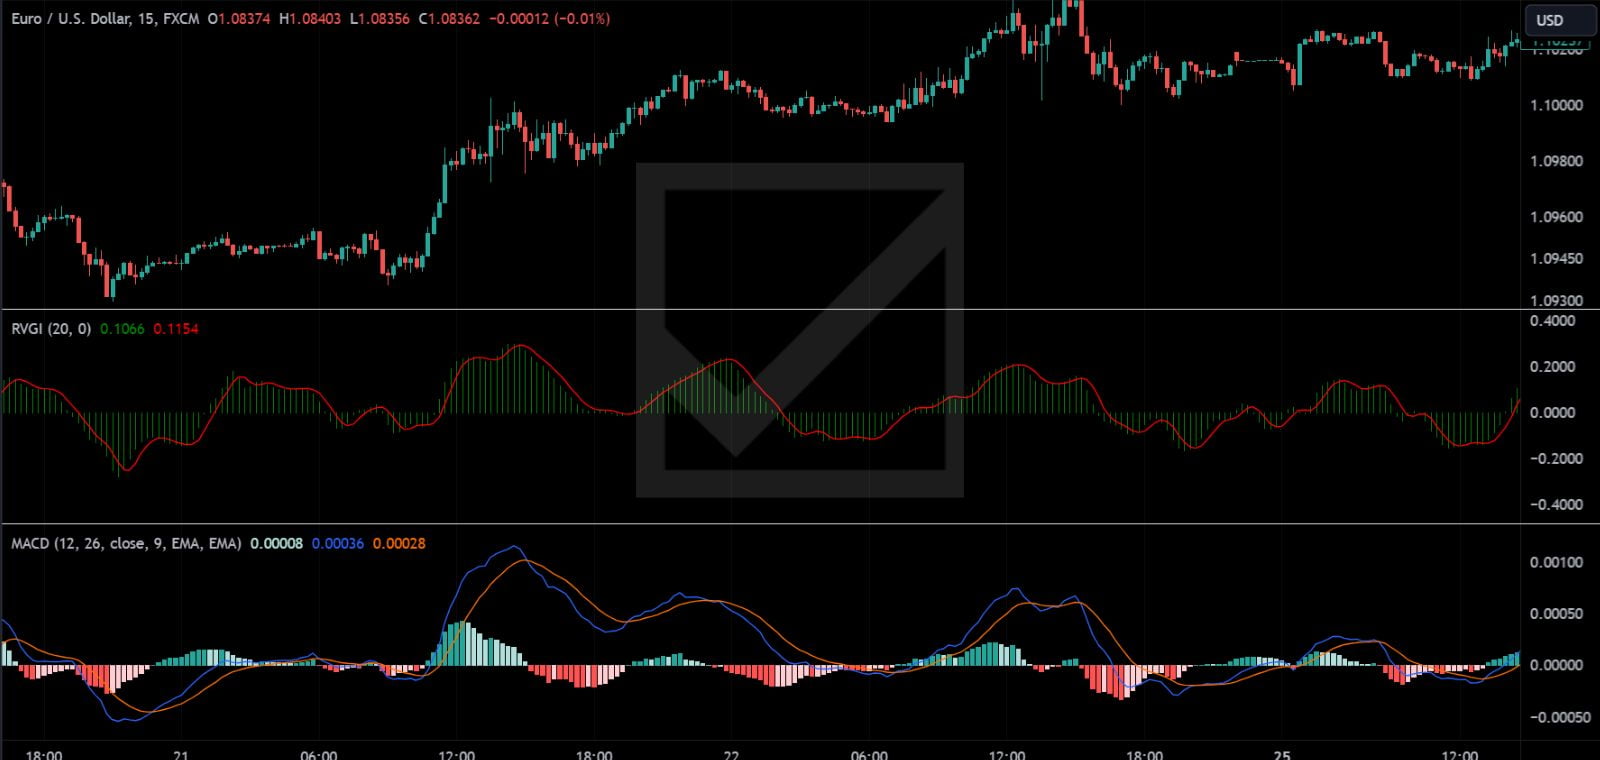
5.2 RVI and MACD
The Moving Average Convergence Divergence (MACD) is another momentum indicator that shows the relationship between two moving averages of a security’s price. Combining the MACD with the RVI allows traders to confirm momentum shifts more accurately.
- Strategy: Look for instances where both the MACD and the RVI cross their respective zero lines in the same direction. Such confluence can reinforce the signal’s reliability, offering a stronger case for entering or exiting a trade.
5.3 RVI and Stochastic Oscillator
The Stochastic Oscillator compares a particular closing price of a security to a range of its prices over a certain period. It’s used to generate overbought and oversold signals. The RVI, when used with the Stochastic Oscillator, can help confirm momentum shifts suggested by overbought or oversold conditions.
- Strategy: Wait for the Stochastic to indicate an overbought or oversold condition (above 80 for overbought and below 20 for oversold). An RVI movement in the opposite direction (falling below zero in overbought conditions or rising above zero in oversold conditions) can signal a potential reversal, providing a trigger for entry or exit.
| Indicator | Strategy | Purpose | Signal Strength |
|---|---|---|---|
| Moving Averages | Confirm RVI signals with trend direction indicated by MA | Trend Confirmation | Enhanced when RVI and price trend (MA) align |
| MACD | Look for simultaneous MACD and RVI zero line crosses | Momentum Confirmation | Stronger when both indicators confirm momentum direction |
| Stochastic Oscillator | Use RVI to confirm Stochastic overbought/oversold reversals | Reversal Confirmation | Increased reliability during overbought/oversold conditions |
6. Risk Management with RVI
Effective risk management is crucial in trading, ensuring that a single loss does not significantly impact the trader’s capital. The Relative Vigor Index (RVI), while primarily a momentum indicator, can also be instrumental in risk management strategies. Here’s how traders can use the RVI to manage risk.
6.1 Setting Stop-Loss Orders
Stop-loss orders are essential for protecting against large losses. The RVI can help in setting more informed stop-loss levels by indicating potential reversal points.
- Strategy: After entering a trade based on an RVI signal, place a stop-loss order just beyond the recent high or low before the RVI signal was generated. For a buy signal, set the stop loss below the recent low. For a sell signal, set it above the recent high. This method uses the RVI’s trend-reversal sensitivity to protect against market reversals.
6.2 Position Sizing
Position sizing determines how much of a security is bought or sold, impacting the trade’s risk level. The RVI can guide position sizing by the strength of the signal it provides.
- Strategy: Adjust the size of the position based on the RVI’s distance from the zero line. A stronger signal (further from the zero line) might warrant a larger position, while a weaker signal (closer to the zero line) suggests a more conservative position size. This approach aligns risk exposure with the confidence level of the signal.
| Risk Management Technique | Strategy with RVI | Purpose | Implementation |
|---|---|---|---|
| Setting Stop-Loss Orders | Place stop-loss orders based on recent highs/lows relative to RVI signals | Protect capital from significant losses | Adjust stop-loss orders following the RVI indication of trend strength or reversal |
| Position Sizing | Adjust position sizes based on the RVI signal strength | Align risk exposure with signal confidence | Increase position sizes for strong signals; reduce for weaker signals |
Using the RVI in risk management allows traders to set more strategic stop-loss orders and adjust position sizes according to the strength of the market’s momentum. This method provides a nuanced approach to managing trading risk, balancing the potential for profit against the imperative of protecting capital. By integrating the RVI into their risk management strategies, traders can make more informed decisions that align with their risk tolerance and trading objectives.
7. Advantages and Limitations of RVI
The Relative Vigor Index (RVI) is a robust indicator within the realm of technical analysis, offering unique insights into market momentum and potential reversals. However, like all technical indicators, it has its set of advantages and limitations. Understanding these can help traders leverage the RVI more effectively in their trading strategies.
7.1 Advantages
- Trend Strength Insight: The RVI excels in measuring the strength of a trend by comparing closing prices to opening prices, providing a clear view of market vigor.
- Early Reversal Signals: Through divergence analysis, the RVI can signal potential trend reversals ahead of the market, giving traders a valuable lead time to adjust their positions.
- Complementarity: The RVI’s unique calculation makes it an excellent complement to other indicators, enhancing overall trading strategy by confirming signals or suggesting caution.
7.2 Limitations
- Lagging Nature: As with many momentum indicators, the RVI is inherently lagging. Its signals are based on past price data, which may not always accurately predict future movements.
- False Signals: In volatile or sideways markets, the RVI can generate false signals, leading to potential misinterpretation of trend strength or reversals.
- Complexity in Interpretation: Understanding and acting on RVI signals, especially divergence, requires experience and a nuanced approach to technical analysis, which might be challenging for beginners.
The RVI is a valuable tool in a trader’s arsenal, offering insights into the market’s momentum and potential shifts in trend direction. However, traders should be aware of its limitations and consider using it alongside other indicators to confirm signals and mitigate risks associated with its lagging nature and potential for false signals. Understanding both the strengths and weaknesses of the RVI can enable traders to employ it more effectively within their market analysis and trading decisions.


