1. What Are the Best Indicators for Forex Trading?
The Forex market is full of numerous indicators. Traders have even made their own individual indicators that they use to manipulate and understand the market. However, it is hard to interpret and work on every indicator to get the best one for your startegies. Therefore, there are some indicators that are quite famous among traders. I have categorized them into 4 classes, as mentioned below:
- Trend Indicators
- Momentum Indicators
- Volatility Indicators
- Volume Indicators
For your understanding, I’ll provide a review guide on these tools. Let’s dive into it.
1.1. Trend indicators
Trend indicators are the tools that show the direction and strength of the prevailing trend in the market. They can help traders identify and follow the trend, as well as spot potential reversals or corrections. Some of the most common trend indicators are:
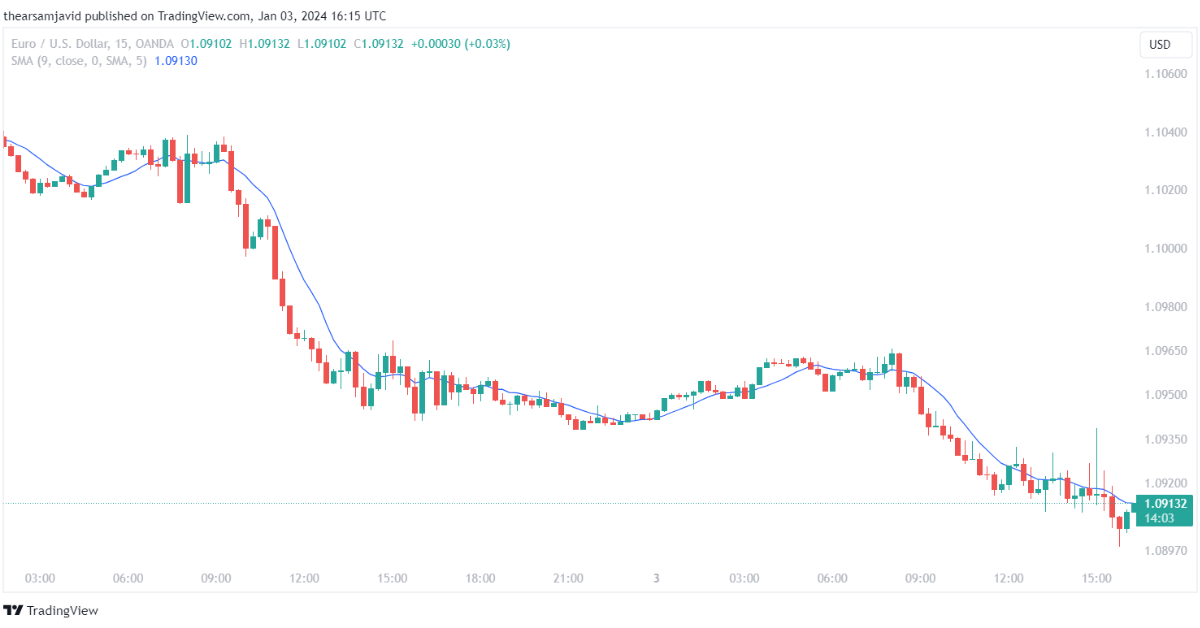
1.1.1. Moving averages (MA)
Moving averages are calculated by taking the average price of a currency pair over a certain period of time. They can be used to smooth out the price fluctuations and show the overall direction of the trend. The most popular types of MA are the simple moving average (SMA) and the exponential moving average (EMA). The SMA gives equal weight to all the prices, while the EMA gives more weight to the recent prices.
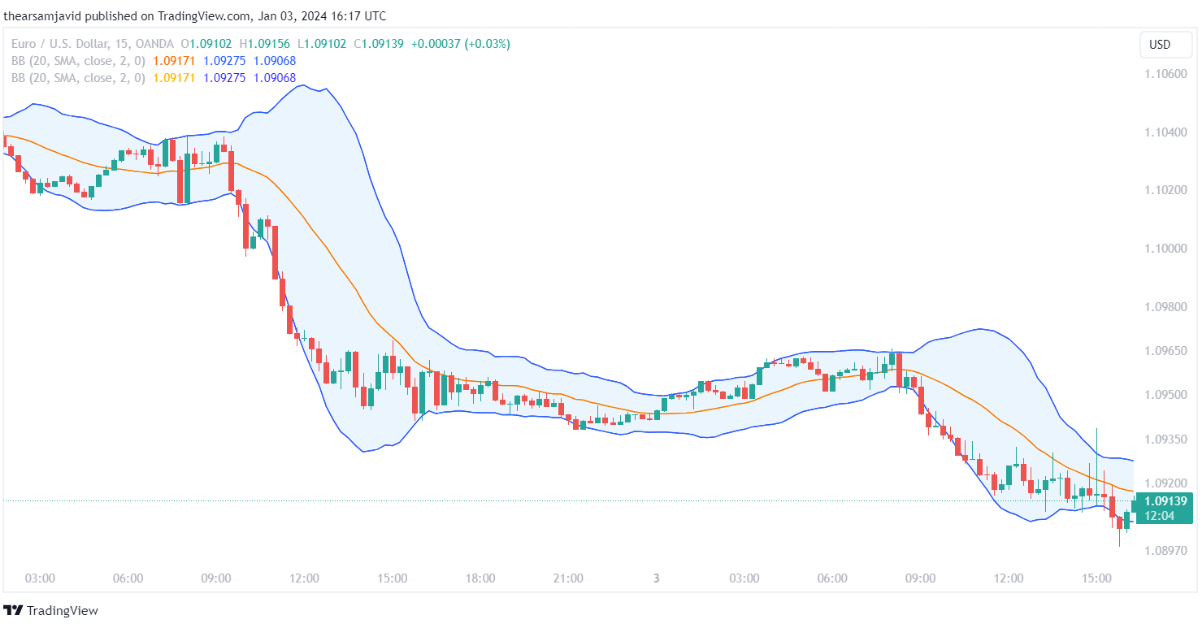
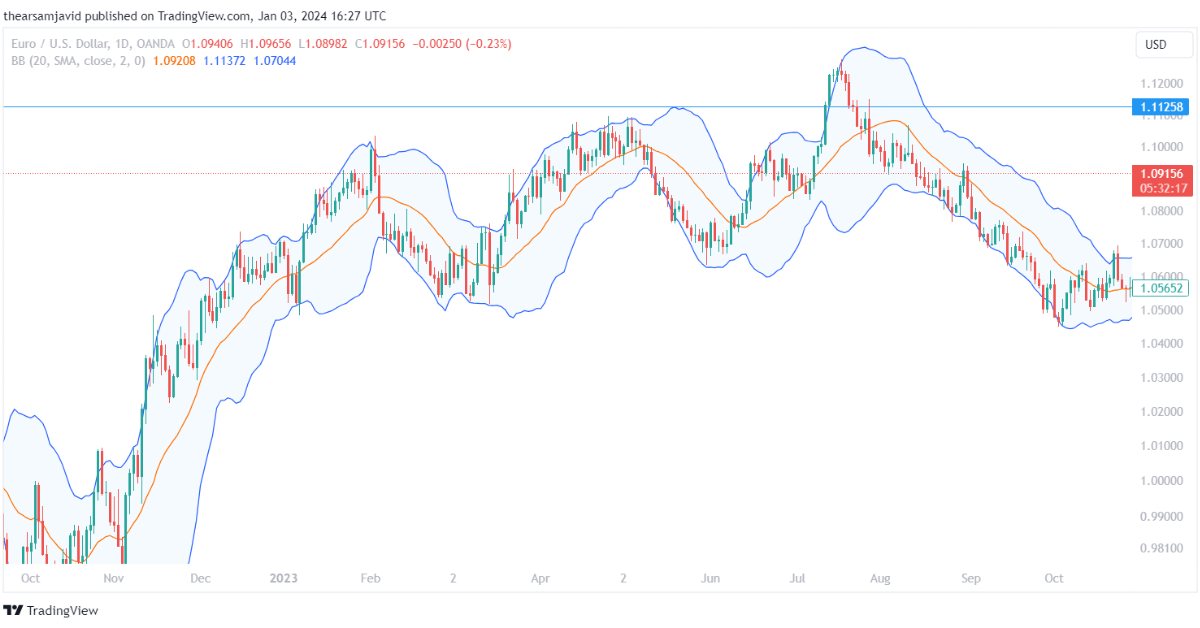
1.1.2. Bollinger Bands (BB)
Bollinger bands are calculated by adding and subtracting a standard deviation from a moving average. They can be used to measure the volatility and the range of the price movements.
Traders can use the Bollinger bands to identify the trend and its strength, as well as the overbought and oversold conditions. For example, a common technique is to use the middle band (the moving average) as a trend indicator and the upper and lower bands as potential reversal points. When the price is above the middle band, it indicates an uptrend, and when the price is below the middle band, it indicates a downtrend.
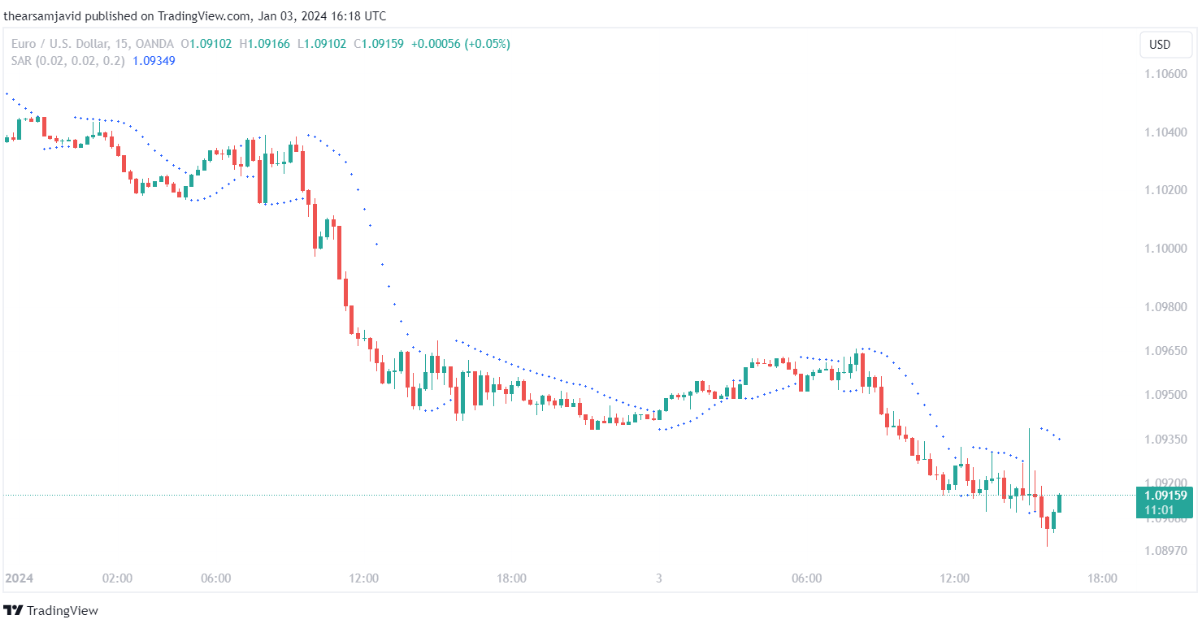
1.1.3. Parabolic SAR (PSAR)
Parabolic SAR is calculated by using a formula that takes into account the price direction, the acceleration factor, and the extreme point. It can be used to identify the trend and its direction, as well as the potential reversal points. The default settings for the Parabolic SAR are a 0.02 acceleration factor and a 0.2 maximum value.
Traders can use the Parabolic SAR to follow the trend and its direction, as well as to set the stop-loss and take-profit levels. For example, a common technique is to use the Parabolic SAR as a trailing stop, which means that the stop-loss level is adjusted according to the Parabolic SAR value. When the Parabolic SAR is above the price, it indicates a downtrend, and the stop-loss level is set at the Parabolic SAR value.
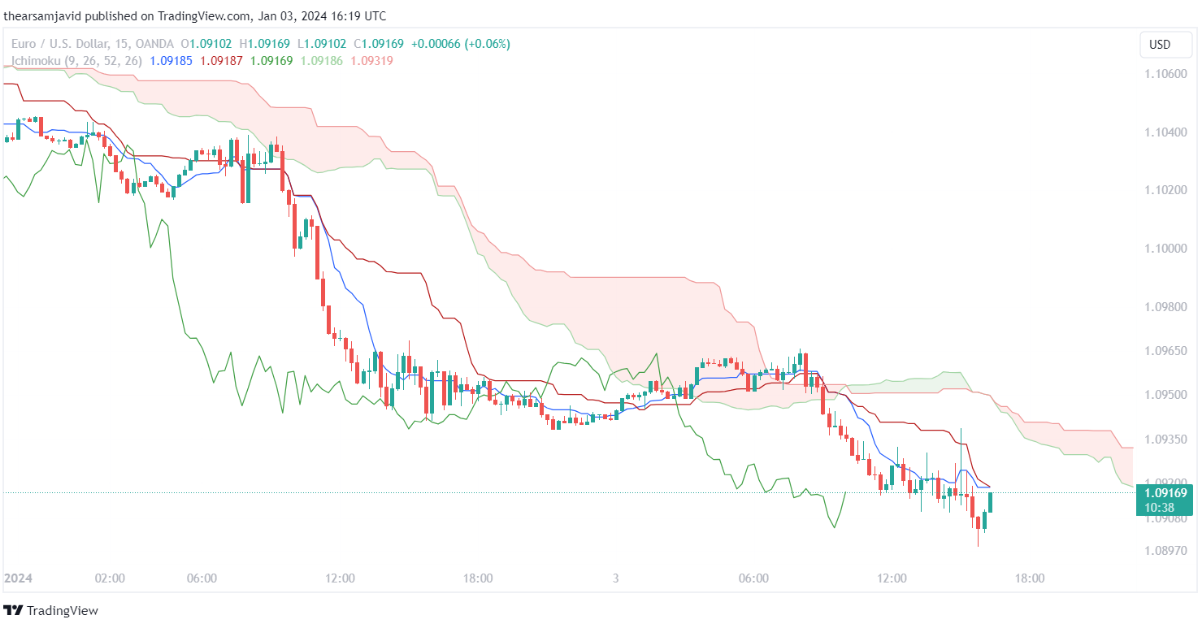
1.1.4. Ichimoku cloud (IC)
Ichimoku cloud is calculated by using five lines that are based on the average of the high and low prices over different periods of time. They can be used to identify the trend and its direction, as well as the support and resistance levels. The five lines are:
- Tenkan-sen: The average of the highest high and the lowest low over the past nine periods. It is also called the conversion line.
- Kijun-sen: The average of the highest high and the lowest low over the past 26 periods. It is also called the baseline.
- Senkou spans A: The average of the Tenkan-sen and the Kijun-sen plotted 26 periods ahead. It is also called the leading span A.
- Senkou span B: The average of the highest and lowest low over the past 52 periods, plotted 26 periods ahead. It is also called the leading span B.
- Chikou span: The closing price of the current period, plotted 26 periods behind. It is also called the lagging span.
The area between the Senkou Span A and the Senkou Span B is called the Ichimoku cloud. The default settings for the Ichimoku cloud are 9, 26, and 52 periods.
Traders can use the Ichimoku cloud to identify the trend and its direction, as well as the support and resistance levels. For example, a common technique is to use the Ichimoku cloud as a trend indicator and the other lines as confirmation signals. When the price is above the cloud, it indicates an uptrend, and when the price is below the cloud, it indicates a downtrend. When the price crosses the cloud, it indicates a potential trend change.
1.1.5. Advantages and Disadvantages of Trend Indicators
The advantages of trend indicators are:
- They can help traders identify and follow the trend, which is one of the most important principles in forex trading strategy.
- They can avoid trading against the trend, which can result in losses and frustration.
- They can help filter out the noise and focus on the main direction of the market.
The disadvantages of trend indicators are:
- They can be lagging, which means that they may not accurately reflect the current market conditions and may give false or late signals.
- They can be subjective, which means that different traders may interpret them differently and may use different settings and parameters.
1.2. Momentum indicators
Momentum indicators are indicators that measure the speed and force of the price movements. They can help traders gauge the strength of the trend, as well as identify overbought and oversold conditions, divergences, and momentum shifts. The examples of the most common momentum indicators are:
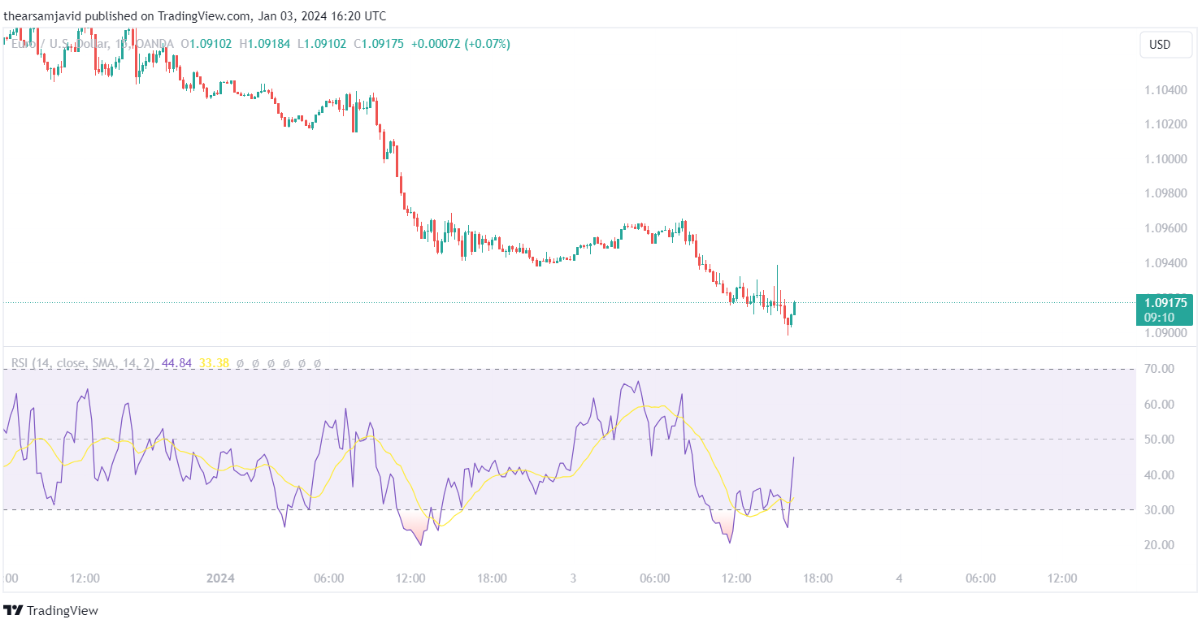
1.2.1. Relative strength index (RSI)
The relative strength index is calculated by using a formula that compares the average gain and the average loss over a certain period of time. It can be used to measure the momentum and the magnitude of the price movements. The RSI ranges from 0 to 100, and it is usually considered overbought when it is above 70 and oversold when it is below 30. The default setting for the RSI is 14 periods.
Traders can use the RSI to identify the trend and its strength, as well as the overbought and oversold conditions, divergences, and momentum shifts. For example, a common technique is to use the RSI as a trend indicator and look for the RSI values relative to the 50 level. When the RSI is above 50, it indicates an uptrend, and when the RSI is below 50, it indicates a downtrend. When the RSI crosses above or below the 50 level, it indicates a potential trend change.
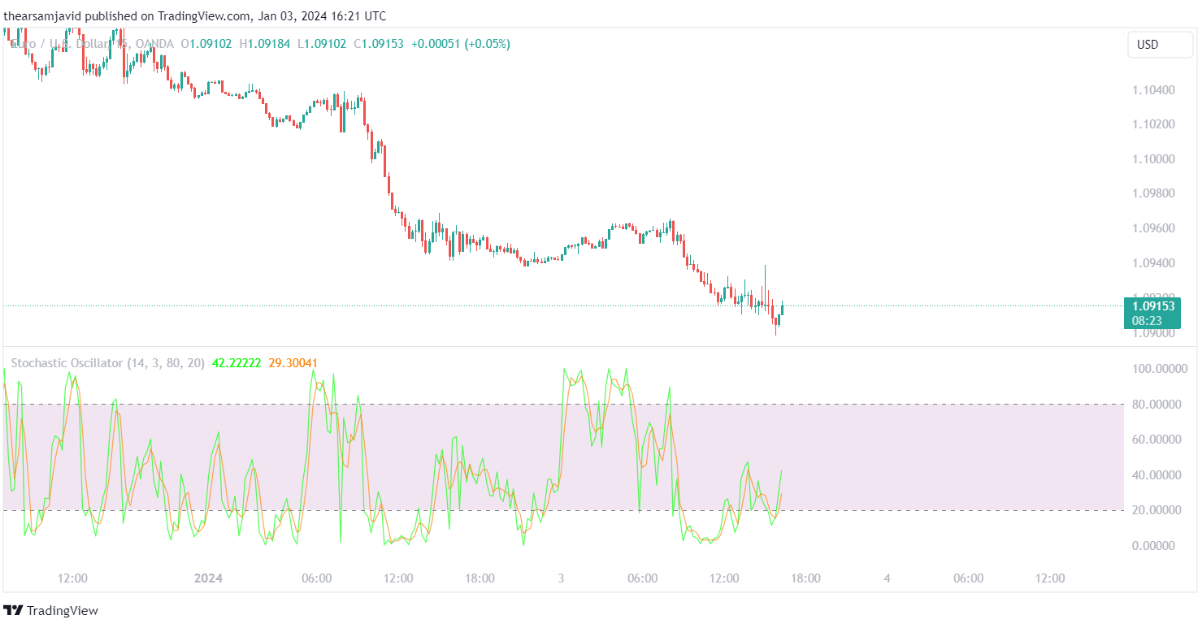
1.2.2. Stochastic oscillator (STO)
A stochastic oscillator compares the closing price of the current period to the range of the prices over a certain period of time. It can be used to measure the momentum and the direction of the price movements. The stochastic oscillator consists of two lines: the %K line and the %D line. The %K line is the main line that shows the current position of the price relative to the range. The %D line is the signal line that shows the moving average of the %K line.
Traders can use the stochastic oscillator to identify the trend and its direction, as well as the overbought and oversold conditions, divergences, and momentum shifts. For example, a common technique is to use the stochastic oscillator as a trend indicator and look for the stochastic values relative to the 50 level. When the stochastic is above 50, it indicates an uptrend, and when the stochastic is below 50, it indicates a downtrend.
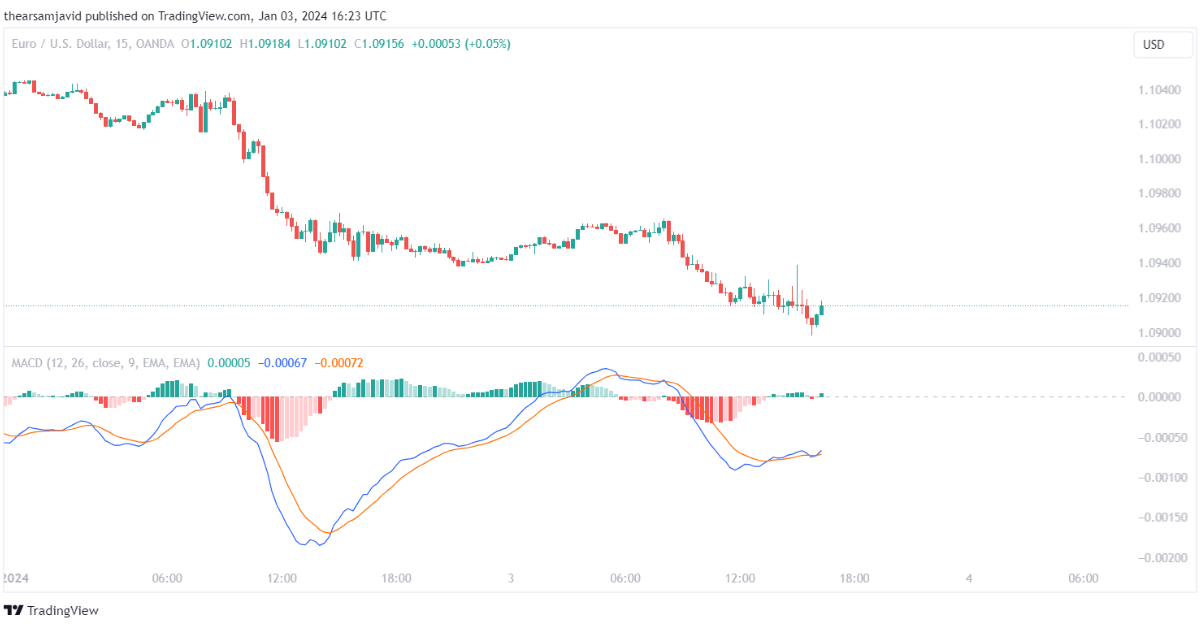
1.2.3. Moving average convergence divergence (MACD):
Moving average convergence divergence indicators use a formula that subtracts a longer-term exponential moving average from a shorter-term exponential moving average. It can be used to measure the momentum and the trend of the price movements.
The MACD consists of three components: the MACD line, the signal line, and the histogram. The MACD line is the main line that shows the difference between the two moving averages. The signal line is the signal line that shows the moving average of the MACD line. The histogram is the bar chart that shows the difference between the MACD line and the signal line. The default settings for the MACD are 12, 26, and 9 periods for the shorter-term EMA, the longer-term EMA, and the signal line, respectively.
Traders can use the MACD to identify the trend and its strength, as well as the divergences and momentum shifts. For example, a common technique is to use the MACD as a trend indicator and look for the MACD values relative to the zero level. When the MACD is above zero, it indicates an uptrend, and when the MACD is below zero, it indicates a downtrend. When the MACD crosses above or below the zero level, it indicates a potential trend change.
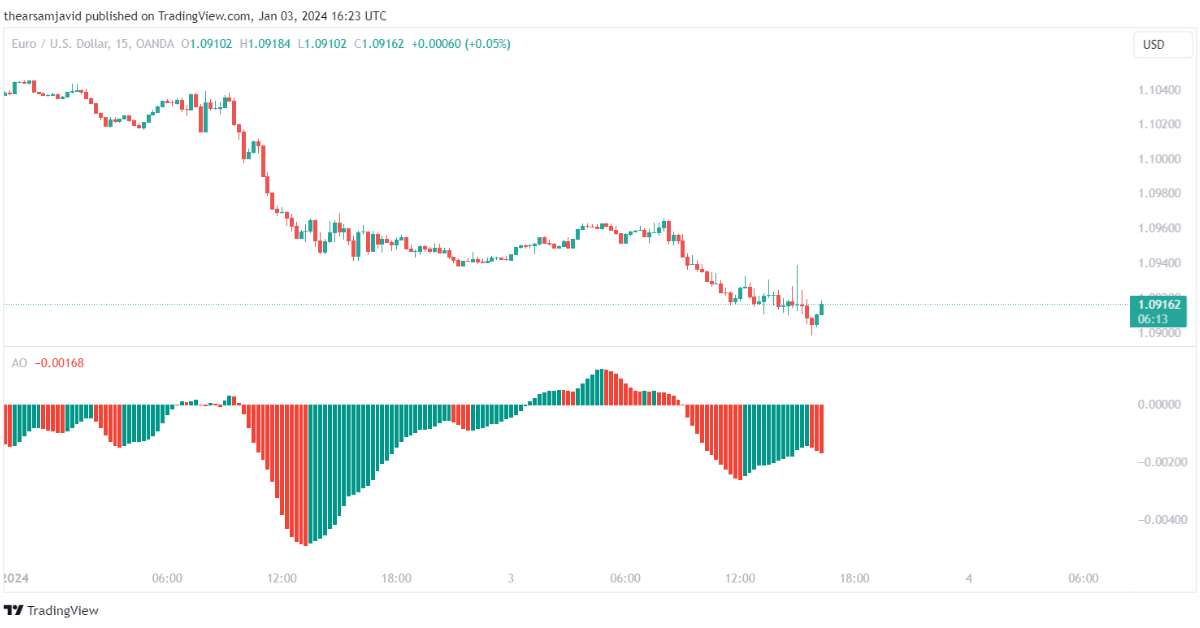
1.2.4. Awesome oscillator (AO)
Awesome oscillator subtracts a 34-period simple moving average from a 5-period simple moving average. It can be used to measure the momentum and the trend of the price movements. The awesome oscillator is plotted as a histogram that oscillates around the zero level.
The default settings for the awesome oscillator are 5 and 34 periods for the shorter-term SMA and the longer-term SMA, respectively.
Traders can use the awesome oscillator to identify the trend and its strength, as well as the divergences and momentum shifts. For example, a common technique is to use the awesome oscillator as a trend indicator and look for the awesome oscillator values relative to the zero level. When the awesome oscillator is above zero, it indicates an uptrend, and when the awesome oscillator is below zero, it indicates a downtrend. When the awesome oscillator crosses above or below the zero level, it indicates a potential trend change.
1.2.5. Advantages and disadvantages of Momentum Indicators are given below:
The advantages of momentum indicators are:
- They can help traders measure the strength and the direction of the trend, which can help them confirm the trend and its continuation.
- These indicators identify the overbought and oversold conditions, which can help them spot the potential reversal points and exit points.
The disadvantages of momentum indicators are:
- They can be misleading in sideways or ranging markets, which can result in whipsaws and confusion.
1.3. Volatility indicators
Volatility indicators are indicators that show the degree of variation and uncertainty in price movements. They can help traders assess the risk and opportunity in the market, as well as adjust their position size and stop-loss levels accordingly. Some of the most widely used volatility indicators are given below:
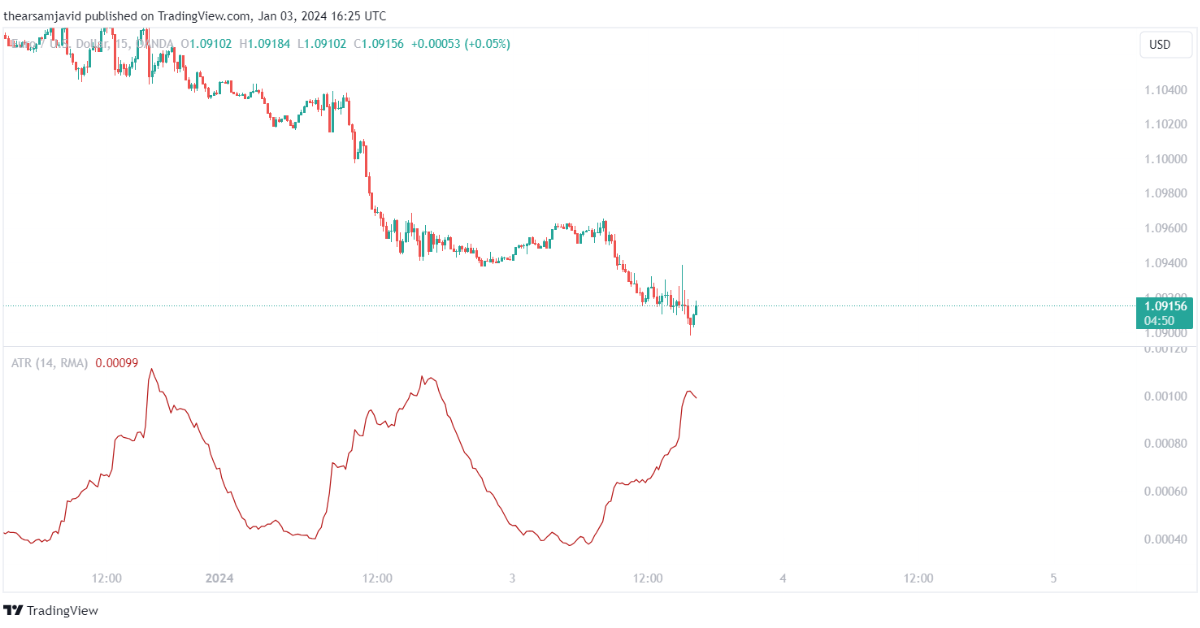
1.3.1. Average true range (ATR)
Average true range uses a formula that takes the average of the true range over a certain period of time. The true range is the maximum of the following three values: the current high minus the current low, the absolute value of the current high minus the previous close, and the absolute value of the current low minus the previous close. It can be used to measure the volatility and the range of the price movements. The default setting for the ATR is 14 periods.
Traders can use the ATR to identify the volatility and the range of the market, as well as to set the position size and the stop-loss levels. For example, a common technique is to use the ATR as a volatility indicator and look for the ATR values relative to the historical average. When the ATR is above the average, it indicates a high-volatility market, and when the ATR is below the average, it indicates a low-volatility market. When the ATR increases or decreases significantly, it indicates a possible volatility breakout or breakdown.
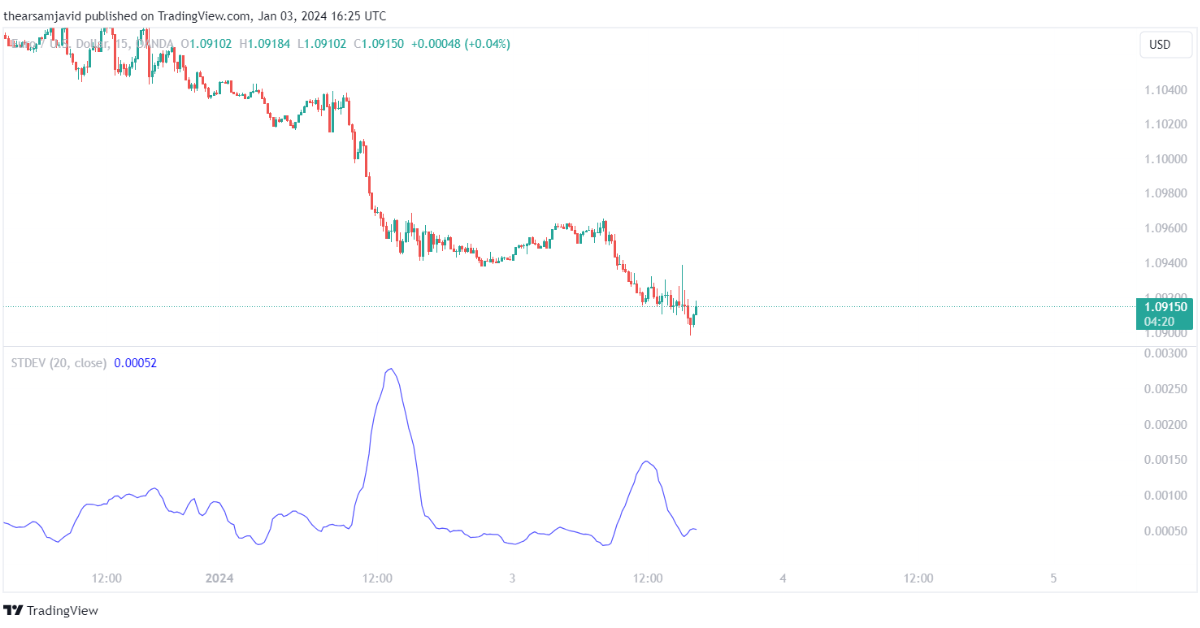
1.3.2. Standard deviation (SD)
Standard deviation is calculated by using a formula that measures how much the price deviates from the mean over a certain period of time. It can be used to measure the volatility and the dispersion of the price movements. The higher the standard deviation, the higher the volatility, and the lower the standard deviation, the lower the volatility. The default setting for the standard deviation is 20 periods.
Traders can use the standard deviation to identify the volatility and the dispersion of the market, as well as to identify the overbought and oversold conditions, divergences, and trend strength. For example, a common technique is to use the standard deviation as a volatility indicator and look for the standard deviation values relative to the historical average. When the standard deviation is above the average, it indicates a high-volatility market, and when the standard deviation is below the average, it indicates a low-volatility market. When the standard deviation increases or decreases significantly, it indicates a possible volatility breakout or breakdown.
1.3.3. Bollinger bands (BB)
Bollinger bands are calculated by adding and subtracting a standard deviation from a moving average. They can be used to measure the volatility and the range of the price movements. The standard deviation is a statistical measure that shows how much the price deviates from the average. The higher the standard deviation, the wider the bands, and the lower the standard deviation, the narrower the bands. The default settings for the Bollinger bands are a 20-period SMA and a 2-standard deviation.
Traders can use the Bollinger bands to identify the volatility and the range of the market, as well as the trend and its strength, the overbought and oversold conditions, and the potential reversal points. For example, a common technique is to use the Bollinger bands as a volatility indicator and look for the width of the bands relative to the historical average. When the bands are wide, it indicates a high volatility market, and when the bands are narrow, it indicates a low volatility market. When the bands expand or contract significantly, it indicates a possible volatility breakout or breakdown.
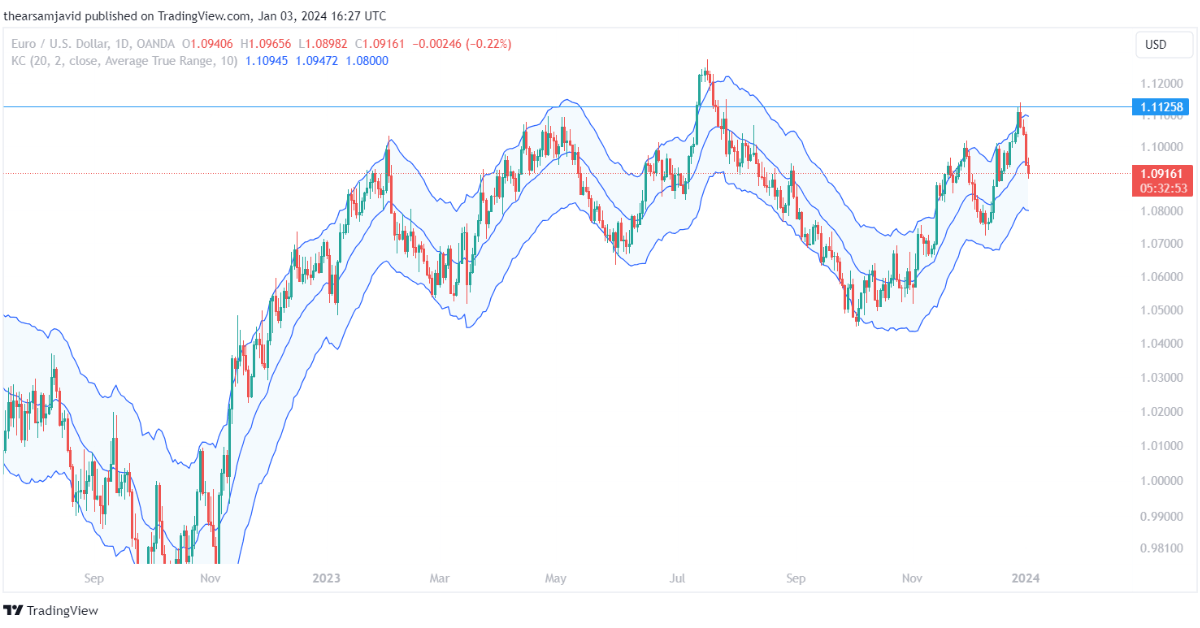
1.3.4. Keltner channels (KC)
Keltner channels are calculated by adding and subtracting a multiple of the average true range from a moving average. They can be used to measure the volatility and the range of the price movements. The average true range is a measure that shows the average of the true range over a certain period of time. The true range is the maximum of the following three values: the current high minus the current low, the absolute value of the current high minus the previous close, and the absolute value of the current low minus the previous close. The multiple is a factor that determines how wide or narrow the channels are.
Traders can use the Keltner channels to identify the volatility and the range of the market, as well as the trend and its strength, the overbought and oversold conditions, and the potential reversal points. For example, a common technique is to use the Keltner channels as a volatility indicator and look for the width of the channels relative to the historical average. When the channels are wide, it indicates a high volatility market, and when the channels are narrow, it indicates a low volatility market. When the channels expand or contract significantly, it indicates a possible volatility breakout or breakdown. Another technique is to use the Keltner channels as a trend indicator and look for the direction and the slope of the channels. When the channels are sloping up, it indicates an uptrend, and when the channels are sloping down, it indicates a downtrend. When the channels are flat, it indicates a sideways or ranging market.
1.3.5. Advantages and Disadvantages of Volatility Indicators
The advantages of volatility indicators are:
- They can help traders measure the risk and opportunity in the market, which can help them manage their money and emotions better.
- You can adjust your position size and stop-loss levels according to the market conditions with these indicators.
The disadvantages of volatility indicators are:
- They can be lagging, which means that they may not reflect the current market conditions accurately.
- They can be misleading in trending or non-volatile markets.
1.4. Volume indicators
Volume indicators are indicators that show the amount and intensity of trading activity in the market. They can help traders confirm the validity and significance of the price movements, as well as detect supply and demand imbalances, breakouts, and accumulation and distribution phases. Some of the most effective volume indicators are:
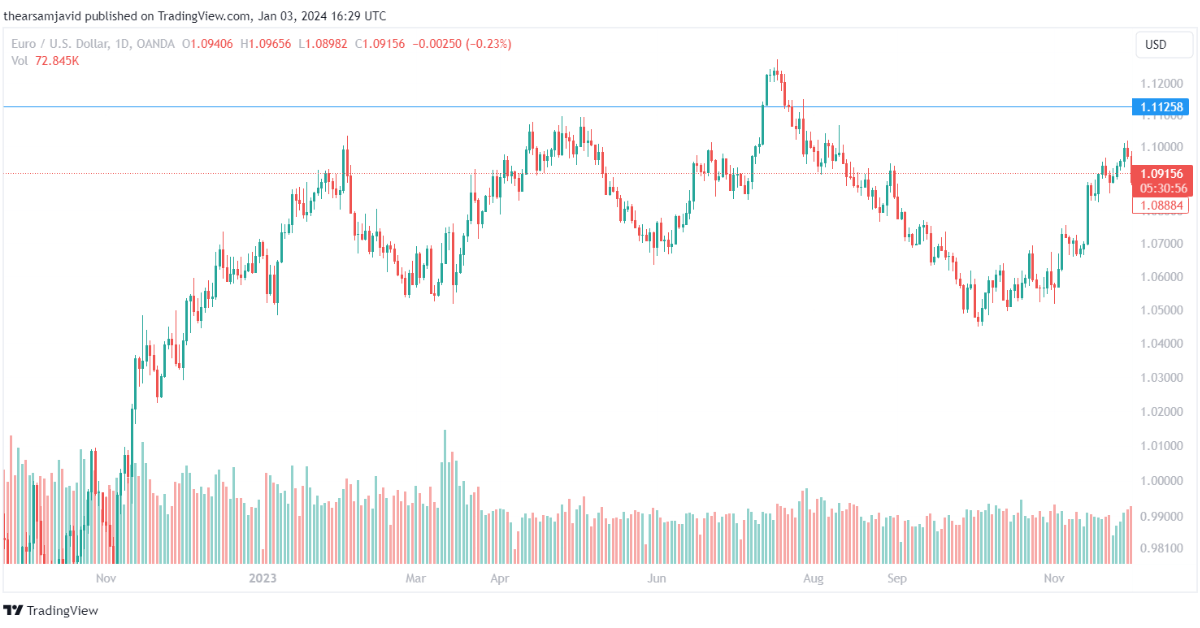
1.4.1. Volume
Volume is the simplest and most basic volume indicator. It shows the number of units or contracts that are traded in a given period of time. It can be used to measure the interest and participation of the market participants. The higher the volume, the higher the interest and participation, and the lower the volume, the lower the interest and participation.
Traders can use the volume to confirm the validity and significance of the price movements. For example, a common technique is to use the volume as a confirmation indicator and look for the correlation between the volume and the price. When the volume and the price move in the same direction, it indicates a valid and significant price movement, and when the volume and the price move in the opposite direction, it indicates an invalid and insignificant price movement.
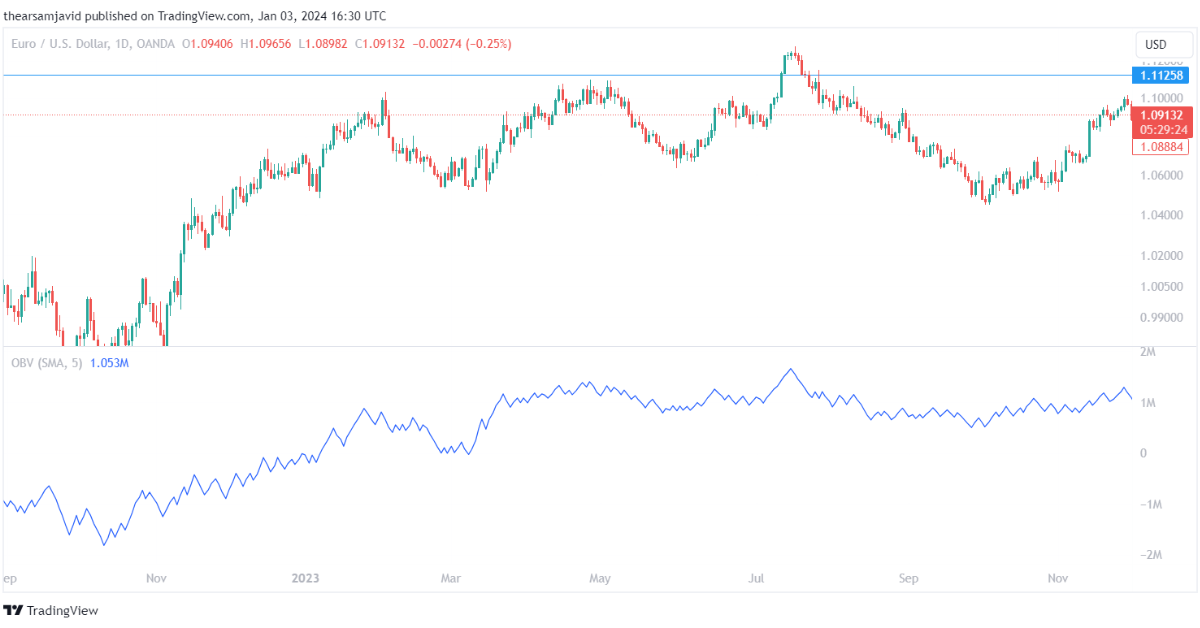
1.4.2. On-balance volume (OBV)
On-balance volume is calculated by using a formula that adds or subtracts the volume of the current period to or from the cumulative total of the previous periods, depending on the direction of the price movement. It can be used to measure the cumulative buying and selling pressure in the market. The higher the OBV, the higher the buying pressure, and the lower the OBV, the lower the selling pressure.
You can use the OBV to confirm the validity and significance of the price movements, as well as to identify the divergences and trend strength. For example, a common technique is to use the OBV as a confirmation indicator and look for the correlation between the OBV and the price. When the OBV and the price move in the same direction, it indicates a valid and significant price movement, and when the OBV and the price move in the opposite direction, it indicates an invalid and insignificant price movement. When the OBV increases or decreases significantly, it indicates a possible price breakout or breakdown.
1.4.3. Advantages and Disadvantages of Volume Indicators
The advantages of volume indicators are:
- They can confirm the validity and significance of the price movements.
- They can detect supply and demand imbalances, identifying the potential reversal points and entry points.
- They can be the accumulation and distribution phases.
The disadvantages of volume indicators are:
- They can be difficult to interpret for some traders.
2. How Do You Set Up the Most Effective Forex Indicators?
Setting up effective Forex indicators requires a strategic approach to ensure they align with your trading style and objectives. The following are some steps that can help you effectively set the forex indicators:
2.1. Choose the Right Time Frame
Selecting the right time frame for trading is a critical decision that aligns with individual trading strategies and goals. Short-term traders, such as scalpers and day traders, generally prefer using lower time frames like 1-minute to 15-minute charts to capitalize on quick, small movements. On the other hand, swing traders and position traders tend to lean towards daily, weekly, or even monthly charts, seeking larger trends and broader market movements.
Let’s have a look at this chart for a comprehensive guide to the time frame:
| Time Frame | Suitable for | Typical Holding Period |
| 1-Minute to 15-Minute | Scalpers/Day Traders | A few minutes to several hours |
| 1-Hour to 4-Hour | Intraday Traders | Several hours to a day |
| Daily to Weekly | Swing Traders | Several days to weeks |
| Weekly to Monthly | Position Traders | Several weeks to months |
2.2. Customize Indicator Parameters
Customizing forex indicator parameters involves adjusting the default settings to suit specific trading strategies, market conditions, and currency pairs. Optimization of these parameters can lead to more accurate signals, which is crucial for successful trading.
Moving Averages, for example, can be tweaked by changing the period length. A shorter period makes the moving average more sensitive to price changes, generating quicker signals. Conversely, a longer period provides a smoother line that is less prone to fluctuations, offering a clearer view of the underlying trend.
RSI settings can be modified to alter the indicator’s sensitivity. The standard setting is 14 periods, but reducing this number will make the RSI more responsive, which may be beneficial in a volatile market. However, this also increases the likelihood of false signals. Increasing the period count will smooth out the RSI curve, potentially providing more reliable signals but with a slower response to market changes.
MACD parameters consist of two moving averages and a signal line, typically set at 12, 26, and 9 periods. Traders might adjust these settings for a faster or slower signal line crossover, which can indicate momentum changes in the market.
The table below outlines the effects of adjusting parameters for common indicators:
| Indicator | Adjustment | Effect |
| MA | Shorter period | More sensitive, quicker signals |
| MA | Longer period | Less sensitive, clearer trend |
| RSI | Lower period | More sensitive, more false signals |
| RSI | Higher period | Less sensitive, fewer false signals |
| MACD | Varying periods | Faster or slower crossovers |
2.3. Combine Indicators for Enhanced Analysis
Combining indicators in a forex trading strategy allows for a multi-faceted analysis of market conditions, which can enhance trading strategies by providing confirmation and reducing the likelihood of false signals.
For instance, a 50-period EMA can be used to determine the overall trend direction, while the RSI can be employed to identify potential entry points during pullbacks in a trend. When the EMA shows an uptrend, and the RSI dips below 30 before moving back above it, this could be indicative of a buying opportunity within the context of the larger uptrend.
Another powerful combination is using Bollinger Bands with the Stochastic Oscillator. While Bollinger Bands helps visualize the volatility and identify the overbought and oversold conditions, the Stochastic Oscillator can provide additional confirmation when its signal line crosses the main line within these extreme conditions, suggesting a potential reversal.
Traders often use MACD in conjunction with the ATR to gauge momentum and manage risk. The MACD can signal the strength and direction of a trend, while the ATR provides insight into the current volatility, which is essential for setting appropriate stop-loss and take-profit levels.
Forex Indicator Combinations:
| Trend Indicator | Oscillator | Purpose of Combination |
| EMA (50-period) | RSI (14-period) | Confirm trend continuation and potential entry points |
| Bollinger Bands (20-period, 2 SD) | Stochastic Oscillator | Identify volatility and potential reversals |
| MACD (12, 26, 9) | ATR (14-period) | Assess momentum and manage trade risk |
3. What Role Do Oscillators Play in Forex Trading?
Oscillators play a critical role in forex trading by helping to identify overbought and oversold conditions, gauge market momentum, and confirm trend reversals or continuations. They are most useful in ranging or sideways markets, where trend-following indicators like moving averages prove less effective.
Stochastic Oscillator:
- Measures the current price relative to the price range over a specific period.
- Generates overbought (>80) and oversold (<20) signals.
- It can indicate potential reversal points when the %K line crosses the %D line.
Relative Strength Index (RSI):
- Oscillates between 0 to 100, typically using a 14-period setting.
- Values above 70 suggest overbought conditions, while below 30 indicate oversold.
- Divergences between RSI and price action can signal impending trend changes.
Moving Average Convergence Divergence (MACD):
- Consists of two moving averages (the MACD line and the signal line) and a histogram.
- Traders look for crossovers between the MACD line and the signal line to identify potential buy or sell opportunities.
- The histogram reflects the distance between the MACD line and the signal line, indicating momentum strength.
Oscillator Characteristics:
| Oscillator | Overbought Level | Oversold Level | Primary Use |
| Stochastic | Above 80 | Below 20 | Reversal Signals |
| RSI | Above 70 | Below 30 | Market Extremes |
| MACD | Crossover Above 0 | Crossover Below 0 | Trend and Momentum |
Oscillators are invaluable when combined with other technical analysis tools, providing a holistic view of the market. For instance, an oversold signal from the RSI during an uptrend identified by a moving average might be seen as a buying opportunity, as it suggests a temporary pullback rather than a trend reversal.
Oscillator and Trend Indicator Combination:
| Trend Indicator | Oscillator | Ideal Condition | Trade Action |
| EMA (50-period) | RSI (14-period) | RSI Oversold in Uptrend | Consider Long Position |
| SMA (200-period) | Stochastic | Stochastic Overbought in Downtrend | Consider Short Position |
4. What To Consider When Choosing Forex Indicators?
Selecting the right forex indicators requires a comprehensive analysis of various factors to ensure they align with your trading strategy and market conditions. Here is a breakdown of critical considerations:
Assessing Indicator Responsiveness vs. Lag
- Responsiveness: Indicators like the Stochastic Oscillator and RSI react quickly to price changes, providing timely signals.
- Lag: Indicators such as moving averages may delay signals but offer the benefit of smoothing out price noise.
Risk Management with Volatility Indicators
- Average True Range (ATR): Measures market volatility and helps in setting appropriate stop-loss levels.
- Bollinger Bands: Offer insights into market volatility and price levels relative to standard deviations.
Correlation with Market Phases and Asset Classes
- Trend: Indicators like MACD and moving averages work well in trending markets but may generate false signals in ranges.
- Range: Oscillators such as RSI and Stochastic are preferable in range-bound markets for spotting overbought and oversold conditions.
| Indicator Type | Market Condition | Preferred Indicators | Purpose |
| Trend-Following | Trending Markets | MACD, Moving Averages | Identify the direction and strength of a trend |
| Oscillators | Range-Bound Markets | RSI, Stochastic | Detect overbought/oversold levels |
Customization and Time Frame Consideration
- Short-Term Trading: Use indicators with shorter periods for quicker signals.
- Long-Term Trading: Opt for indicators with longer periods for more significant trends.
Indicator Compatibility and Confirmation
- Combine indicators that complement each other to confirm signals.
- Avoid using indicators that provide redundant information.
Backtesting and Real-World Application
- Backtest indicators to assess performance across different market conditions.
- Apply indicators in a demo account to gauge real-world applicability.
Risk Management Integration
- Incorporate indicators within a broader risk management framework.
- Ensure indicator signals do not lead to overexposure or excessive risk-taking.