1. Understanding DEMA
The Double Exponential Moving Average (DEMA), an advanced technical analysis tool, is a potent weapon in the arsenal of any savvy forex, crypto, or CFD trader. It was developed by Patrick Mulloy and first published in the “Technical Analysis of Stocks & Commodities” magazine in 1994.
At its core, the DEMA is a faster and more responsive version of the traditional exponential moving average (EMA). This enhanced speed and responsiveness come from the DEMA’s unique ability to adjust itself to price changes more swiftly than the EMA. It does this by giving more weight to recent price data, thereby reducing the lag associated with traditional moving averages.
The settings for the DEMA depend on the trader’s strategy and the asset being traded. Short-term traders may use a shorter period like 10 or 20, while long-term traders might prefer a longer period like 50 or 100. The key is to experiment with different settings to find the one that best fits your trading style and the market conditions.
When it comes to strategy, the DEMA can be used in a variety of ways. One popular method is to use it as a trend indicator. When the DEMA is rising, it indicates an uptrend, and when it’s falling, it signals a downtrend. Another strategy is to use the DEMA as a signal line in a crossover system. When the price crosses above the DEMA, it’s a bullish signal, and when it crosses below the DEMA, it’s a bearish signal.
Remember, while the DEMA can be a powerful tool, it’s not infallible. It should be used in conjunction with other technical analysis tools and indicators to confirm signals and reduce false alarms.
1.1. Definition of DEMA
In the intricate world of trading, understanding the tools at your disposal can make a significant difference in your trading strategy. One such tool is the Double Exponential Moving Average (DEMA). As a technical indicator, DEMA is designed to eliminate the lag associated with traditional moving averages. It does this by applying more weight to recent prices, thereby increasing its responsiveness to price changes.
The DEMA is not just a double EMA, but it is a composite of a single exponential moving average, a double exponential moving average, and a simple moving average. This unique combination allows the DEMA to react swiftly to price changes, offering traders a sharper analysis of market trends.
In essence, the Double Exponential Moving Average (DEMA) provides traders with a more accurate and responsive tool for trend analysis, making it an essential part of any successful trading strategy.
1.2. The Importance of DEMA in Trading
In the dynamic world of forex, crypto, and CFD trading, the Double Exponential Moving Average (DEMA) plays a pivotal role, offering an edge to traders who are keen on harnessing its power. This technical analysis tool, with its unique ability to respond more quickly to price changes compared to traditional moving averages, is a game-changer in the trading arena.
The DEMA is a potent tool that helps traders to identify potential trend reversals, providing valuable insights about market sentiment. It’s like having a seasoned market analyst by your side, offering real-time advice. The DEMA’s accuracy in pinpointing price changes often translates into more profitable trades and reduced risk of losses.
Key benefits of DEMA include:
- Reduced Lag: DEMA reduces the lag time that is typically associated with moving averages. This allows traders to respond more swiftly to price changes, thereby maximizing their potential profits.
- Increased Sensitivity: DEMA’s increased sensitivity to price fluctuations makes it a valuable tool for identifying potential market reversals early.
- Improved Accuracy: Unlike simple moving averages, DEMA provides a more accurate representation of price trends, enabling traders to make more informed decisions.
Moreover, the DEMA can be combined with other technical indicators to create a comprehensive trading strategy. For instance, when used in conjunction with indicators like the MACD or RSI, the DEMA can enhance the effectiveness of these tools, providing a more nuanced understanding of market dynamics.
2. DEMA Formula and Its Components
In the fascinating world of forex, crypto, and CFD trading, the DEMA (Double Exponential Moving Average) formula is a potent tool that can help traders make more informed decisions. The components of this formula are integral to its effectiveness and understanding them can give you a competitive edge in the market.
At its core, the DEMA formula comprises two key elements: the EMA (Exponential Moving Average) and the EMA of EMA. The formula is designed to respond more quickly to price changes than a traditional EMA, making it particularly useful in volatile markets such as forex and crypto.
The formula for DEMA is: DEMA = 2 * EMA(n) – EMA(EMA(n))
- EMA(n) is the Exponential Moving Average for a specific period ‘n’. This is calculated by giving more weight to recent prices, which makes it more responsive to new information.
- EMA(EMA(n)) is the Exponential Moving Average of the EMA. This is essentially a smoothing process that further prioritizes recent price changes.
The DEMA formula is designed to be more responsive to recent price changes. This is achieved by doubling the weight of the most recent EMA and then subtracting the EMA of the EMA. This results in a moving average that is faster and less prone to lag, making it an invaluable tool for traders in fast-paced markets.
However, it’s important to note that while the DEMA formula provides a quicker response to price changes, it may also increase the risk of false signals. As with any trading tool, it’s crucial to use DEMA in conjunction with other indicators and strategies to manage risk effectively.
2.1. Breaking Down the DEMA Formula
Diving deep into the heart of the DEMA, or Double Exponential Moving Average, it’s essential to grasp the underlying formula that powers this innovative trading tool. The DEMA is a faster, more responsive form of the traditional Exponential Moving Average (EMA), designed to reduce the lag time inherent in many trading indicators.
The DEMA formula is a blend of a single and double EMA, and its calculation involves three primary steps:
- Compute the EMA for the given period.
- Calculate the EMA of the EMA from step one.
- Finally, subtract the result of the second EMA from twice the first EMA to obtain the DEMA.
Step 1: The initial EMA calculation is straightforward. It uses the formula EMA = (Close – EMA(previous day)) x multiplier + EMA(previous day). The multiplier is 2 / (selected time period + 1).
Step 2: The second EMA calculation is similar to the first, but it uses the EMA calculated in step one instead of the closing price.
Step 3: The final step in the DEMA calculation involves some simple arithmetic. Multiply the EMA from step one by two, then subtract the EMA from step two. This yields the DEMA.
By breaking down the DEMA formula, we can see that it’s not just a simple average. Instead, it’s a dynamic tool that adjusts more quickly to market changes, providing traders with potentially valuable insights that could be missed by slower indicators. It’s no wonder the DEMA has become a favored tool among discerning forex, crypto, and CFD traders.
2.2. The Significance of the DEMA Formula
The DEMA formula is a pivotal tool in forex, crypto, and CFD trading, as it gives traders an edge in predicting market trends with remarkable accuracy. This formula, an acronym for Double Exponential Moving Average, is a technical indicator that offers a faster response to price fluctuations compared to traditional moving averages. It is designed to reduce the lag time inherent in simple moving averages, providing traders with more timely and actionable data.
The DEMA formula is calculated by taking the difference between two exponential moving averages (EMAs), then adding a single EMA to the result. This calculation results in a moving average line that reacts more quickly to recent price changes, enabling traders to capitalize on market movements more effectively.
The importance of the DEMA formula lies in its ability to:
- Identify Trend Changes: The DEMA formula helps traders spot reversals in the market trend early, enabling them to adjust their strategies accordingly and maximize their profits.
- Reduce Lag: The DEMA formula is designed to reduce the lag associated with traditional moving averages, providing more timely data for traders to act upon.
- Improve Accuracy: The DEMA formula provides a more accurate representation of the market trend by minimizing the impact of price noise.
The DEMA formula’s significance cannot be overstated. It is an indispensable tool for any trader looking to stay ahead of the curve in the fast-paced, ever-changing landscape of forex, crypto, and CFD trading. By providing more timely and accurate data, the DEMA formula empowers traders to make informed decisions, minimize risks, and maximize returns.
3. DEMA Settings for Optimal Use
The beauty of the DEMA indicator lies in its flexibility. You can tweak the settings to align with your trading strategy, whether it’s scalping, day trading, or long-term investing. The default setting for DEMA is typically a 21-period timeframe, but this is not a one-size-fits-all solution.
Short-term traders often lower the DEMA period to 5, 10, or 15. This setting provides more frequent signals, which can be advantageous in a volatile market. However, be aware that a lower setting may also increase the risk of false signals.
Long-term traders, on the other hand, might increase the DEMA period to 50, 100, or even 200. This setting filters out market ‘noise’ and provides a clearer view of the overall trend.
- Experiment with settings: The optimal DEMA setting depends on your trading style, risk tolerance, and the specific market conditions. Don’t be afraid to experiment with different settings to find what works best for you.
- Use in conjunction with other indicators: DEMA can provide valuable insights, but it shouldn’t be the only tool in your toolbox. Use it in conjunction with other technical indicators to confirm signals and improve your trading strategy.
- Backtest your strategy: Once you’ve chosen your DEMA settings, backtest your strategy on historical data. This will give you a good idea of how your strategy would have performed in the past and help you fine-tune it for the future.
DEMA is a powerful tool that can help you identify market trends and make informed trading decisions. However, like any tool, it’s only as good as the person using it. So take the time to understand how DEMA works, experiment with different settings, and always use it as part of a comprehensive trading strategy.
3.1. Choosing the Right Time Frame
In the bustling world of forex, crypto, and CFD trading, the key to unlocking the full potential of the Double Exponential Moving Average (DEMA) lies in the careful selection of the right time frame. This critical decision can significantly influence the effectiveness of your trading strategy.
Understanding the time frame is crucial because it directly impacts the number of trading signals you receive. For instance, a shorter time frame like the 1-minute or 5-minute chart can generate more signals. However, these signals may not be as reliable, leading to potential false positives. On the other hand, a longer time frame such as the daily or weekly chart may provide fewer signals, but their reliability tends to be higher.
- Short time frames: Suitable for day traders who are looking for quick in-and-out trades. However, the risk of false signals is higher.
- Medium time frames: Ideal for swing traders who hold positions for several days to weeks. It offers a balance between the number of signals and their reliability.
- Long time frames: Perfect for position traders or investors who hold positions for several weeks to months. The signals are fewer but tend to be more reliabl
Testing different time frames is a wise strategy. It allows you to understand how DEMA performs under different market conditions. You might find that a 15-minute chart works best for your style of day trading, while a weekly chart might be more suitable for your long-term investment strategy.
Remember, there’s no one-size-fits-all when it comes to choosing the right time frame. It’s about finding the sweet spot that aligns with your trading style, risk tolerance, and the specific characteristics of the asset you’re trading. Your chosen time frame should help you make the most of the DEMA’s potential, enhancing your trading strategy and ultimately, your profitability.
3.2. Adjusting DEMA Settings
Tuning the DEMA settings to align with your trading style and market conditions is a critical step in the process. It’s akin to fine-tuning a musical instrument to hit the perfect notes. DEMA, or Double Exponential Moving Average, is a powerful tool that combines the benefits of simple and exponential moving averages to deliver more accurate and timely trading signals.
The first key setting to adjust is the lookback period. This defines the number of past data points that the DEMA calculation considers. A short lookback period, such as 10, makes the DEMA more sensitive to price changes, resulting in quicker signals. Conversely, a long lookback period, such as 50, smoothens out the DEMA line, reducing the impact of volatility and providing slower but potentially more reliable signals.
- A short lookback period might be suitable for day traders or scalpers who need to react quickly to market changes.
- A long lookback period could be a better fit for swing traders or long-term investors who prefer to avoid false signals and market noise.
Another critical setting is the price type used in the DEMA calculation. You can choose to calculate DEMA based on the closing, opening, high, low, or median price of each period. The choice depends on your trading strategy and the specific market conditions you’re dealing with.
Remember, there’s no one-size-fits-all setting for DEMA. It’s crucial to experiment with different configurations and backtest them on historical data to find the optimal settings for your trading strategy. The ultimate goal is to strike a balance between sensitivity and reliability, reducing the risk of false signals while still reacting promptly to genuine trading opportunities.
4. Effective DEMA Trading Strategies
Whether you’re a seasoned forex trader or a crypto enthusiast, understanding and implementing DEMA trading strategies can significantly enhance your trading success. Let’s delve into four effective DEMA strategies that can take your trading game to the next level.
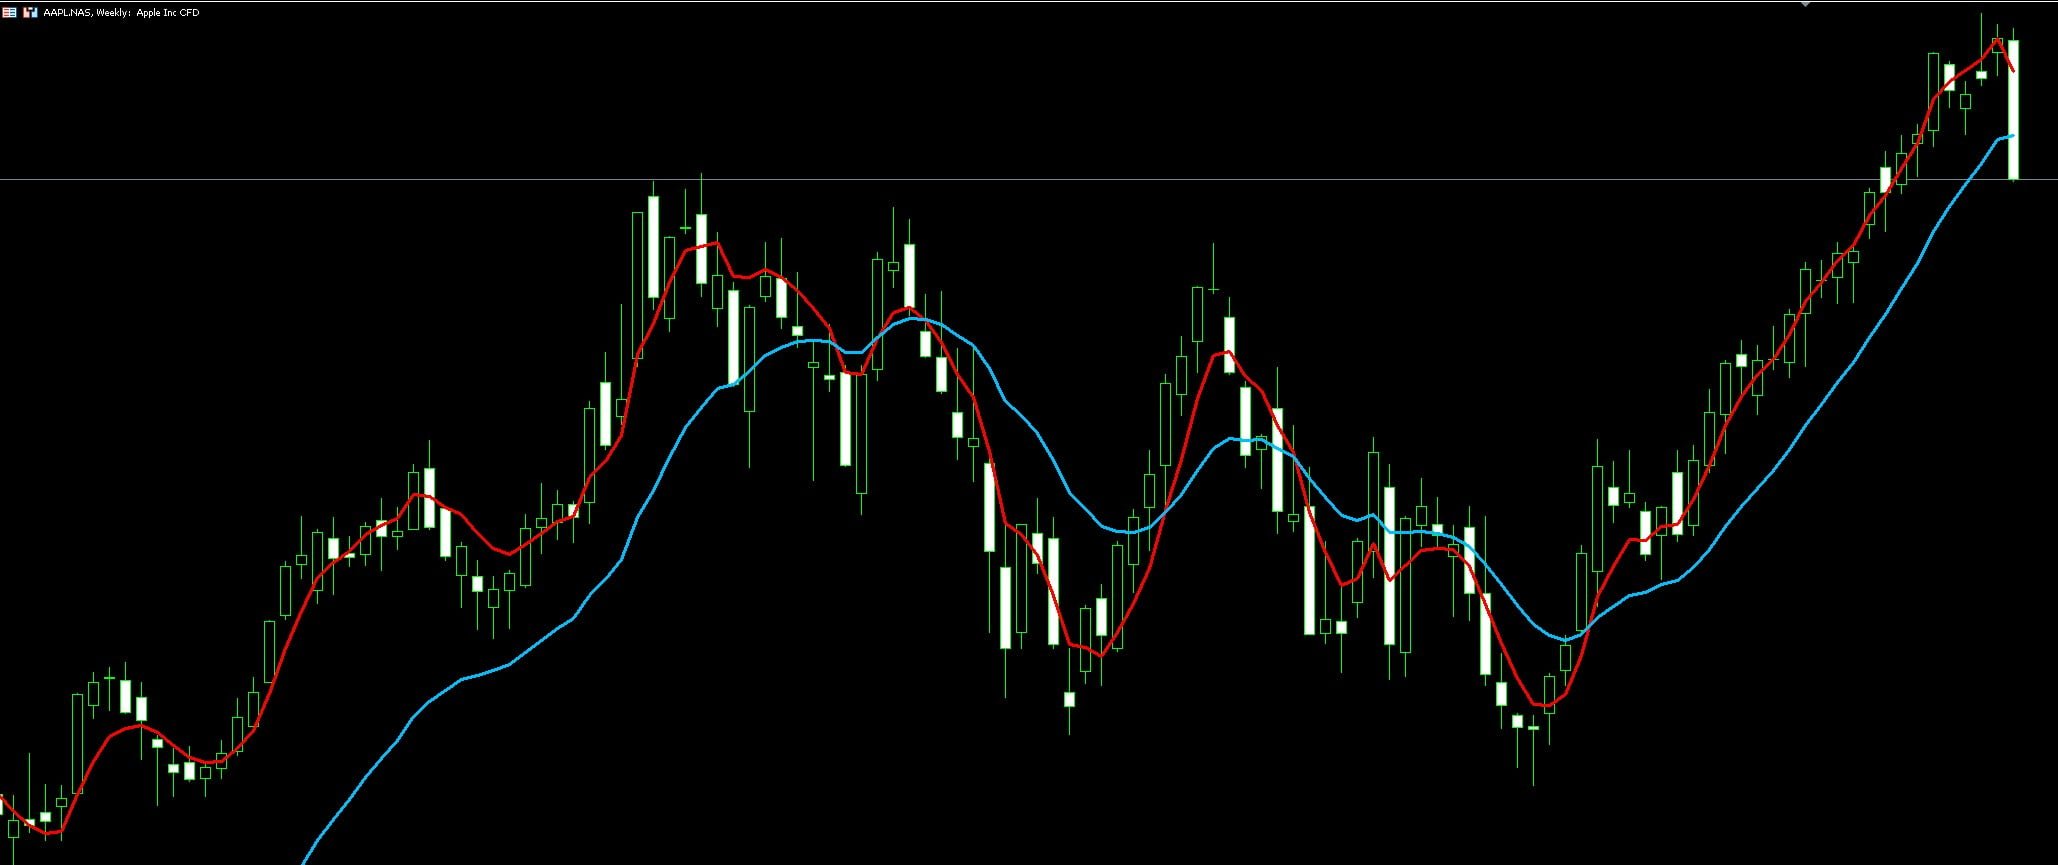
- DEMA Crossover strategy: This strategy involves using two DEMA lines of different periods. When the shorter period DEMA crosses above the longer period DEMA, it signals a bullish market, indicating it’s time to buy. Conversely, when the shorter period DEMA crosses below the longer period DEMA, it signals a bearish market, suggesting it’s time to sell.
- DEMA and Price Action: This strategy combines the DEMA indicator with price action. Traders look for price patterns and formations that align with DEMA signals to confirm potential market trends. For instance, if a bullish engulfing pattern forms just as the DEMA line turns upwards, it strengthens the buy signal.
- DEMA and Oscillators: Combining DEMA with oscillators like RSI or Stochastic can provide additional confirmation for trading signals. For example, if the DEMA line indicates a bullish trend and the RSI is below 30 (oversold territory), it could be a strong indication to buy.
- DEMA and Volume: The final strategy involves using DEMA in conjunction with volume indicators. A sudden increase in trading volume accompanied by a corresponding DEMA signal can often denote a strong market move. This strategy is particularly useful in crypto trading, where volume plays a significant role.
Incorporating these DEMA strategies into your trading routine can help you make more informed decisions, manage risk effectively, and potentially increase your profitability. Remember, the key to successful trading lies in understanding the market, mastering your chosen strategies, and maintaining discipline in your trading activities.
4.1. DEMA Crossover Strategy
The DEMA Crossover Strategy is a powerful tool that uses the Double Exponential Moving Average (DEMA) to generate trading signals. This strategy is particularly effective in volatile markets, such as forex, crypto, and CFD trading. The DEMA Crossover Strategy involves two DEMA lines: a fast DEMA and a slow DEMA.
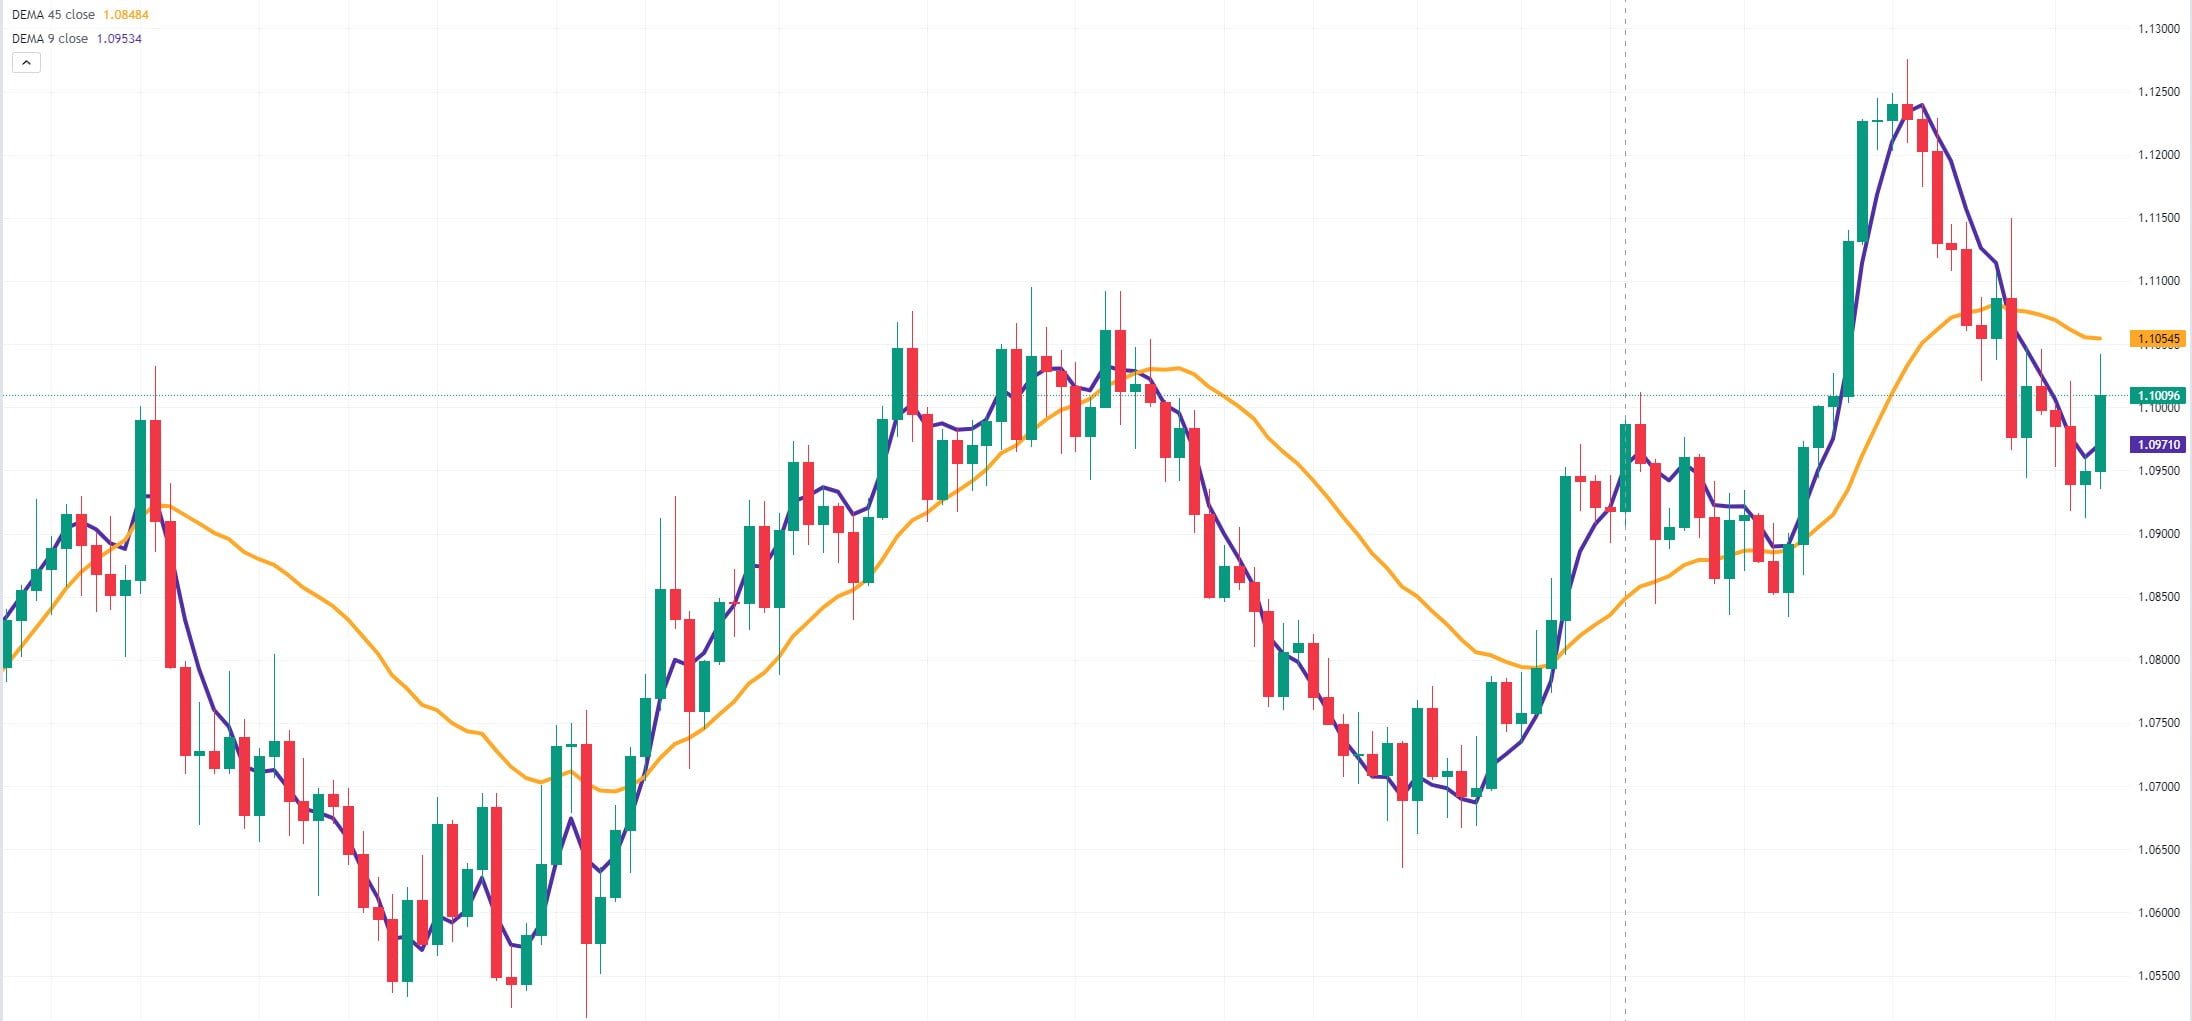
When the fast DEMA crosses above the slow DEMA, it signals a potential opportunity to buy. On the other hand, when the fast DEMA crosses below the slow DEMA, it can be a signal to sell. These crossover points are key moments where the market’s momentum may be shifting, providing traders with potential entry and exit points for their trades.
There are several key benefits to using the DEMA Crossover Strategy:
- Reduced lag: The DEMA calculation reduces the lag that can be present in traditional moving averages, providing more timely signals for traders.
- Flexibility: Traders can adjust the DEMA periods to suit their trading style and the specific market they are trading in. Shorter periods will result in more frequent signals, while longer periods can provide more reliable signals.
- Applicability: The DEMA Crossover Strategy can be applied to any market and any timeframe, making it a versatile tool for all traders.
It’s important to note that, like all trading strategies, the DEMA Crossover Strategy is not infallible. It should be used in conjunction with other technical analysis tools and risk management techniques to increase its effectiveness and protect against potential losses. For example, traders may use support and resistance levels, or other indicators such as the Relative Strength Index (RSI), to confirm the signals generated by the DEMA Crossover Strategy.
In addition, it’s crucial to backtest any new strategy before applying it to live trading. This involves testing the strategy on historical data to see how it would have performed in the past. While past performance is not a guarantee of future results, backtesting can provide valuable insights into a strategy’s potential strengths and weaknesses.
4.2. Combining DEMA with Other Indicators
When delving into the world of trading, the Double Exponential Moving Average (DEMA) can be a powerful tool in your arsenal. But to truly harness its potential, it’s wise to pair it with other technical indicators. This combination can provide you with a more holistic view of market trends, and ultimately, lead to more informed trading decisions.
For instance, consider integrating DEMA with the Relative Strength Index (RSI). The RSI gauges the speed and change of price movements, making it a valuable tool for identifying overbought or oversold conditions. When used in conjunction with DEMA, these two indicators can provide a potent strategy for both entry and exit points. When the DEMA line crosses above the price line while the RSI is below 30, this could signal a potential buying opportunity. Conversely, if the DEMA line crosses below the price line and the RSI is above 70, it may be time to consider selling.
- MACD (Moving Average Convergence Divergence) is another indicator that pairs well with DEMA. By measuring the relationship between two EMAs, MACD can help traders identify possible buy and sell points. When the MACD line crosses above the signal line, it’s generally a bullish signal – potentially a good time to buy. If the MACD line crosses below the signal line, it’s often a bearish signal, and might be a good time to sell. Combining this with DEMA can provide a more robust strategy for identifying market trends.
- Traders may also consider combining DEMA with Bollinger Bands. This indicator uses a set of trendlines plotted two standard deviations away from a simple moving average. Bollinger Bands can help identify volatility and price levels that are overbought or oversold. Pairing this with DEMA can provide a more comprehensive view of market conditions.
Remember, while combining DEMA with other indicators can enhance your trading strategy, it’s essential to understand that no strategy is foolproof. Always consider other market factors and use a risk management strategy to protect your investments.
4.3. Risk Management in DEMA Trading
In the high-stakes world of DEMA trading, risk management is a critical component that can make or break your trading journey. It’s the safety net that can save you from devastating losses and keep your trading account afloat during volatile market conditions.
Setting Stop-Loss and Take-Profit Points is a fundamental aspect of risk management. Stop-loss points are set at a predetermined level below the entry point to limit potential losses, while take-profit points are set above the entry point to secure profits when the price reaches a certain level. This way, you’re not only protecting your capital but also locking in profits.
Implementing a Risk-Reward Ratio is another crucial step. This ratio helps determine the potential reward for every dollar at risk. A common ratio used by traders is 1:3, meaning for every dollar risked, the potential profit is three dollars. This allows traders to remain profitable even if they lose more trades than they win.
- Position Sizing is an often overlooked aspect of risk management. It involves determining the size of the trading position based on the amount of risk you’re willing to take. By risking only a small percentage of your trading capital on each trade, you can ensure that even a series of losses won’t wipe out your account.
- Diversification is another key strategy. By spreading your investments across different assets, you can mitigate the risk associated with any single asset. Diversification can be achieved by trading different currency pairs, commodities, or even venturing into the realm of cryptocurrencies.
- Finally, Regular Monitoring of your trades and market conditions can help identify potential risks early on. This includes keeping an eye on economic calendars, news events, and changes in market trends. Regular analysis and adjustment of your trading strategies based on these factors can help manage risk effectively.
In the end, risk management in DEMA trading is about finding a balance. It’s about understanding the risks, taking calculated decisions, and being prepared for all possible outcomes. It’s not about eliminating risk entirely – because that’s impossible – but about controlling it to a level that aligns with your risk tolerance and trading goals.