1. Understanding Elder Force Index
If you require more advanced charting capabilities to test the Fisher Transform, we can recommend Tradingview.
The Elder Force Index stands as a dynamic technical indicator developed by Dr. Alexander Elder. It serves the purpose of illustrating the amount of power that drives buying and selling movements of a security within a specific trading period. The magnitude of the index is measured by incorporating the direction, extent, and volume of the price changes.
The formula employed by the Elder Force Index derives the change in price by subtracting the previous period’s closing price from the current period’s closing price. This value is then multiplied by the volume of the current period, thus incorporating the significance of volume to the price change.
Utilizing this indicator within a trading strategy involves observing the peaks and troughs of the index in relation to the stock’s price movements. Oscillations around the zero line of the Elder Force Index provide insight into the balance of buying and selling pressures. Positive values suggest buying pressure whereas negative values indicate selling pressure. Traders can track these movements to predict potential short-term price reversals and establish suitable entry or exit points. Additionally, combining this tool with other indicators and chart patterns can enrich its predictive power, leading to more informed trading decisions.
In the realm of trading, the Elder Force Index offers an effective method to assess the strength behind the price changes of any given security. Despite its simplicity, this tool embeds crucial insights about market dynamics and aids traders in refining their strategies to enhance their market performance.
1.1. Concept of Elder Force Index
The Elder Force Index finds its roots in two essential factors – direction and extent of price change. Invented by expert trader Dr. Alexander Elder, it remains pivotal in technical analysis. Any extreme, abnormal, or unexpected shift in an asset’s price spawns a significant change in the Force Index, indicating a potential market reversal or a new trend onset. Presented as an oscillator, the Force Index ethereally swings around a zero line. A positive value signals upward price pressure, while negative values hint at downward price pressure.
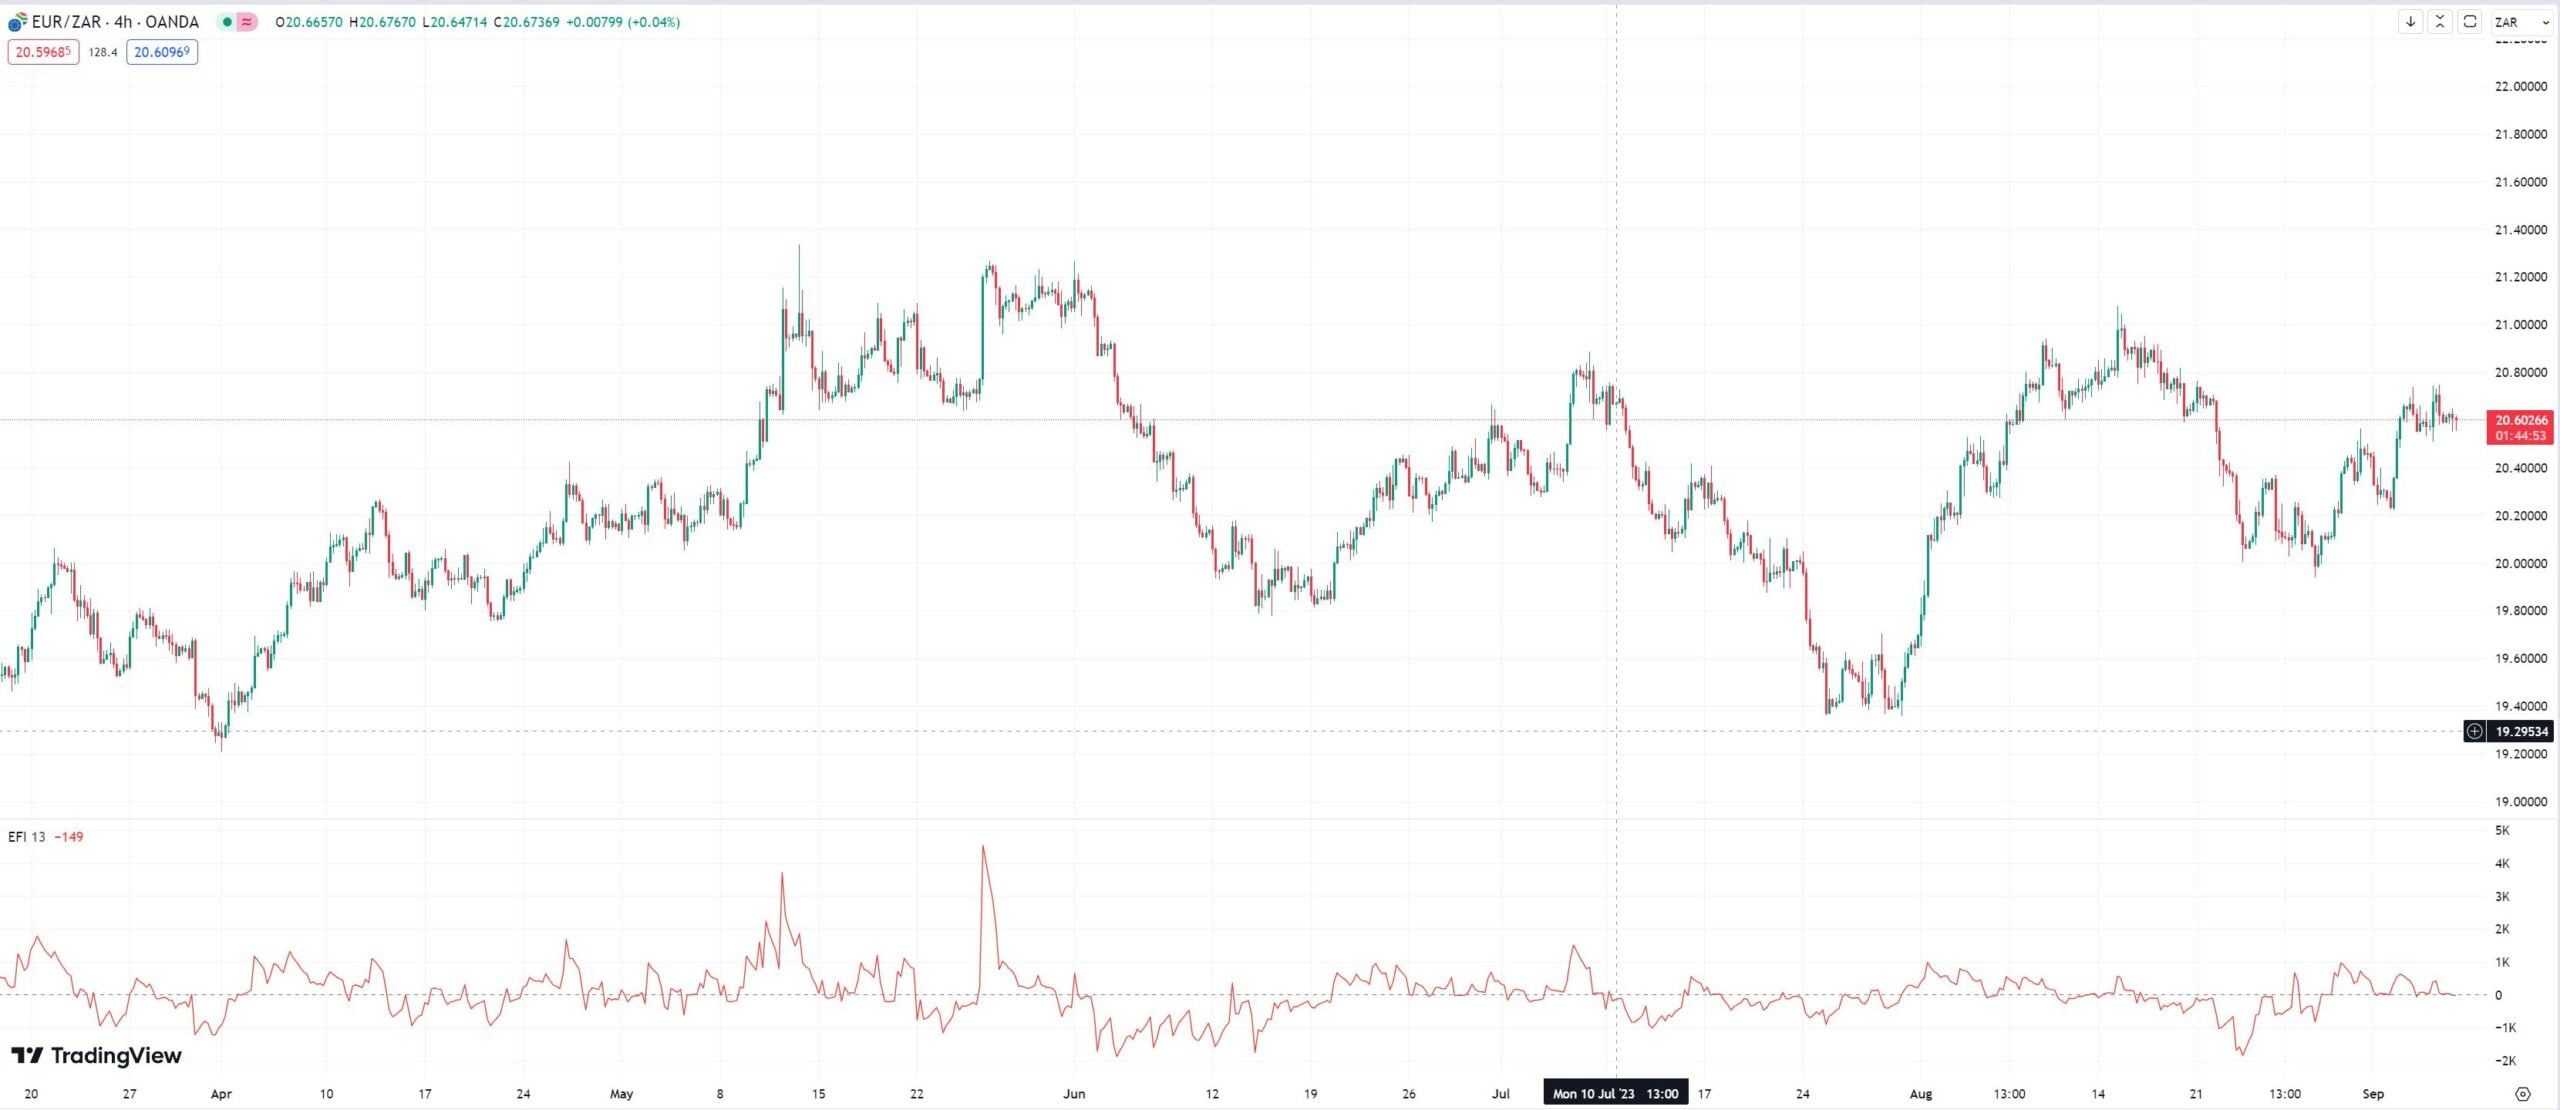
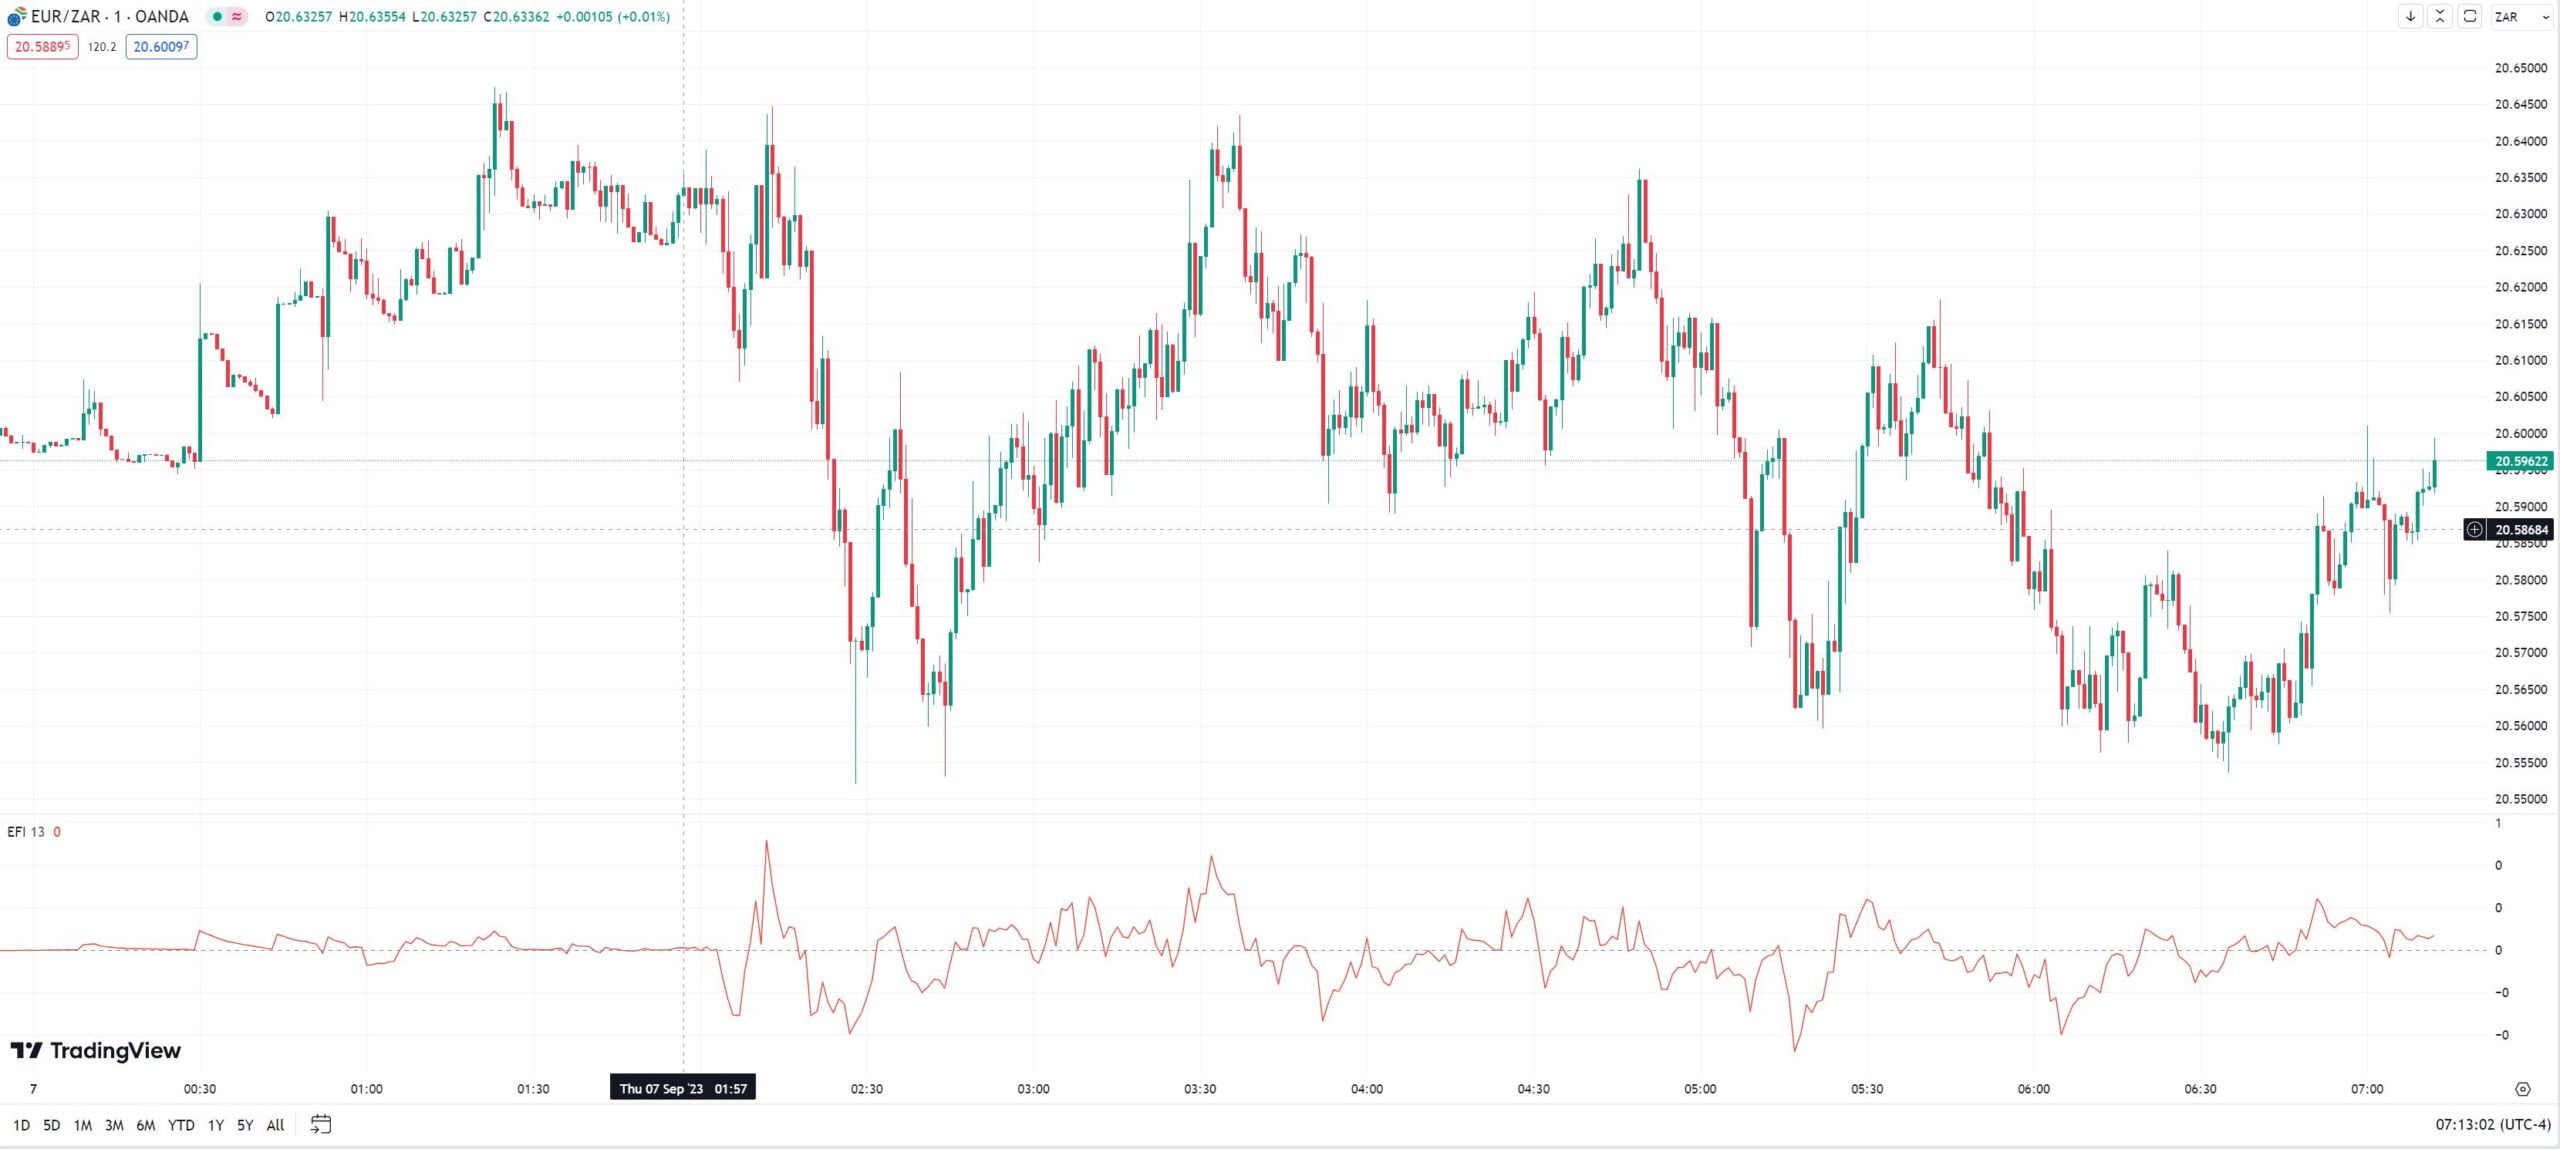
Combining both price and volume data, the Elder Force Index magnifies the force behind each price move. It is calculated as the product of a period’s price change and its respective volume, thus accommodating directional sentiment and market intensity. As a potent weapon in a trader’s arsenal, it can be deployed over short (13 periods), intermediate (22 periods), and long-term (100 periods) horizons. The choice of period depends on individual trading goals and investment duration.
Elder Force Index also assists in identifying divergence – a powerful signal warning of potential price reversals. Positive divergence occurs when the asset price hits a new low, while the Force Index makes a less deep dip. On the other hand, negative divergence emerges when the asset price skyrockets to a new high, but the Force Index fails to follow suit, indicating potential bearish reversal. Therefore, a comprehensive understanding and watchful eyes on the Elder Force Index can anticipate important market movements, reinforcing crucial trading decisions.
Crucially, the Elder Force Index should not be utilized in isolation. It is paramount to cross-verify its signals with other indicators or chart patterns for additional confirmation, enhancing the trading strategy and minimizing potential pitfalls. An astutely incorporated Elder Force Index can significantly optimise the risk-reward scenario in trading, crucial for both fledgling enthusiasts and veteran traders.
1.2. Importance in Trading
Trading carries inherent risks and requires a great deal of precision and knowledge. Instruments like the Elder Force Index (EFI) emerge as powerful aids, assisting traders in gauging the flow and strength of money in and out of securities. The EFI is not just another technical analysis tool, it is rather a force multiplier in trading.
Built on the principle of volume-momentum theory, where volume precedes price movement, EFI offers traders insights into underlying dynamics of the market. This proven indicator directly measures the buying power during an upward trend against the selling pressure in a downward trend. In essence, it paints a clear picture of the directional strength of the market.
Belonging to the oscillator family, EFI oscillates above and below the zero line. Positive values indicate bullish market pressure while negative values signify bearish tendencies. This dynamic visualization equips traders to anticipate potential market swings, thereby aligning their positions proactively.
Enhanced decision-making is critical in trading, and EFI provides traders with an edge via multiple approaches. Whether it’s identifying the start of a new trend during a crossover of the zero line, spotting potential trend reversions through divergence, or unearthing overbought or oversold market conditions, EFI serves as a comprehensive diagnostic tool.
Moreover, EFI’s usage isn’t confined to independent trading signals; it excels equally well in confirmation roles. By cross-verification with other technical indicators, EFI aids in minimizing false signals and maximizing trade efficiency.
Incorporating the EFI into a trading strategy brings forth a higher level of sophistication. It fine-tunes decision-making, illuminates the interaction between price and volume, and empowers traders to stay ahead of the curve. Hence, understanding and effectively employing the EFI is synonymous with deepening mastery in trading.
2. Calculation of Elder Force Index
Elder Force Index calculation is constituted by a series of critical steps. The measurement of the force is the fundamental stage. This force calculation involves three data points – current day’s high, low, and close. The formula employed in the force calculation incorporates the multiplication of the current day’s volume by the difference in the current day’s price and the previous day’s price.
To attain the Elder Force Index, a 13-day exponential moving average (EMA) is then applied to the previously calculated force. This EMA strategy collates all the signals from the force index over a specified period.
Subsequently, the trading signals are deciphered from the force index. A bull market, for example, is indicated by a positive force index, and contrarily, a bear market is signposted by a negative force index. Incidentally, bullish or bearish divergences may hint at a potential market reversal.
It’s imperative to note that, along with the interpretation of respective index values, the Elder Force Index should always be used in combination with other trading indicators and tools for a robust and comprehensive trading strategy. The alignment with wider trading plans is hence necessary to enhance the effectiveness of the Elder Force Index.
In the realm of technical analysis, the Elder Force Index is acknowledged for its proficient detection of changes in power, direction, and volatility of a price. This, in conjunction with other tools, makes it an indispensable aid to traders, empowering them to strategize their moves aptly while avoiding irrational trading decisions.
2.1. The Formula Behind It
Devised by Dr. Alexander Elder, the Elder Force Index is much more than a mere trading tool. At the heart of this innovative approach is a formula designed to uncover the underlying forces of the market. By focusing on volume, direction and extent, the Elder Force Index utilises a three-pronged approach that covers every crucial aspect of price movement.
Volume is a statistical measure of the number of stocks traded, and the magnitude of their transactions. Incorporating volume measurements into the formula adds a crucial layer of depth. Traders gain a more comprehensive view, understanding not just the direction of price movements, but the momentum behind them.
Functioning as the compass of this formula is direction. By recognising and measuring price changes, direction adds context, offering insight into potential market trends. It is the arrow that guides traders towards profitable decisions, building a path of least resistance.
Last, but not least, is extent. Used to calculate the size of the price change from one period to the next, extent adds the final piece to the puzzle. It refines the details, offering precision, and allowing traders to gauge the strength or weakness of price movements.
Often mistaken as a mere trading strategy, the Elder Force Index is nothing less than a tactical formula for success. Incorporating volume, direction, and extent provides traders with a comprehensive, detailed, and insightful guide to navigating the choppy waters of the stock market. A formula crafted by a professional trader, aimed at anyone wishing to understand the ebb and flow of the markets.
3. Interpretation of Elder Force Index
Understanding the intricacies of the Elder Force Index can steer trading strategies towards a wealth of potential profits. Primarily, this technical indicator visualizes the power behind a price movement during a specified period. Its calculation incorporates three essential factors: direction, extent, and volume.
The direction component signifies whether the market is moving upwards or downwards. A positive value indicates upward momentum, while a negative value shows a downward trend. This data enables trend-following traders to make informed buy or sell decisions.
The extent measures the potency of the price change within the chosen period. A larger absolute value of the Elder Force Index suggests a stronger move. This is particularly beneficial for swing traders as it helps identify potential price reversals.
The crucial volume factor is the asset’s trading volume during the period. A higher volume implies more significant market activity and, usually, stronger price moves.
When interpreting the Elder Force Index, two primary considerations stand out: its value and direction. A positive value reinforces the likelihood of an upward trend, while a negative value indicates a possible downward trend. The direction indicates an increase or decrease in the force of a trend. Upward direction in a positive Elder Force Index points towards a strengthening upward trend, while a downward direction in a negative value suggests a strengthening downward trend.
In tandem with other technical analysis tools and proper risk management, the Elder Force Index can hugely enhance the potential for increased trading profits. Through decisive interpretation of its values, traders can successfully forecast market changes, allowing for more tactical, lucrative trades.
3.1. Principles of Elder Force Index Reading
Understanding the Elder Force Index reading is akin to mastering a strategic tool in the trading world. A product of the genius mind of Dr. Alexander Elder, the Elder Force Index quantifies the power behind a price movement. Regardless of the direction, it portrays how strong or weak the forces are that push prices up or down. Interpreting the principles of this reading allows traders to make informed decisions based on the combined power of three essential factors: direction, extent, and volume.
Direction is the path a price takes, either upwards or downwards, and the index denotes this with a positive or negative value. Extent refers to the size of the gap between today’s and yesterday’s close prices. A greater extent on a particular trading day implies stronger forces that day. The last factor, Volume, makes the index unique, as it takes into account the number of shares traded. A day with high volume signifies remarkable investor sentiment, captivated by the index.
Diving into further complexity, traders observe two primary dynamics in Elder Force Index readings—a raw Force Index and smoothed Force Index. Given its sensitivity to price fluctuations, the raw Force Index enhances trading strategies when a security is trending. However, for a broader analysis, a smoothed Force Index helps filter out ‘noise’ and facilitates a clear perception of significant market trends.
The application of this powerful tool often finds its place along with other trading strategies. Traders incorporate the Elder Force Index together with exponential moving averages and support-resistance levels to craft effective investment strategies.
3.2. Trading Signals Indicated by Elder Force Index
The Elder Force Index (EFI) derives its cues from equities volume and price direction, transforming these into potent trading signals. An intuitive manifestation of market course, the EFI gauges two essential factors. Direction and Magnitude are the propelling factors. When observing a positive EFI, anticipate upward price movement. Conversely, a negative EFI is indicative of potential downturns.
Trading signals are distinguishable when marked changes in the EFI trajectory occur. Zero Crossover telegraphs an imminent shift in price direction. EFI crossing above zero foretells an upward price shift. Alternatively, an under zero crossover anticipates a downturn.
The innovative Divergence signal, another jewel in the EFI arsenal, bestows its utility on identifying discrepancies between price trends and EFI movement. The existence of bullish divergences forecasts an impending bullish run. In contrast, bearish divergences warn us of price pullbacks on the horizon.
Trading signals are available in abundance with EFI. A perfect harmony of price, volume, and index interaction, the keynote to EFI remains the Two-Day EMA. When EFI surges above or plunges below the EMA line, it creates a bullish or bearish signal respectively. It’s pertinent to note, prompt action yields the highest rewards.
4. Application of Elder Force Index into Trading Strategy
 If you require more advanced charting capabilities to test the Fisher Transform, we can recommend Tradingview.
The Elder Force Index (EFI) is a unique indicator that combines price and volume data to quantify the amount of power (force) behind a price move. Its versatility allows it to be applied within a variety of trading strategies, from spotting trend reversals to pinpointing favorable entry and exit points.
One primary use involves identifying the start and end of potential trends. For instance, when the EFI is above zero, it indicates buying pressure. When it falls below zero, it suggests selling pressure. Observing these shifts can indicate the possible beginning of a new trend.
Another application is to employ the EFI alongside a smoothing moving average to distinguish between short-term noise and larger, meaningful trends. A trader could lay a 13-day exponential moving average on the EFI line, for example, to better discern powerful price movements from temporary, inconsequential price fluctuations.
Furthermore, the Elder Force Index is often used to spot divergence between the index and the price. If a stock’s price is making higher highs but the EFI is not, or a stock’s price makes lower lows but the EFI doesn’t follow suit, it might suggest a pending reversal. This opposing movement signals a weakening trend and could be a hint to be ready for a potential trend shift.
Lastly, the EFI can be deployed to confirm signals from other trading strategies or indicators. Like other indicators, the EFI is most effective when used in conjunction with other tools. It can serve as a confirmation tool, strengthening the validity of signals from other indicators, and ensuring that the “force” is on the trader’s side.
4.1. Incorporation with other Trading Tools
The versatility of the Elder Force Index does not limit its potential to just a stand-alone tool. Indeed, combining this capable asset with other robust trading equipment gives traders a multidimensional view of the market, reinforcing decision-making aptitude. For instance, integrating the force index with trend-based tools like Moving Averages establishes prudent buy or sell signals grounded on robust market dynamics. Pending crossover of the moving average line by the Elder Force Index indicates an imminent reversal, hence a call to action for traders. In contrast, when the EFI hovers above or below zero, it often implies healthy trends that Moving Averages might not always pinpoint. Moreover, when an overbought or oversold status is signaled by an oscillator like the Relative Strength Index (RSI), coupling this information with the EFI can confirm or dismiss such conditions. The Elder Force index can denote whether the strong buying pressure genuinely represents an overbought situation, with feeble buying figures potentially belying an overrated RSI. Pairing EFI with these tools inherently elevates the trading strategy, fostering a more nuanced interpretation of market rhythm.
4.2. Designing Trading Strategy with Elder Force Index
Designing a trading strategy with Elder Force Index entails a mix of technical analysis and intuition, with a focus on dynamic market trends. The Elder Force Index is a key tool in the arsenal of many traders, offering valuable insights into market developments. It is a two-step system built upon the principles of power and direction, two-shaded histogram and three categories of bars. The intent rests firmly on enhancing the decision-making process.
Power and direction form the backbone of the Elder Force Index. Traders should take note that the index measures the power behind a price move in conjunction with underlying direction. The power is determined by volume, while the direction refers to the up or down movement of the stock.
Two-shaded histogram, a unique feature of Elder Force Index, offers an instant visual of market strengths. The colour of the histogram changes based on the closing price. This is designed to quickly demonstrate if the bulls or bears are in control.
Three categories of bars are used to differentiate between various market trends – the Climax Bar, the High-Volume Churn, and the Low-Volume Churn. Each bar has a distinct role in the market analysis, helping traders make informed strategic decisions.
It should be noted that the Elder Force Index does not work in isolation. Using other technical analysis tools in conjunction with the index adds an additional layer of certainty to trading decisions.
5. Pitfalls and Limitations
Even though the Elder Force Index (EFI) has been admired for its capacity to highlight the power behind a price movement and predict possible reversals, it’s not exempt from potential pitfalls and limitations. One of the major issues observed is its susceptibility to produce false signals. Similar to other technical indicators, EFI can occasionally point towards a reversal, only for the asset’s price to continue in the original direction. It is, therefore, prudent to complement it with other tools for more reliable signals.
Moreover, the index’s reliance on volume and price change can lead to misinterpreted conclusions. Markets with high liquidity and volatility can register strong EFI readings merely due to their volume and not necessarily due to strong buying or selling pressure.
Traders must also stay wary of potential lag. Since EFI is a lagging indicator, responses to sudden changes in market conditions might be delayed, which could hinder decision-making in fast-paced trading environments.
Lastly, while the formula itself is simple, correctly interpreting its values can pose a challenge to novice traders. It’s not only about positive or negative readings. Understanding the significance of the volume of change is fundamental, and without a comprehensive understanding, the application of the Elder Force Index might lead to prudent trading strategies backfiring.
5.1. Drawbacks of Dependence on Elder Force Index
While the Elder Force Index (EFI) proves a powerful tool in a trader’s arsenal, it isn’t without its own set of drawbacks. Notably, relying solely on EFI can be a dangerous game, mainly due to its sensitivity to market volatility. The EFI tends to generate false signals during highly volatile periods. These false indications, if not complemented by additional market analysis, can lead to severe financial losses.
Moreover, Elder Force Index does not provide any indication of trend direction. The EFI is designed to gauge the power behind a price move but identifying the direction is a trader’s responsibility. Absence of any directional clue can leave traders vulnerable to misleading signals.
Furthermore, its effectiveness can decrease in choppy markets. The infuriating aspect of trading choppy, non-trending markets (which are frequent) is the frequent crossovers, creating an overabundance of buy and sell signals. Adopting aggressive trading strategies based on these signals in these conditions can lead to increased losses.
An over-dependence on EFI can render a trader helpless in the aforementioned situations. Therefore, it is prudent to use the EFI as part of a trading system, in conjunction with other technical analysis tools. By doing so, traders can correct the inherent weaknesses and inaccuracies of the Elder Force Index and bring a balance to their trading decisions.
5.2. Dealing with False Trading Signals
False trading signals can be a major stumbling block for traders utilizing the Elder Force Index (EFI) as a part of their trading strategy. These deceptive signals, which appear to indicate a trend where one does not truly exist, can lead even the most seasoned traders to make incorrect decisions.
The key to dealing with false trading signals lies in understanding how these false positives occur. False signals often emerge when there’s substantial market noise or short-term volatility. Such scenarios can distort the true trend and cause a misinterpretation of the market condition.
One potential strategy to handle this issue is by filtering out market noise. This can be done by leveraging longer time frames, which can provide a broader perspective and help distinguish genuine trading signals from mere noise. The EFI is recognized for its efficiency over longer periods, making it excellent for this approach.
Another strategy involves combining EFI with other technical indicators to corroborate the expected trends. Such a multi-dimensional analysis can provide robust proof of market movements, reducing the likelihood of falling for false signals. Using this method, the EFI can be coupled with indicators like Moving Average Convergence Divergence (MACD) or Relative Strength Index (RSI) to validate the trading signals more accurately.
A balanced approach, being aware of the potential for false signals, and implementing helpful strategies can significantly mitigate the risk tied to these false positives. This will enable traders to more effectively utilize the EFI within their trading strategies. Avoiding these false signals will align trading activities more closely with the actual, rather than incorrectly perceived, market trends.