
What is the Linear Regression Line Formula for Trading?
The linear regression line formula is y = mx + b. In trading terms, this means:
- y = predicted price
- m = slope (trend direction)
- x = time period
- b = starting point (y-intercept)
This formula finds the “best fit” line through price data. “The Linear Regression Indicator plots the ending value of a Linear Regression Line for a specified number of bars, showing where the price is expected to be,” according to Fidelity.
Here’s How Traders Use the Linear Regression Line Formula
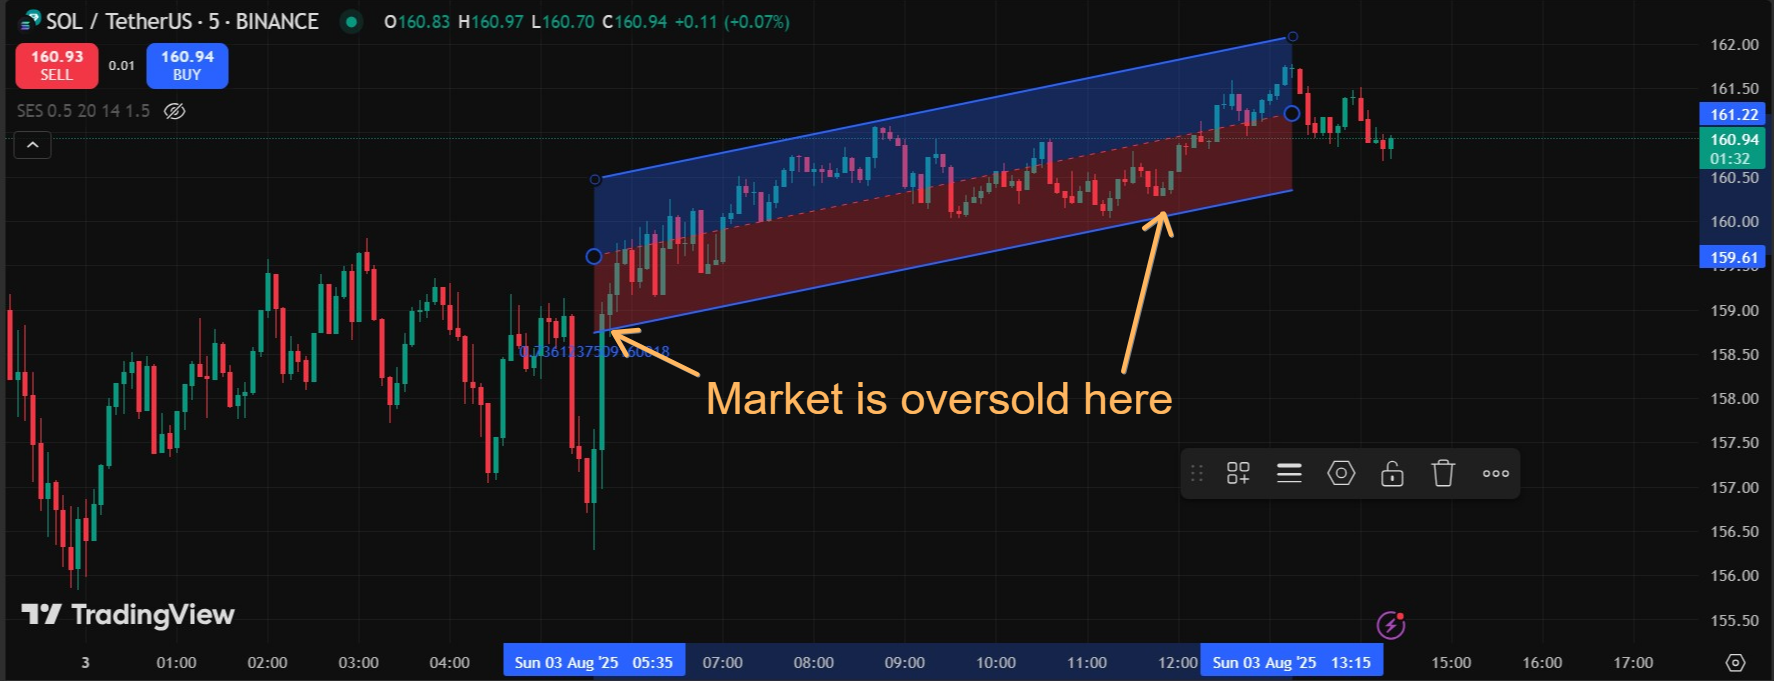
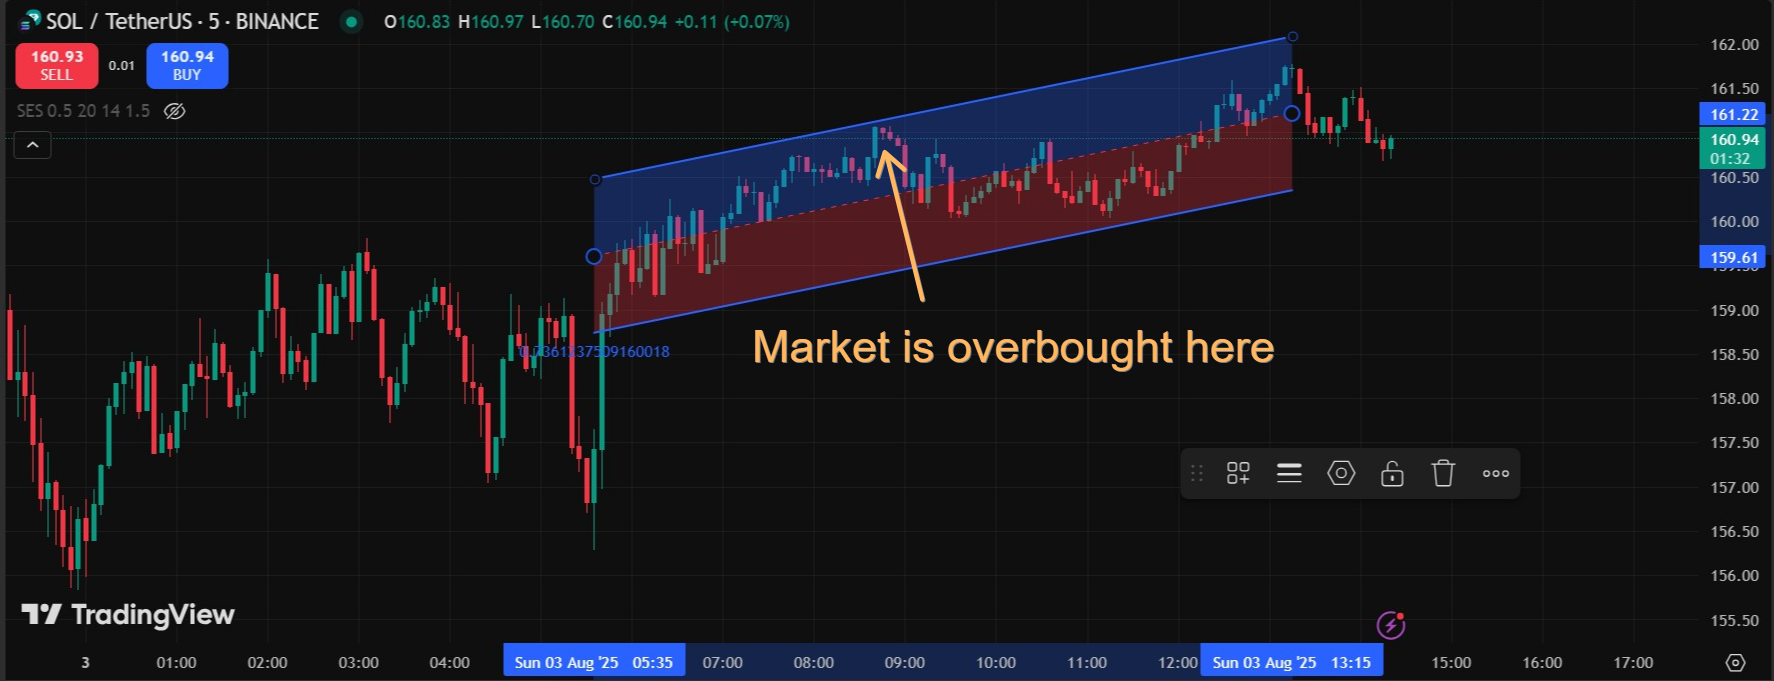
When the price moves above the regression line, it suggests the market is overbought. When the price drops below the line, it indicates the market is oversold. This gives you clear buy and sell signals.
The formula works better than moving averages because it predicts where the price should go. Moving averages only show where the price has been. Linear regression shows you the fair value right now.
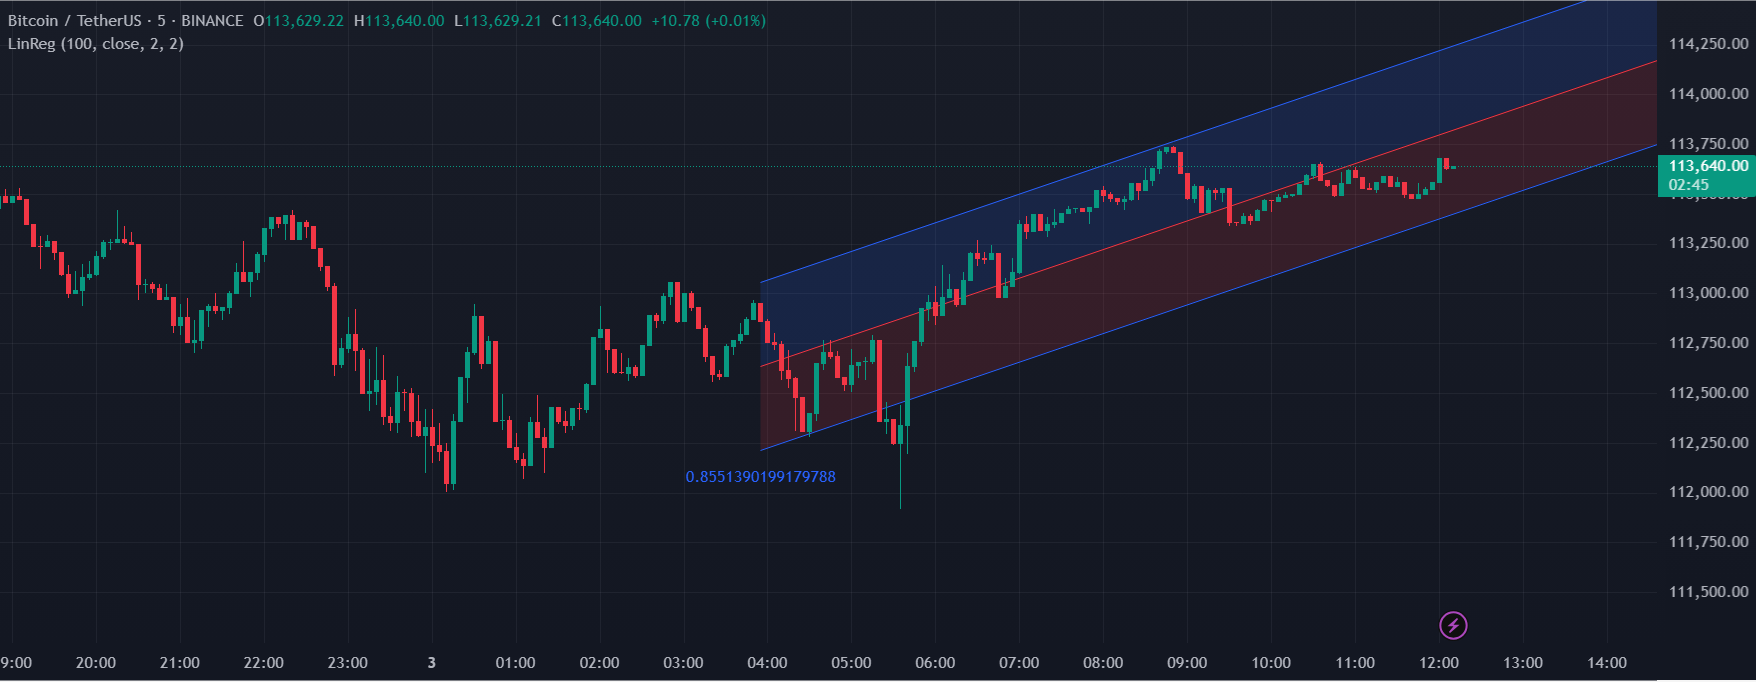
Example: If Bitcoin is trading at $113,640 but the linear regression line shows $114,000 or higher, Bitcoin might be underpriced. Smart traders would consider buying.
Linear regression serves as a technical indicator to predict future prices based on historical data, making it invaluable for traders seeking mathematical precision in their analysis.
What is Linear Regression Channel?
A Linear Regression Channel uses three parallel lines to show you trading opportunities. The middle line is your linear regression formula line (y = mx + b). The upper and lower lines sit equal distances away from the middle line.
Here’s what each line does:
- Middle Line: Shows fair value where the price should be
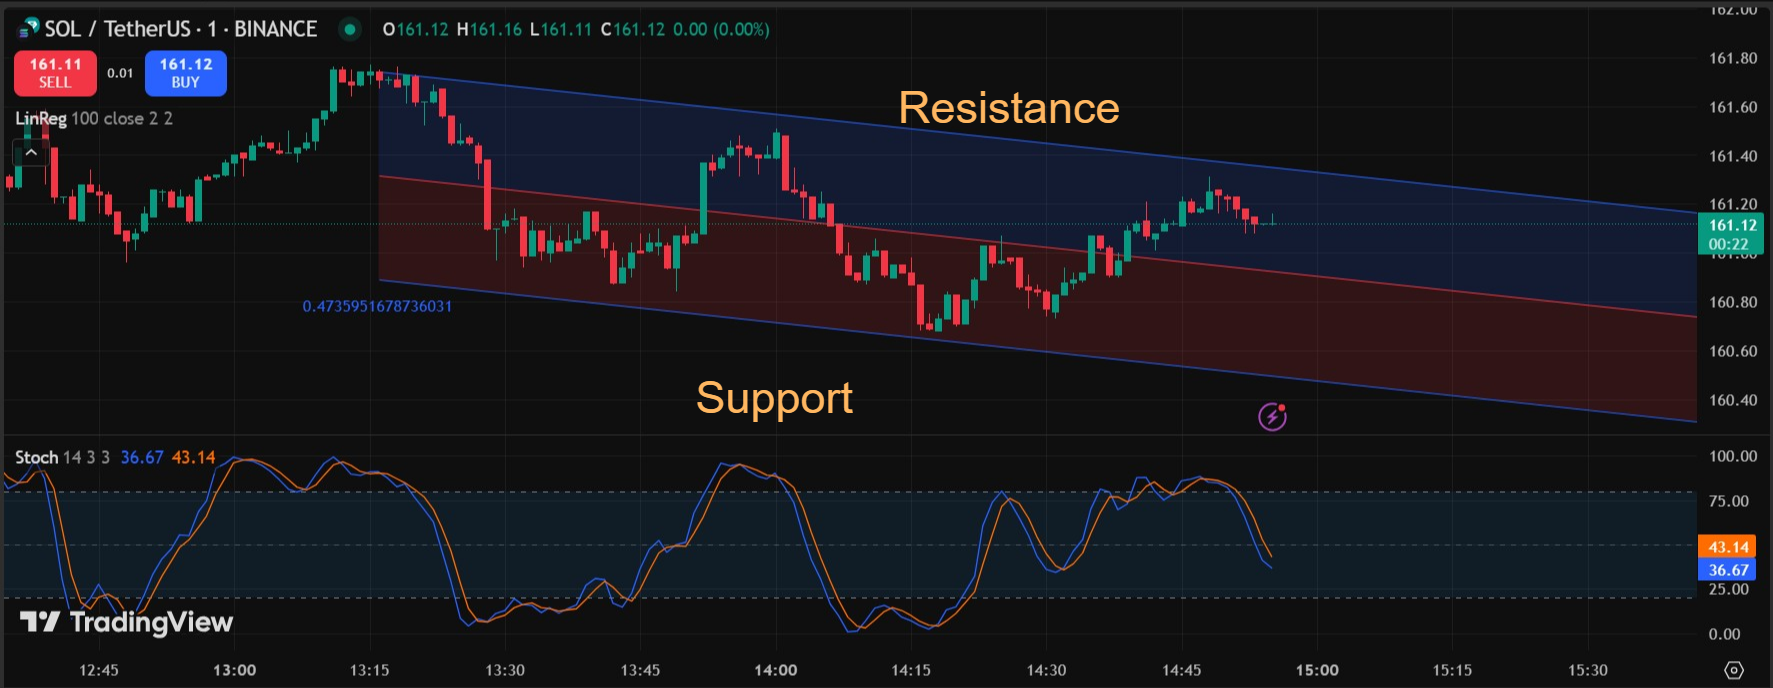
- Upper Line: Acts as resistance (selling zone)
- Lower Line: Acts as support (buying zone)
Important: The channel changes as new price data comes in. Many beginners get confused by this. Remember, this is normal. The channel adapts to current market conditions automatically.
Unlike static trend lines that you draw yourself, linear regression channels update every bar. This gives you fresh signals without redrawing lines manually.
| Channel Component | Function | Trading Signal |
| Upper Line | Resistance Level | Sell/Short Signal |
| Middle Line | Fair Value | Trend Direction |
| Lower Line | Support Level | Buy/Long Signal |
How to Use Linear Regression Channel for Trading?
You can either use the Linear Regression Indicator for auto analysis or the Regression Trend Tool for manual analysis.
Method 1: Using the Linear Regression Indicator
The indicator automatically calculates and plots regression channels based on a specified period:
Step 1: Open your favorite currency chart in a 1-hour timeframe.
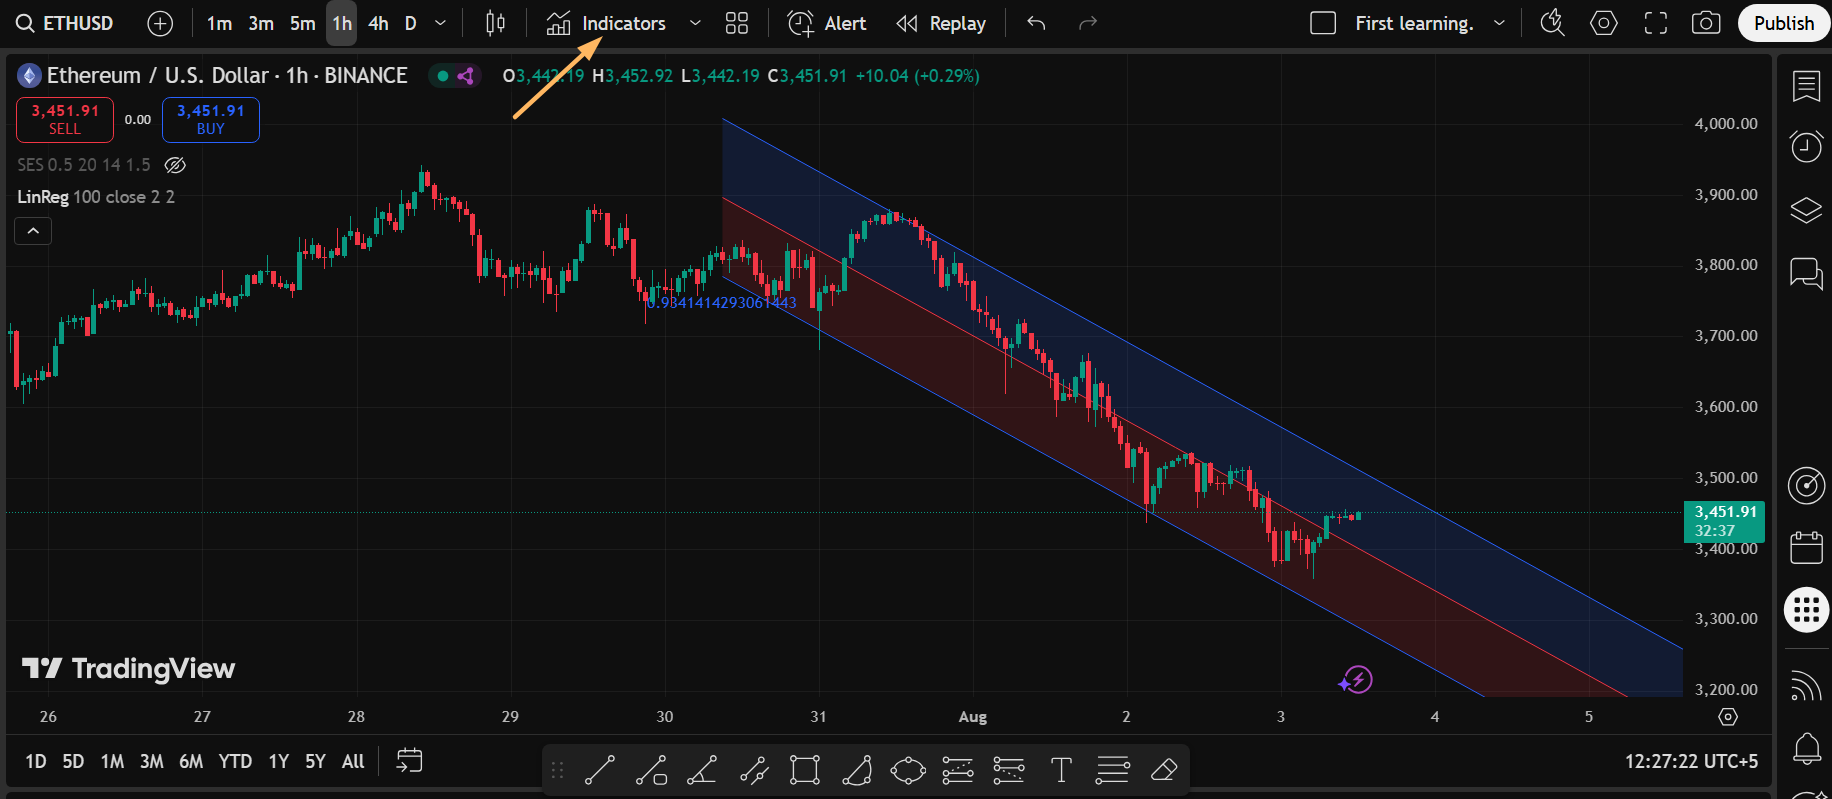
Step 2: Look for the “Indicators” tab at the top of the chart.
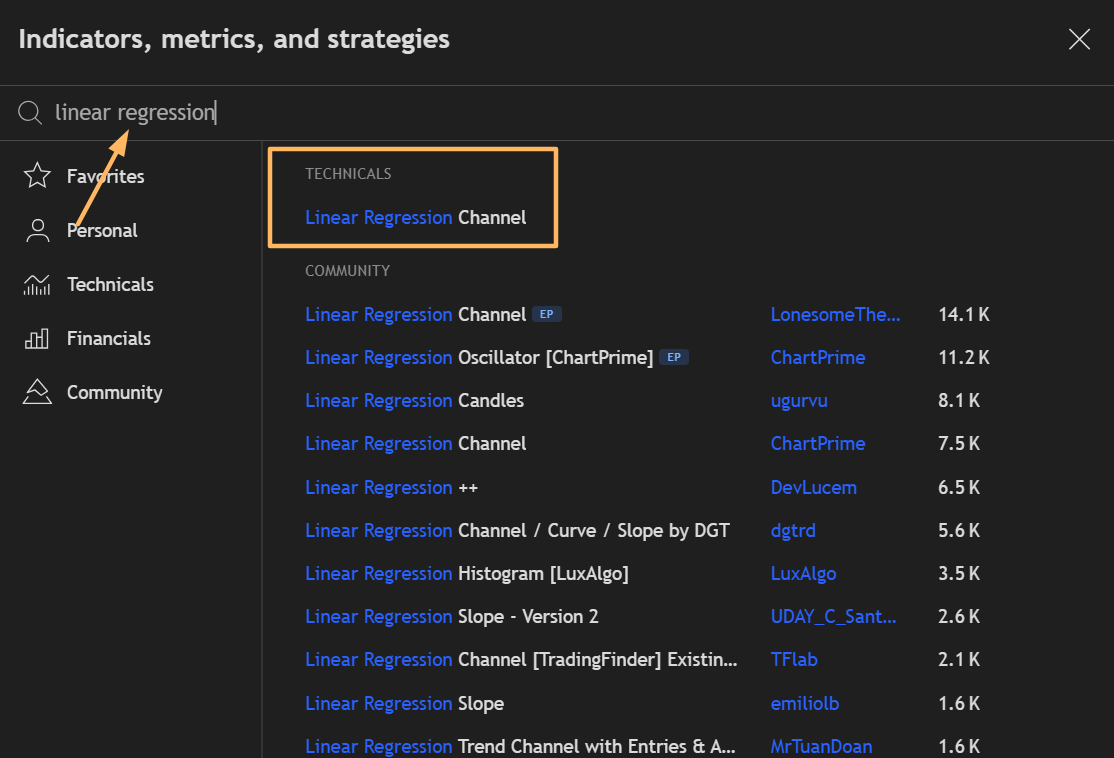
Step 3: Type “Linear Regression Channel” in the search bar.
Step 4: Choose the built-in indicator
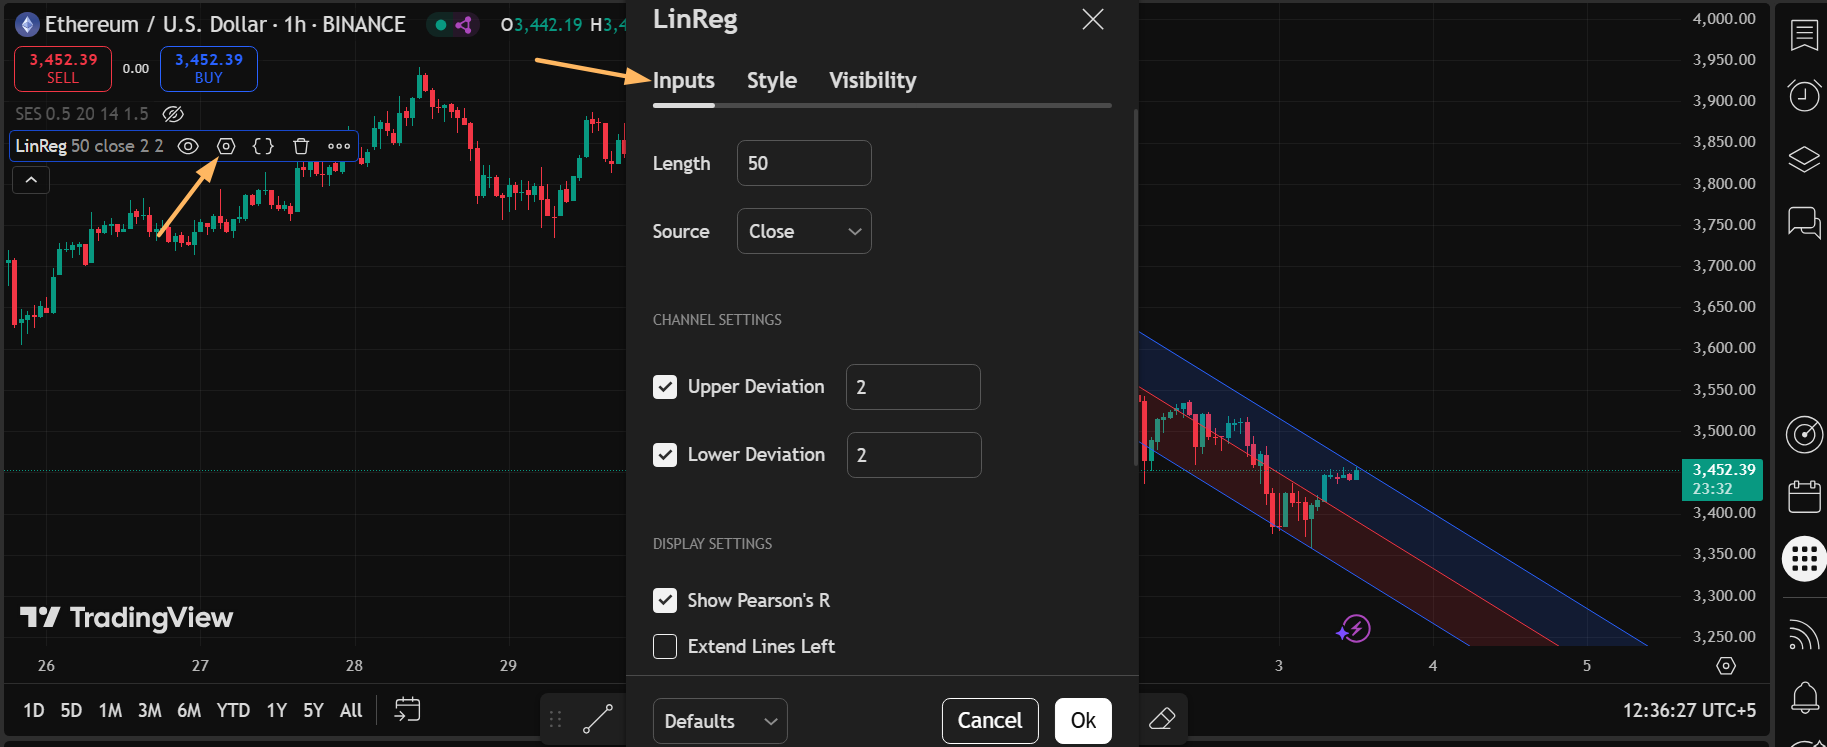
Step 5: Configure the settings of the indicator for the optimum results. On the left side, find the name of the indicator and click the settings icon next to it.
- Length: Set to 50 (for 50-period calculation)
- Source: Keep as “Close”
- Standard Deviation: Set to 2.0
- Extend Lines: Enable for future projections
Method 2: Using the Manual Drawing Tool
You can also do manual calculations using the regression drawing tool. It lets you select specific price points for custom analysis:
Step 1: Click the drawing toolbar on the left side and find the “Regression Trend.”
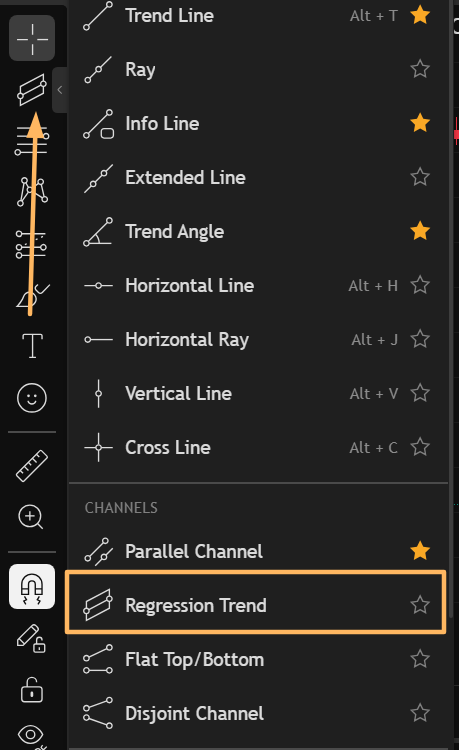
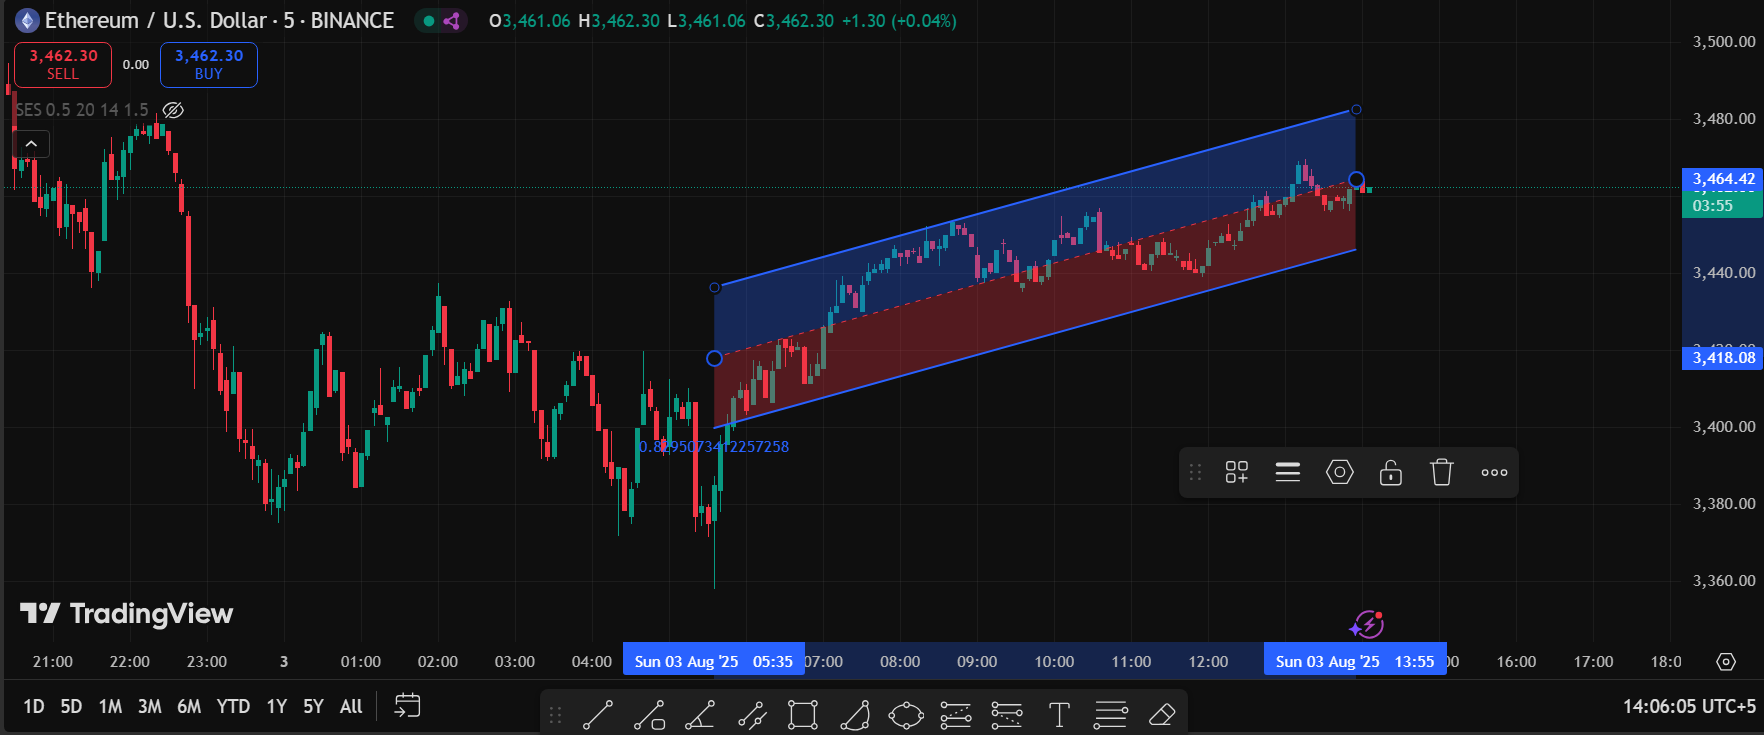
Step 2: Find your start point. Find your lowest and highest in the chart. Connect both ends to launch the tool.
Step 3: Drag endpoints to fine-tune or adjust the channel as per your needs.
How to Select the Right Linear Regression Channel Length?
Channel length determines how many price bars the formula uses. This is crucial for accurate signals. Here’s how you can select a right linear regression channel length:
| Trading Style | Recommended Length | Timeframe | Why It Works |
| Scalping | 10-20 periods | 1-5 minute charts | Catches quick moves |
| Day Trading | 20-50 periods | 15-60 minute charts | Balances speed and accuracy |
| Swing Trading | 50-100 periods | 4 hours to daily | Filters market noise |
| Position Trading | 100-200 periods | Daily to weekly | Shows major trends |
Quick Insight: “Draw a regression channel on a large timeframe to check the current trend. Wait for a signal on a smaller timeframe.” This multi-timeframe approach reduces false signals significantly.
Linear Regression Channel Settings
Your channel settings determine signal quality. Here are the proven configurations:
| Parameter | Conservative | Balanced | Aggressive |
| Length | 100 periods | 50 periods | 20 periods |
| Standard Deviation | 2.5 | 2.0 | 1.5 |
| Best For | Long-term trends | Most traders | Quick scalping |
| Signal Frequency | Low | Medium | High |
| Accuracy | High | Good | Moderate |
How to Get Buy and Sell Signals Using Linear Regression Channel
You can use linear regression channels to get buy or sell signals. However, the exact strategy depends on your analysis. This section is just for educational purposes. Here is how you can utilize the linear regression channel to understand the market signals:
Buy Signals:
- Price touches lower line – Market is oversold, expect a bounce
- Best setup: Price bounces off the lower line with a bullish candlestick pattern
- Volume confirmation: Look for increased volume on the bounce
- Stop loss: Place 10-20 pips below the lower channel line
- Price breaks above the middle line – Trend continuation signal upward
- Context needed: Only valid in an established uptrend
- Entry timing: Wait for a full candle close above the middle line
- Target: Upper channel line
Sell Signals:
- Price touches upper line – Market is overbought, expect a pullback
- Best setup: Price rejects from the upper line with a bearish reversal pattern
- Volume confirmation: High volume on the rejection signal
- Stop loss: Place 10-20 pips above the upper channel line
- Price breaks below the middle line – Trend continuation signal downward
- Context needed: Only valid in an established downtrend
- Entry timing: Wait for the full candle close below the middle line
- Target: Lower channel line
Advanced Entry Techniques:
- False breakout trade: If the price breaks a channel line but immediately returns, trade the reversal
- Double touch strategy: The Second touch of the channel line often provides stronger signals
- Confluence zones: Best signals occur when channel lines align with major support/resistance levels
Best Linear Regression Channel Trading Strategies
The following are the strategies that can help you in your trading journey:
Strategy 1: Linear Regression Channel + Stochastic Combination
This strategy combines the location precision of linear regression channels with the momentum confirmation of a Stochastic oscillator. It filters out 60-70% of false signals by requiring both technical setups to align before entering trades.
How to Use This Linear Regression Channel + Stochastic Combination
Here is how you can use this strategy for trading:
Setup Requirements:
- Stochastic settings: %K Period: 14, %D Period: 3, Smoothing: 3
- Channel settings: 50-period length, 2.0 standard deviation
- Timeframes: Works best on 1-hour to 4-hour charts
Complete Buy Signal Process:
Step 1: Add the Linear Regression Channel to your TradingView chart using the drawing tools or indicator search. Set the length to 50 periods and the standard deviation to 2.0 for most timeframes.
Step 2: Add the Stochastic oscillator indicator by searching “Stochastic” in the indicators menu. Configure the settings to %K Period: 14, %D Period: 3, and Smoothing: 3.
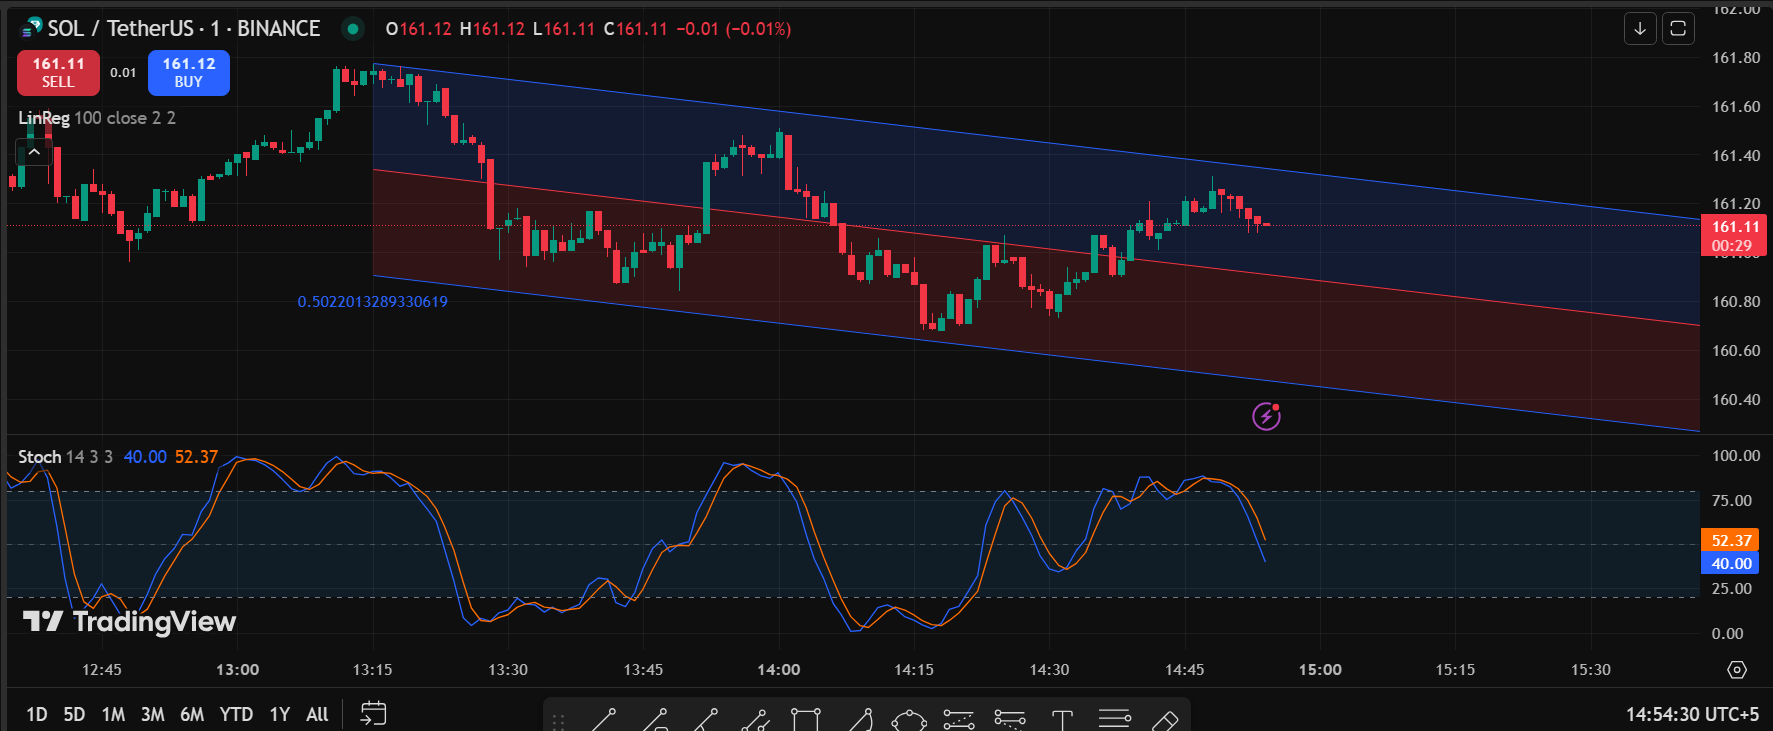
Step 3: Wait for price to touch either the upper or lower channel line as this indicates potential reversal zones. The upper line acts as resistance and the lower line acts as support. Remember, price touching these lines alone is not enough to enter a trade.
Step 4: Check the Stochastic indicator when the price touches a channel line. For trades at the lower channel line, Stochastic should be below 20 and crossing upward. For trades at the upper channel line, Stochastic should be above 80 and crossing downward.
Step 5: Enter your trade only when both conditions align within 3 candles of each other. Place your stop loss 20-30 pips beyond the channel line you’re trading from. Set your first profit target at the middle channel line and your final target at the opposite channel line.
Benefits of Linear Regression Channel and Stochastic Combination
- Higher accuracy: Double confirmation reduces false breakouts
- Better risk/reward: Precise entries improve profit potential
- Works in all markets: Effective on forex, stocks, and crypto
- Beginner-friendly: Simple rules are easy to follow consistently
Strategy 2: Multi-Timeframe Strategy
The Multi-Timeframe Strategy uses three different timeframes to analyze trend direction and find precise entry points. You check the big picture trend on a higher timeframe, identify setups on your main timeframe, and execute trades on a lower timeframe for better accuracy.
How to Use Multi-Timeframe Strategy with Linear Regression Channel
Step 1: Choose your three timeframes using the 4:1 ratio rule. If you want to day trade on 1-hour charts, use 4-hour for trend analysis and 15-minute for entries. For swing trading on 4-hour charts, use daily for trend and 1-hour for entries.
Step 2: Open the highest timeframe chart and add a Linear Regression Channel with a 100-period length. This shows you the overall market direction and major trend. Only trade in the direction this channel is pointing – up for longs, down for shorts.
Step 3: Switch to your main trading timeframe and add a 50-period Linear Regression Channel. Look for prices approaching the upper or lower channel lines that align with the higher timeframe trend direction. This is where you’ll identify your trading setups.
Step 4: Move to the lowest timeframe and add a 20-period Linear Regression Channel for precise entry timing. Wait for the price to touch the channel boundary that matches your setup direction. This gives you the exact entry point with minimal risk.
Step 5: Enter your trade when all three timeframes show alignment. Your stop loss goes beyond the channel line on your main timeframe. Your profit target is the opposite channel line on your main timeframe or a major level shown on the higher timeframe.
Benefits
- Higher win rate: All timeframes must agree before entering trades
- Better trend following: Avoids trading against major trends
- Precise entries: Lower timeframe provides exact entry timing
- Reduced false signals: Triple confirmation filters out weak setups
- Professional approach: Used by institutional traders
Strategy 3: Breakout Strategy
Breakout Strategy captures explosive price movements when trends accelerate beyond the channel boundaries. You wait for the price to break through the upper or lower channel lines with strong momentum and volume confirmation.
How to Use This Breakout Strategy
Step 1: Set up a Linear Regression Channel with a 50-100-period length, depending on your timeframe. Use a 2.0 standard deviation to create channels that contain most normal price action.
Step 2: Monitor price action as it approaches the upper or lower channel boundaries. Look for increasing momentum and volume as the price nears these lines. The best breakouts occur when the price has been respecting the channel for several touches before breaking out.
Step 3: Wait for a decisive close beyond the channel line rather than just a temporary spike. The breakout candle should close at least 10-20 pips beyond the channel boundary with above-average volume. This confirms the breakout is real and not just market noise.
Step 4: Enter your trade immediately after the breakout candle closes or wait for a pullback to retest the broken channel line. Immediate entry captures more of the move but has a higher risk. Pullback entry offers better risk-reward but might miss strong breakouts that don’t retrace.
Step 5: Set your stop loss inside the channel at the middle line for aggressive trades or at the opposite channel boundary for conservative trades. Your profit target should be at least the width of the channel projected from the breakout point.
Benefits of Breakout Strategy
- Catches big moves: Captures trend acceleration phases
- Clear signals: Channel breaks are obvious and objective
- High reward potential: Breakouts often lead to extended moves
- Works in trending markets: Perfect for momentum trading
- Scalable approach: Works on any timeframe
Educational Disclaimer: This information is for educational purposes only. You must conduct your own analysis and risk assessment before making any trading decisions.
Linear Regression Channel vs Standard Deviation Channel
Many traders confuse linear regression channels with standard deviation channels. While they look similar, they work very differently and give different signals.
Linear Regression Channel:
- Uses the highest high and the lowest low to set boundaries
- Channel lines are parallel to the regression line
- The width stays constant regardless of volatility
- Shows trend direction and strength clearly
Standard Deviation Channel:
- Uses statistical volatility calculations
- Channel width changes with market volatility
- Boundaries are set at 1, 2, or 3 standard deviations
- Widens during volatile periods, narrows during calm periods
| Feature | Linear Regression Channel | Standard Deviation Channel |
| Boundary Calculation | Extreme price points | Statistical volatility |
| Channel Width | Fixed distance | Variable with volatility |
| Best For | Trend identification | Volatility analysis |
| Signal Type | Support/resistance levels | Overbought/oversold conditions |
| Market Sensitivity | Moderate | High (sensitive to outliers) |
| Beginner Friendly | Yes | Requires statistical knowledge |
| False Signals | Medium | Higher (due to volatility spikes) |
| Best Markets | Trending markets | Range-bound markets |
Pros and Cons of Linear Regression Channel Trading
Linear Regression Channel has a lot of perks as it can predict the market behavior as well as indicate market entries or losses. However, some cons are also associated with this channel. Here is a quick overview of both:
Advantages of Linear Regression Channels
Linear regression channels offer several powerful advantages that make them popular among both beginners and professional traders.
Objective Signal Generation: Unlike manual trend lines, linear regression channels remove human emotion and bias. The mathematical formula (y = mx + b) calculates exact support and resistance levels.
Dynamic Adjustment: The biggest advantage is automatic updates. As new candles form, the channel recalculates instantly. You never need to redraw lines manually. This keeps your analysis current with market conditions.
Clear Visual Signals: Three simple lines provide all the information you need. If the price is above the middle line, there is a bullish bias. If the price is below the middle line, it is a bearish bias.
Disadvantages of Linear Regression Channels
Despite their advantages, linear regression channels have significant limitations that every trader must understand.
Constant Changes Confuse Beginners: The dynamic nature that makes channels powerful also creates confusion. As Reddit traders note: “Linear regression is very tough and should be used with other indicators.” New traders often struggle when channel lines move with each new candle.
Lagging Indicator: Linear regression channels are based on past price data. By the time you see a clear signal, the best part of the move might be over. This is especially problematic in fast-moving markets.
Requires Confirmation: Channels alone produce too many false signals. You must combine them with other indicators like RSI, Stochastic, or volume analysis. This adds complexity to your trading system.
Common Mistakes with Linear Regression Line and How to Avoid Them
Most traders make the same mistakes when starting with linear regression channels. Learning from these errors can save you thousands of dollars and months of frustration.
Mistake #1: Fighting the Dynamic Nature
The Problem: New traders get frustrated when channel lines move with each new candle. They want fixed levels like horizontal support and resistance.
The Solution:
- Accept that channel movement is normal and beneficial
- Focus on channel direction, not exact line positions
- Practice on demo accounts until you are comfortable with the changes
- Use longer periods (100+ bars) for more stable channels
Mistake #2: Using Channels in Isolation
The Problem: Trading every time the price touches a channel boundary without additional confirmation. This leads to numerous false signals and losses.
The Solution:
- Always use confirmation indicators (RSI, Stochastic, MACD)
- Check volume on channel touches and breakouts
- Consider the overall market trend and sentiment
- Never enter trades on channel touch alone
Mistake #3: Wrong Period Selection
The Problem: Using inappropriate channel lengths for your trading style and timeframe, leading to either too many signals (short periods) or too few signals (long periods).
| Trading Style | Recommended Period | Signal Frequency | Accuracy |
| Scalping | 20-30 periods | High | Moderate |
| Day Trading | 50-75 periods | Medium | Good |
| Swing Trading | 100-150 periods | Low | High |
| Position Trading | 200+ periods | Very Low | Very High |
Conclusion
Linear regression channels offer traders a powerful mathematical approach to market analysis. The formula y = mx + b transforms complex price movements into clear trading signals that remove emotion and guesswork from your decisions.
The key to success lies in understanding that channels work best as part of a complete trading system. Combine them with confirmation indicators like Stochastic, manage your risk properly with a 2% maximum per trade, and adapt your approach to different market conditions.
Use this mathematical edge wisely, stay disciplined with your risk management, and the formula can become your guide to consistent trading profits.