1. Overview of the Relative Volatility Index (RVI) Indicator
The Relative Volatility Index (RVI) is a financial indicator used by traders and investors to measure the direction of volatility. Unlike many indicators that focus on price movements and trends, the RVI specifically aims to gauge the standard deviation of price changes over a selected period of time, typically 14 days. It is often used as a complement to other indicators to identify potential market turning points by assessing the levels of volatility rather than price alone.
1.1 What is the RVI?
The RVI is based on the premise that in periods of market strength, price fluctuations tend to be more pronounced, while in periods of market weakness, price movements are often more subdued. The RVI values range between 0 and 100, with higher values indicating higher volatility and potential bullishness, and lower values suggesting lower volatility and potential bearishness. This indicator is unique because it focuses on volatility’s direction rather than price action itself, providing a different perspective for market analysis.
1.2 How the RVI Indicator Works
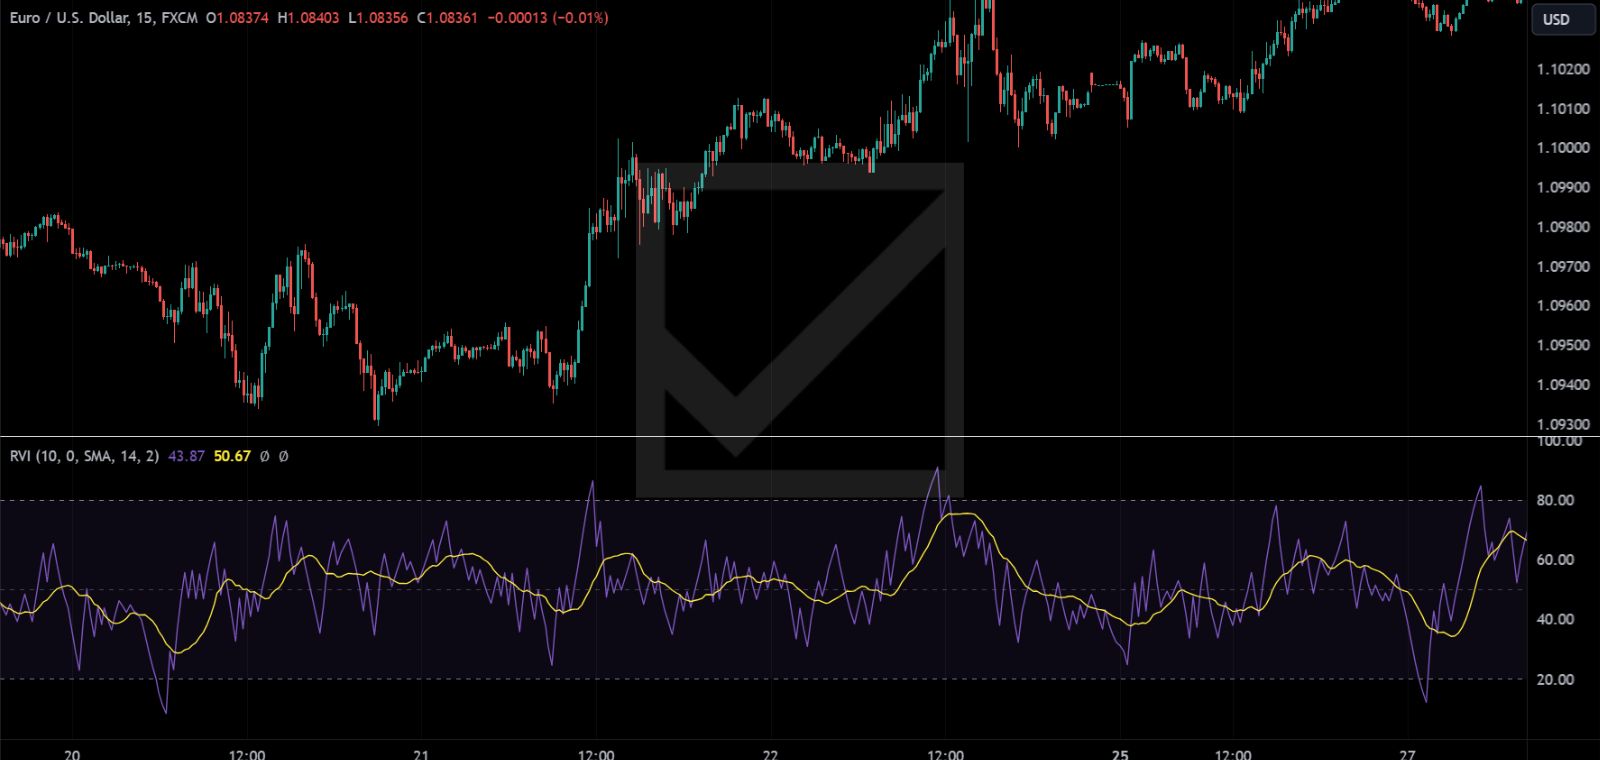
The RVI calculates the standard deviation of daily price changes over a specified period (commonly 14 days) and then normalizes the result to fit within a 0 to 100 scale. The indicator consists of two lines: the RVI line and the Signal line, which is a moving average of the RVI line, typically over 10 days. The crossover of these two lines can signal potential buy or sell opportunities, with a crossover above the signal line suggesting a bullish market and a crossover below indicating a bearish market.
1.3 Advantages of the RVI
- Focus on Volatility: By concentrating on volatility rather than price, the RVI offers insights into market dynamics that other indicators may overlook.
- Complementary Tool: It works well with other indicators, providing a more comprehensive view of market conditions.
- Indicator of Market Sentiment: High volatility levels can indicate strong market interest and potential directional momentum.
1.4 Limitations of the RVI
- Lagging Nature: As with many technical indicators, the RVI is lagging, meaning it reflects past market conditions.
- False Signals: Volatility can increase in both rising and falling markets, leading to potential false signals without additional analysis.
- Complexity for Beginners: Understanding and interpreting volatility may be challenging for novice traders.
| Feature | Description |
|---|---|
| Type | Volatility Indicator |
| Common Period | 14 days for RVI calculation, 10 days for Signal line |
| Key Components | RVI Line, Signal Line |
| Range | 0 to 100 |
| Advantages | Focuses on volatility, complements other indicators, indicates market sentiment |
| Limitations | Lagging, can produce false signals, may be complex for beginners |
2. Calculation Process of the Relative Volatility Index (RVI)
The Relative Volatility Index (RVI) is calculated through a series of steps that transform daily price changes into a normalized index, indicating the direction and magnitude of volatility. This section breaks down the calculation process into understandable parts.
2.1 Step-by-Step Calculation
- Standard Deviation of Price Changes: Calculate the standard deviation of daily price changes over a chosen period, typically 14 days. This step quantifies the average magnitude of price changes, serving as the base for assessing volatility.
- Normalization of Standard Deviation: Convert the standard deviation values into an index format that ranges between 0 and 100. This normalization makes it easier to interpret the data by placing it on a consistent scale.
- Calculation of the RVI Line: The RVI line is the main line of the indicator and is calculated by taking the ratio of the upward standard deviation to the total standard deviation (upward plus downward) over the period, then normalizing this ratio to fit within the 0 to 100 range.
- Signal Line Calculation: The Signal line is a moving average of the RVI line, typically calculated over a 10-day period. This line helps smooth out the RVI line’s fluctuations and provides a trigger for potential trading signals when the two lines cross.
2.2 Formula
The mathematical formula for the RVI involves several components. While the exact formula can vary slightly depending on the source, a common version is as follows:
RVI = (100 x SDup) / (SDup + SDdown)
Where:
- (SDup) is the standard deviation of upward price changes.
- (SDdown) is the standard deviation of downward price changes.
The Signal line is then calculated as a moving average (MA) of the RVI over a specified period:
Signal Line = MA10(RVI)
2.3 Optimal Calculation Periods
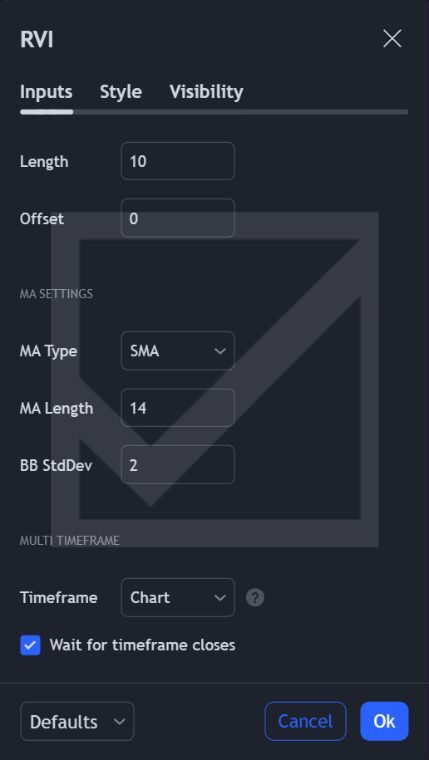
While the standard period for RVI calculation is 14 days, and the Signal line is usually a 10-day moving average, these periods can be adjusted based on the trader’s strategy and the market conditions. Shorter periods may provide more responsive signals, while longer periods can offer smoother and potentially more reliable indicators.
| Calculation Step | Description |
|---|---|
| Standard Deviation of Price Changes | Quantifies average magnitude of price changes over a period. |
| Normalization | Converts standard deviation into an index format ranging from 0 to 100. |
| RVI Line Calculation | Main indicator line showing the normalized ratio of upward standard deviation to total standard deviation. |
| Signal Line Calculation | Moving average of the RVI line, smoothing out its fluctuations. |
| Optimal Periods | 14 days for RVI, 10 days for Signal line (adjustable based on strategy). |
Understanding the calculation process of the RVI is crucial for effectively incorporating it into trading strategies. This knowledge helps traders to fine-tune the indicator’s settings to match their trading preferences and the specific characteristics of the markets they are trading in.
3. Optimal Values for Setup in Different Timeframes
The Relative Volatility Index (RVI) can be adapted to various trading styles and timeframes by adjusting its calculation parameters. The optimal setup values for the RVI depend on the trader’s objectives, the market’s volatility, and the timeframe of interest. This section explores how to adjust the RVI settings for different trading scenarios.
3.1 Short-Term Trading
For short-term traders, such as day traders or scalpers, responsiveness is key. These traders require quick signals to capitalize on small, short-lived market movements.
- RVI Period: Reducing the standard period from 14 days to a range between 5 to 10 days increases the sensitivity of the RVI, providing more immediate signals.
- Signal Line Period: Shortening the signal line period to 5 days can help in highlighting quicker turning points in volatility.
3.2 Medium-Term Trading
Swing traders, who hold positions for several days to a few weeks, need a balance between responsiveness and reliability to filter out market noise.
- RVI Period: A standard 14-day period is typically effective for medium-term trading, offering a balance between sensitivity and smoothing.
- Signal Line Period: Maintaining the signal line at a 10-day moving average works well for identifying medium-term trends in volatility.
3.3 Long-Term Trading
For long-term traders, such as position traders who hold trades for several weeks or months, the focus shifts towards identifying broader market trends and avoiding short-term volatility.
- RVI Period: Extending the period to 20-30 days reduces the indicator’s sensitivity, smoothing out short-term fluctuations and highlighting longer-term volatility trends.
- Signal Line Period: A longer signal line period, such as 15 to 20 days, can further smooth the indicator’s movements, providing clearer signals for long-term trend changes.
3.4 Adjusting for Market Conditions
- High Volatility Markets: In highly volatile markets, slightly increasing the calculation periods can help in reducing the number of false signals by smoothing out excessive fluctuations.
- Low Volatility Markets: In contrast, during periods of low market volatility, decreasing the calculation periods can make the RVI more responsive to smaller changes, potentially uncovering opportunities that would be otherwise overlooked.
| Timeframe | RVI Period | Signal Line Period | Application |
|---|---|---|---|
| Short-Term Trading | 5-10 days | 5 days | Increased sensitivity for quick trades. |
| Medium-Term Trading | 14 days | 10 days | Balance between sensitivity and smoothing. |
| Long-Term Trading | 20-30 days | 15-20 days | Reduced sensitivity for broader trends. |
| Adjusting for Market Conditions | Adjust based on volatility | Adjust to complement RVI period | Adaptability to market dynamics. |
4. Interpretation and Trading Signals of the Relative Volatility Index (RVI)
The Relative Volatility Index (RVI) offers unique insights into market conditions by focusing on volatility rather than price action alone. Interpreting its signals correctly can help traders identify potential entry and exit points, gauge market sentiment, and manage risk. This section covers how to interpret the RVI and the trading signals it provides.
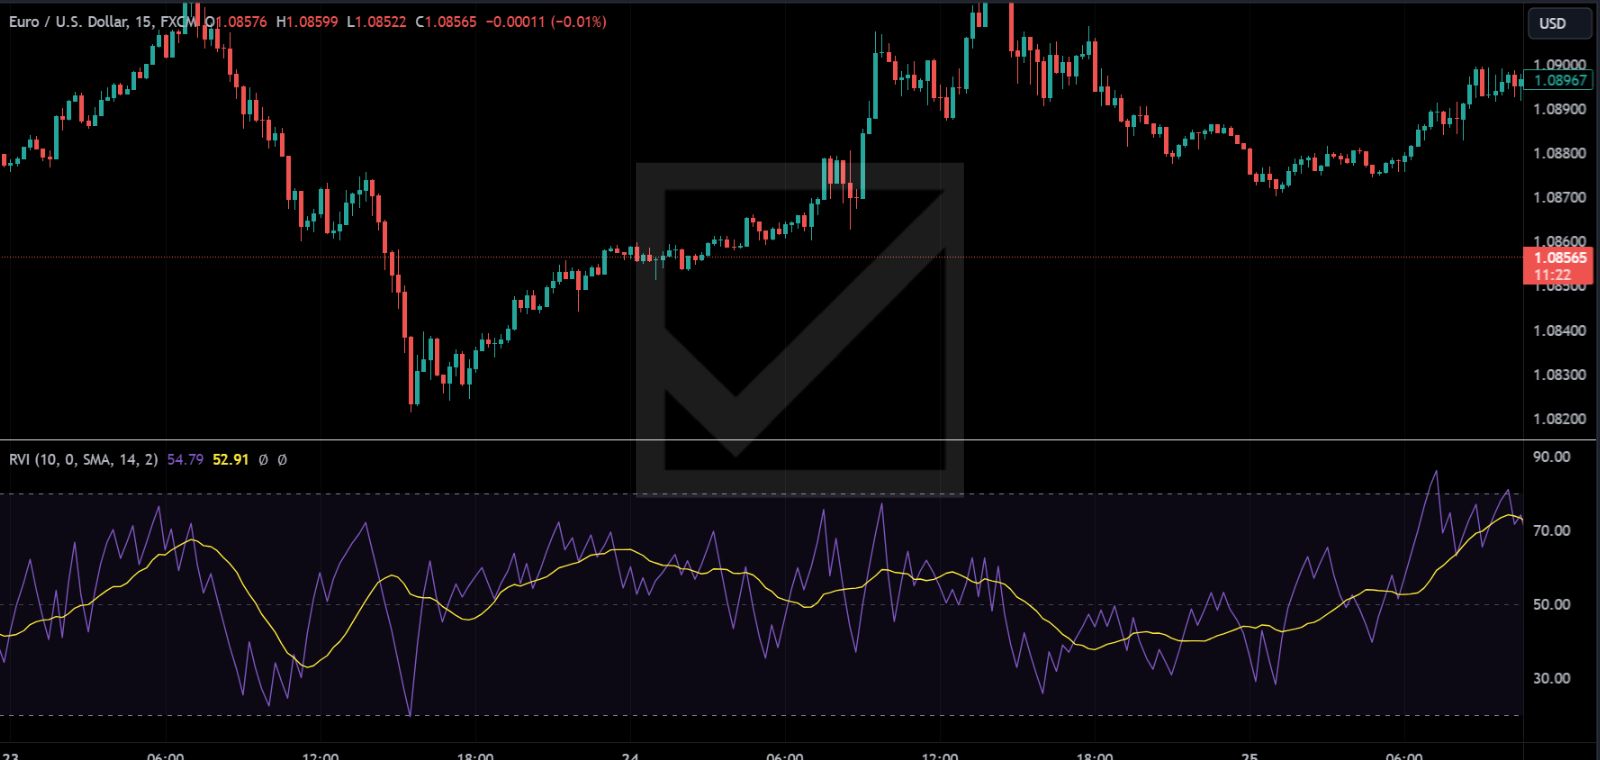
4.1 Understanding RVI Readings
- RVI Above 50: When the RVI is above 50, it suggests that volatility is to the upside, indicating bullish market conditions. Higher readings can signify increased market enthusiasm or potential upward price movements.
- RVI Below 50: Conversely, an RVI below 50 indicates that volatility is to the downside, suggesting bearish market conditions. Lower readings may point to growing pessimism or potential downward price movements.
4.2 RVI and Signal Line Crossovers
The interaction between the RVI and its signal line forms the basis for one of the most common trading signals:
- Bullish Signal: A bullish signal is generated when the RVI crosses above its signal line. This crossover indicates that volatility is shifting upwards, potentially leading to an increase in price.
- Bearish Signal: A bearish signal occurs when the RVI crosses below its signal line, suggesting that volatility is shifting downwards, which could precede a decrease in price.

4.3 Divergences
Divergences between the RVI and market price offer powerful insights into market momentum and potential reversals:
- Bullish Divergence: Occurs when the price creates a new low, but the RVI forms a higher low. This divergence can indicate weakening downward momentum and a possible bullish reversal.
- Bearish Divergence: Happens when the price reaches a new high while the RVI creates a lower high, suggesting weakening upward momentum and a potential bearish reversal.
4.4 Combining RVI with Other Indicators
To improve the reliability of RVI signals and reduce false alarms, traders often combine the RVI with other technical indicators:
- Trend Indicators: Combining the RVI with trend indicators like Moving Averages or the MACD can help confirm the direction of the market trend.
- Momentum Indicators: Pairing the RVI with momentum indicators such as the RSI (Relative Strength Index) or Stochastics can provide additional confirmation of market momentum and potential turning points.
| Signal Type | RVI Reading | Signal Line Crossover | Divergence | Combination with Other Indicators |
|---|---|---|---|---|
| Bullish | Above 50 | RVI crosses above Signal Line | Higher low in RVI vs. lower low in price | Confirm with trend or momentum indicators |
| Bearish | Below 50 | RVI crosses below Signal Line | Lower high in RVI vs. higher high in price | Confirm with trend or momentum indicators |
Interpreting the RVI involves analyzing its level relative to 50, crossovers with its signal line, and divergences with price action. By combining these signals with other technical analysis tools, traders can enhance their understanding of market conditions, refine their trading strategies, and better manage their risk.
5. Combining the Relative Volatility Index (RVI) with Other Indicators
Integrating the Relative Volatility Index (RVI) with other technical indicators can significantly enhance trading strategies by providing a more comprehensive view of the market. This combination approach helps in confirming signals, identifying potential trading opportunities, and minimizing false alarms. This section explores effective ways to combine the RVI with other indicators for improved market analysis.
5.1 RVI and Moving Averages
- Strategy: Use a Moving Average (MA) to determine the market trend and the RVI to gauge volatility and potential entry or exit points within that trend.
- Implementation: A long-term MA (e.g., 50 or 200 days) can identify the trend direction. Traders can then look for RVI signals that align with the trend for higher probability trades. For example, in an uptrend, focus on RVI bullish signals for entries.
5.2 RVI and Relative Strength Index (RSI)
- Strategy: Combine the RVI’s volatility signals with the RSI’s momentum readings to confirm potential reversals or continuation of trends.
- Implementation: Look for periods where both the RVI and RSI provide concurrent signals, such as both indicators showing oversold conditions followed by upward crossovers, indicating a strong potential for a bullish reversal.
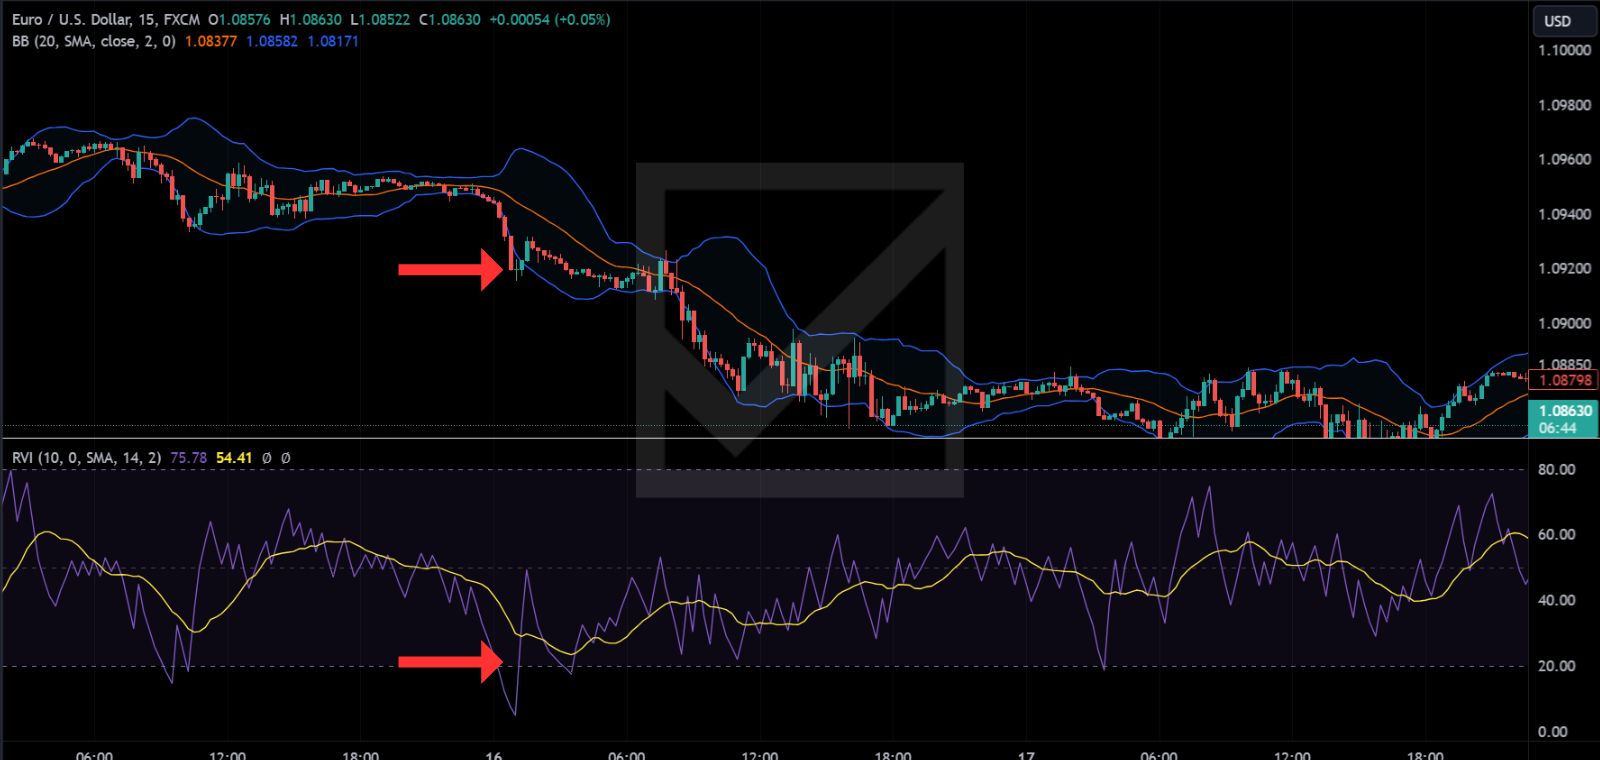
5.3 RVI and Bollinger Bands
- Strategy: Utilize Bollinger Bands to assess price volatility and trends, while the RVI indicates the direction of volatility.
- Implementation: When the price touches or breaks through the Bollinger Band’s upper or lower limits, the RVI can confirm whether the volatility direction supports a continuation of the trend or a potential reversal.
5.4 RVI and MACD (Moving Average Convergence Divergence)
- Strategy: The MACD’s trend-following characteristics combined with the RVI’s focus on volatility offer a dual approach to understanding market movements.
- Implementation: A bullish signal can be considered more robust if the MACD shows a positive crossover (the MACD line crossing above the signal line) at the same time the RVI crosses above its signal line, suggesting both a strong trend and increasing volatility.
5.5 RVI and Stochastic Oscillator
- Strategy: The Stochastic Oscillator’s sensitivity to market momentum alongside the RVI’s volatility signals can pinpoint precise entry and exit points.
- Implementation: Look for scenarios where the stochastic indicates an overbought or oversold condition that aligns with an RVI signal. For example, an oversold stochastic reading combined with an RVI bullish crossover suggests a potential buying opportunity.
| Combined Indicator | Strategy | Implementation |
|---|---|---|
| Moving Averages | Trend identification and volatility-based entry/exit | Use MA to identify trend; RVI signals for trade within trend |
| Relative Strength Index (RSI) | Confirming momentum and volatility | Concurrent signals from RVI and RSI for stronger reversal signals |
| Bollinger Bands | Price volatility and trend confirmation | RVI confirms volatility direction when price tests Bollinger limits |
| MACD | Trend strength and volatility direction | MACD and RVI crossovers for confirming trend and volatility strength |
| Stochastic Oscillator | Momentum and volatility entry/exit points | Stochastic conditions and RVI crossovers for precise trade timing |
Combining the RVI with other technical indicators leverages the strengths of each, providing traders with a multifaceted view of the markets. This approach not only enhances the accuracy of trading signals but also aids in developing a more rounded and resilient trading strategy.
6. Risk Management Using the Relative Volatility Index (RVI)
Effective risk management is crucial in trading, and the Relative Volatility Index (RVI) can play a significant role in this regard. While primarily known for measuring the direction of volatility, the RVI can also provide valuable insights for managing trading risks. This section explores strategies to use the RVI for risk management, ensuring traders can protect their capital while seeking potential market opportunities.
6.1 Setting Stop-Loss Orders
- Strategy: Utilize the RVI to identify potential reversal points and set stop-loss orders to minimize losses.
- Implementation: After entering a trade based on an RVI signal, set a stop-loss just beyond the recent swing high or low before the signal occurred. If the RVI indicates a bullish signal, set the stop-loss below the most recent swing low. For a bearish signal, place it above the most recent swing high. This method helps to limit potential losses if the market moves against the trade.
6.2 Position Sizing Based on Volatility
- Strategy: Adjust position sizes according to the level of volatility indicated by the RVI.
- Implementation: When the RVI shows higher volatility (values significantly above 50), consider reducing the position size to mitigate risk, as higher volatility can lead to larger price swings. Conversely, in periods of lower volatility (values near or below 50), traders might opt for slightly larger position sizes, given the reduced price movement expectations.
6.3 Diversification of Trades
- Strategy: Use the RVI to diversify trading strategies across different market conditions and asset classes.
- Implementation: Monitor the RVI across various instruments and look for diverging volatility conditions. This approach enables traders to spread risk by not concentrating their capital in markets moving in similar volatility patterns. For instance, if one asset shows an RVI significantly above 50 and another below 50, it may present an opportunity to take positions that could potentially hedge against each other.
6.4 Using RVI in Conjunction with Other Indicators for Confirmation
- Strategy: Enhance risk management by confirming RVI signals with other technical indicators before executing trades.
- Implementation: Before taking a position based on an RVI signal, seek confirmation from another indicator, such as the MACD, RSI, or a Moving Average. This confirmation helps to ensure that the trade is more likely to be in line with overall market conditions, reducing the risk of false signals.
| Risk Management Strategy | Description | Implementation |
|---|---|---|
| Setting Stop-Loss Orders | Minimize losses with strategic stop-loss placement | Place stop-loss orders beyond recent swing highs/lows based on RVI signals |
| Position Sizing Based on Volatility | Adjust trade size relative to market volatility | Increase or decrease position sizes based on RVI volatility readings |
| Diversification of Trades | Spread risk across different instruments | Use RVI to identify diverging volatility patterns for diversified trading |
| Using RVI with Other Indicators | Confirm signals to reduce false positives | Wait for confirmation from other technical indicators before trading on RVI signals |
Employing the RVI for risk management allows traders to make more informed decisions about when to enter or exit trades, how much capital to allocate, and how to diversify their investment portfolio. By integrating these strategies, traders can enhance their overall trading approach, balancing the pursuit of opportunities with the imperative of capital preservation.