


1. What is the SMI Ergodic Indicator?
The SMI Ergodic Indicator is a technical analysis tool used to identify the direction of price momentum and potential trend reversals. Developed by William Blau, this indicator is designed to minimize the noise associated with daily price fluctuations and provide a clearer picture of the market’s momentum.
Traders often prefer the SMI Ergodic Indicator because it can be less prone to false signals compared to other momentum indicators. Its unique calculation method helps in identifying the true strength of a trend, making it a valuable tool for traders looking to capitalize on sustained market movements. The SMI Ergodic Indicator is especially effective in trending markets where it can signal the continuation or exhaustion of a trend.
1.1. The Mathematics Behind SMI Ergodic Indicator
The Core Formula
The SMI Ergodic Indicator is calculated through a multi-step process, beginning with the difference between the current closing price and the median price of a given period. This difference is referred to as the Closing Price Oscillator (CPO). The CPO is then smoothed with a double smoothing process using Exponential Moving Averages (EMAs). The first smoothing applies an EMA over the CPO, and the second smoothing applies another EMA over the first EMA results.
Signal Line and Oscillator
The next step involves the creation of the Signal Line, which is an EMA of the SMI Ergodic Indicator itself. The final SMI Ergodic value is then plotted alongside the Signal Line on a chart, providing a visual representation of momentum shifts. The crossing of the SMI Ergodic line and the Signal Line often indicates potential entry or exit points for traders.
Normalization Process
A key aspect of the SMI Ergodic Indicator is its normalization process, which divides the double-smoothed CPO by a double-smoothed absolute version of the CPO (representing the maximum possible movement away from the median price). This normalization helps in scaling the indicator to oscillate around zero, which aids in identifying overbought and oversold conditions.
| Component | Description |
|---|---|
| Closing Price Oscillator | Difference between the closing price and the median price. |
| First EMA Smoothing | Applied to the CPO for initial smoothing. |
| Second EMA Smoothing | Applied to the first EMA results for further smoothing. |
| Signal Line | EMA of the SMI Ergodic Indicator used for signal generation. |
| Normalization | Divides the double-smoothed CPO by a double-smoothed absolute version to scale the indicator. |
Practical Application
The traders will often adjust the period lengths for both the median price calculation and the EMA smoothing to suit their trading strategy. The default settings may not be optimal for all market conditions or time frames, so fine-tuning these parameters can enhance the indicator’s effectiveness. Additionally, the SMI Ergodic Indicator’s responsiveness can be increased or decreased by adjusting the EMA smoothing constants, allowing traders to tailor the indicator’s sensitivity to market volatility.
1.2. SMI vs. Traditional Momentum Indicators
SMI vs. Traditional Momentum Indicators
The Stochastic Momentum Index (SMI) differentiates from traditional momentum indicators like the Relative Strength Index (RSI) and the standard Stochastic Oscillator by focusing on the central tendency of price as opposed to merely the closing price. This approach aims to provide a more refined view of momentum, capturing the nuances of price movement that other indicators might miss.
Traditional momentum indicators often suffer from sharp movements and false signals in volatile markets. The SMI, with its double smoothing process, mitigates these issues, offering a smoother result that can be more reliable during periods of erratic price changes. By comparing the closing price to the midpoint of the high/low range, the SMI reduces the impact of outliers, which can distort the readings of traditional indicators.
The RSI, a widely used momentum indicator, gauges the velocity and magnitude of directional price movements. It operates on a scale of 0 to 100, typically considering readings above 70 as overbought and below 30 as oversold. The SMI, however, provides a centerline crossover signal, which is not inherently overbought or oversold, but rather indicates a change in momentum direction. This centerline approach can be particularly useful in identifying trend reversals or confirmations.
Divergence plays a key role in assessing momentum indicators. While both SMI and traditional indicators like the RSI can indicate divergence, the SMI’s sensitivity adjustment allows traders to fine-tune the indicator for better divergence detection. A divergence occurs when the price makes new highs or lows, but the indicator fails to confirm these with its highs or lows, often signaling a potential reversal.
| Indicator | Focus on Price | Smoothing Process | Scale | Overbought/Oversold Levels | Divergence Sensitivity |
|---|---|---|---|---|---|
| SMI | Central Tendency | Double Smoothed | No fixed scale | Centerline Crossover | Adjustable Sensitivity |
| RSI | Closing Price | Single Smoothed | 0-100 | 70/30 | Fixed Sensitivity |
| Stochastic Oscillator | Closing Price | Single Smoothed | 0-100 | 80/20 | Fixed Sensitivity |
the SMI’s design allows traders to capture more nuanced market trends and filter out noise better than traditional momentum indicators. Its customizable nature enables a more tailored application to various market conditions and individual trading strategies.
2. How to Set Up the SMI Ergodic Indicator?
Setting Up the SMI Ergodic Indicator
To start using the SMI Ergodic Indicator (SMI), traders must first add it to their charting software. Most trading platforms include the SMI as part of their technical analysis tool suite. To set up the SMI, locate the indicator in the platform’s indicator list and apply it to the chart.
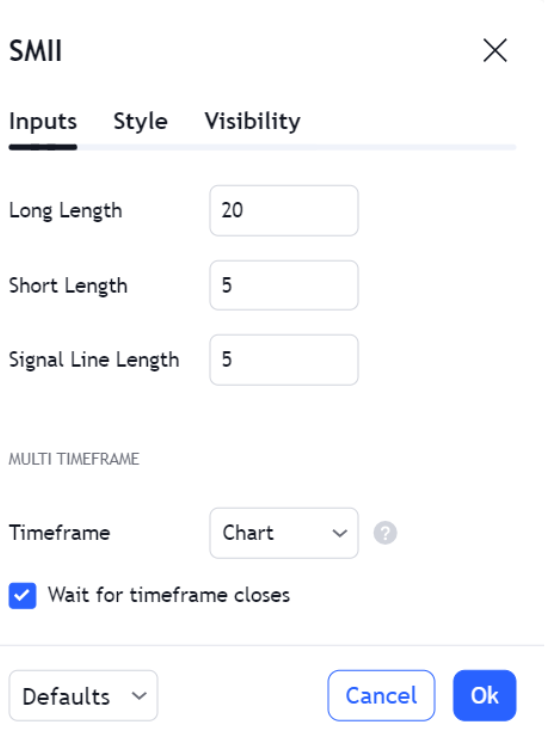
Configuring the SMI involves adjusting its three main parameters: the time period for the short exponential moving average (EMA), the time period for the long EMA, and the time period for the signal line. The default settings often used are 5 for the short EMA, 20 for the long EMA, and 5 for the signal line, but these can be modified based on the trader’s preferences and the specific market being analyzed.
| Parameter | Default Setting | Customizable |
|---|---|---|
| Short EMA | 5 | Yes |
| Long EMA | 20 | Yes |
| Signal Line EMA | 5 | Yes |
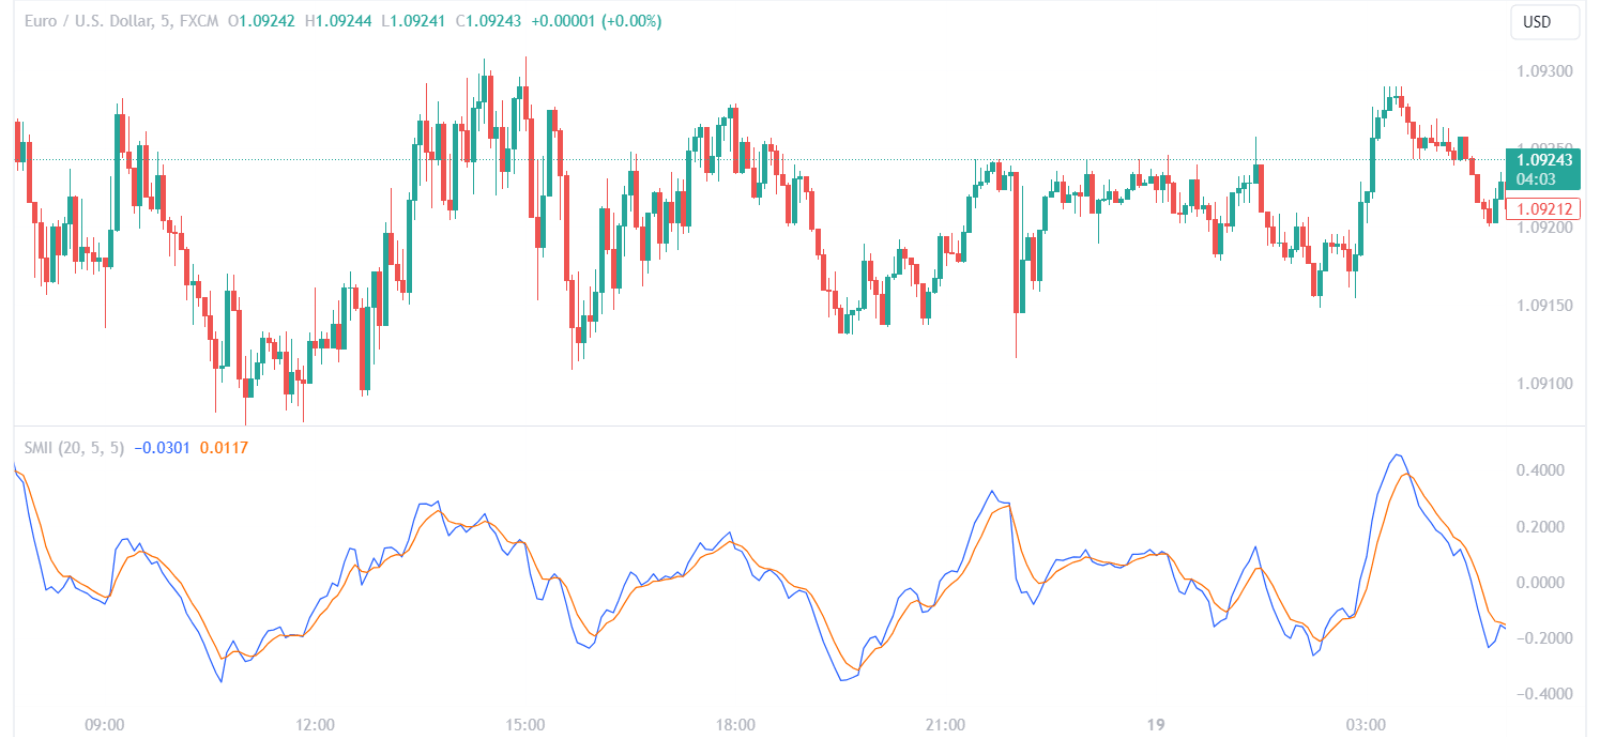
 Once the parameters are set, the SMI will display two lines on the chart: the SMI line and the signal line. The SMI line reflects the current market momentum, while the signal line acts as a trigger for buy and sell signals. Traders often look for crossovers between these two lines as potential trade entry or exit points.
To enhance the indicator’s effectiveness, traders can also adjust the sensitivity of the divergence to align with their risk tolerance and trading style. This is done by fine-tuning the EMA settings, with lower settings increasing sensitivity and higher settings reducing it. It’s crucial to backtest any adjustments to ensure they improve trade outcomes within the context of the trader’s strategy.
2.1. Configuring SMI Ergodic Settings
Adjusting the EMA Periods
Fine-tuning the Exponential Moving Average (EMA) periods for the SMI Ergodic is a critical step in tailoring the indicator to individual trading preferences. The Short EMA and Long EMA act as the core components that dictate the SMI’s sensitivity to price movements. A shorter Short EMA will cause the SMI line to react more quickly to price changes, which may be advantageous in volatile markets or for short-term trading. Conversely, lengthening the Short EMA can smooth out the volatility and may be better suited for longer-term trend following.
The Long EMA establishes the broader market context by filtering out minor price fluctuations. An increased Long EMA period can provide a more reliable signal for the prevailing trend but may also delay entry and exit points. Traders must strike a balance between responsiveness and reliability when configuring these settings.
Signal Line EMA Considerations
The Signal Line EMA serves as a method to generate trading signals when it crosses the SMI line. A smaller Signal Line EMA period results in a more responsive signal line, which can be beneficial for identifying early trade entries. However, this may also lead to a higher rate of false signals. A larger Signal Line EMA period will produce a smoother signal line, potentially reducing false signals but at the cost of timeliness.
Sensitivity and Divergence
Adjusting the sensitivity of the divergence is another lever traders can pull to fine-tune the SMI Ergodic. This involves modifying the EMA periods to either increase or decrease the indicator’s sensitivity to price movements. The table below outlines the impact of adjusting EMA settings on the SMI’s sensitivity:
| EMA Adjustment | Sensitivity Impact | Potential Benefit |
|---|---|---|
| Decrease | Higher Sensitivity | Quicker reaction to price change |
| Increase | Lower Sensitivity | Smoother signal, fewer whipsaws |
Adjusting the sensitivity must be done with consideration of the trader’s risk tolerance and the characteristics of the asset being traded. Backtesting any modifications to the SMI settings is essential to validate their effectiveness within a given trading strategy.
2.2. Integrating SMI Ergodic with Trading Platforms
Compatibility with Popular Trading Platforms
The SMI Ergodic Indicator is compatible with major trading platforms such as MetaTrader 4 (MT4), MetaTrader 5 (MT5), and TradingView. To integrate the SMI Ergodic with these platforms, traders often need to download and install a custom version of the indicator, as it may not be included in the platform’s default indicator library.
Customization and Optimization
Upon installation, traders can access the indicator’s properties to customize the EMA periods and other settings. This customization is crucial for aligning the SMI Ergodic with individual trading strategies and market conditions. For instance, in MT4 or MT5, right-clicking on the indicator in the ‘Navigator’ pane and selecting ‘Properties’ opens a dialog box where parameters can be modified. In TradingView, clicking on the ‘Settings’ cog when the indicator is active allows for similar adjustments.
Real-Time Application
Once integrated, the SMI Ergodic appears on the price chart, providing real-time insights into market momentum. Traders can apply the indicator to various timeframes, from minute charts for scalping strategies to daily or weekly charts for long-term trend analysis. It is important to note that the responsiveness of the SMI Ergodic will vary with different timeframes, which should be considered when adjusting its settings.
Alerts and Automation
Advanced platforms like TradingView offer the capability to set custom alerts based on the SMI Ergodic’s signals. Traders can configure alerts for when the SMI crosses certain levels, potentially indicating a buy or sell opportunity. Furthermore, platforms with automated trading capabilities allow traders to develop Expert Advisors (EAs) or scripts that can trade based on the SMI Ergodic signals, thereby automating their trading strategies.
Data Visualization Enhancements
For better visualization, traders can enhance the SMI Ergodic’s appearance on the chart by adjusting colors, line thickness, and style. This can help in distinguishing the SMI line from the signal line, making it easier to spot crossovers and divergences which are critical for trade decisions.
3. How to Use the SMI Ergodic Indicator for Trade Entries and Exits?
Trade Entry Criteria with SMI Ergodic
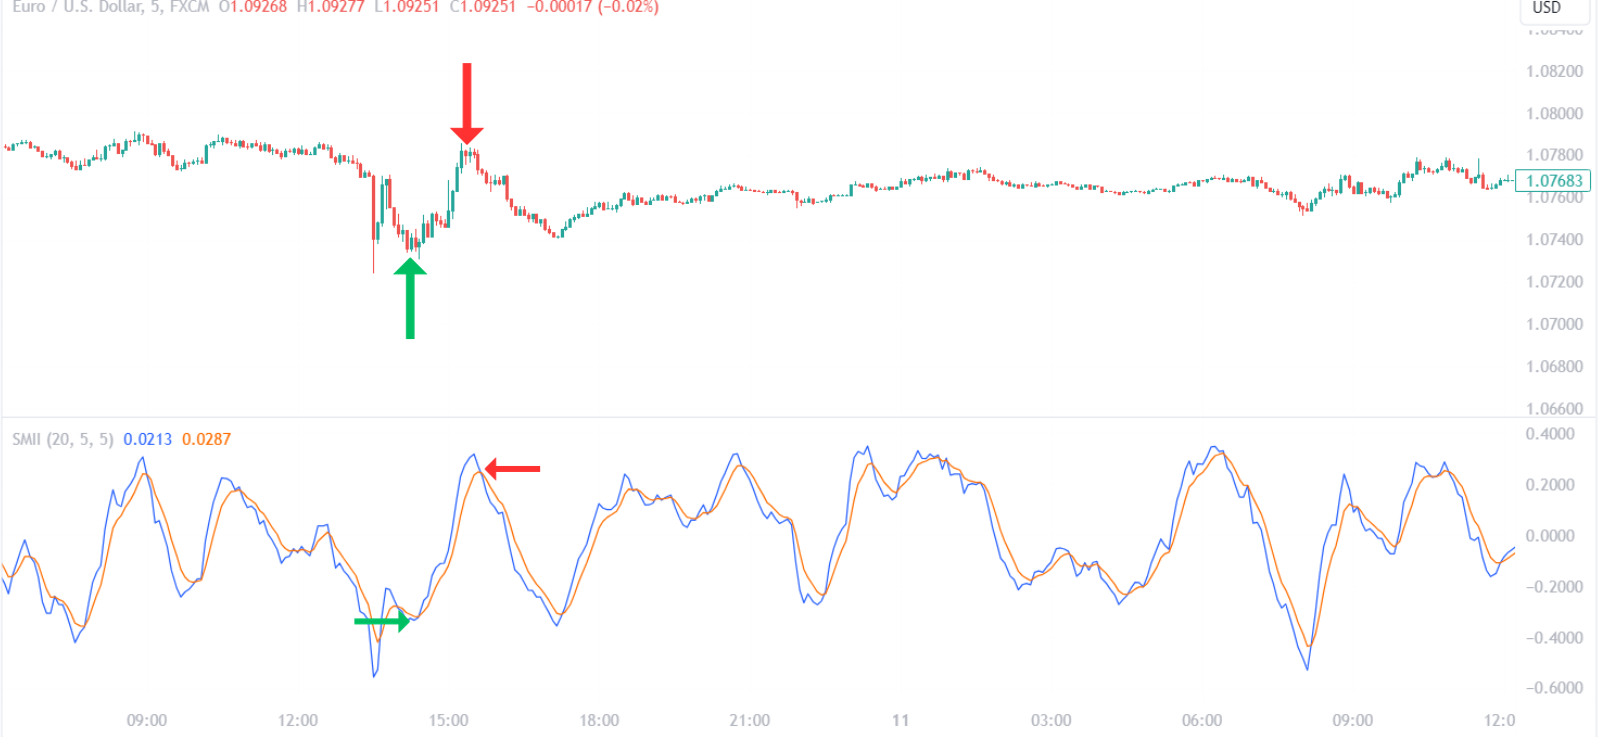
When the SMI Ergodic line crosses above the signal line, it is often interpreted as a bullish momentum signal, suggesting a potential entry point for a long position. Traders should look for this crossover in an uptrend to align with the broader market direction. Conversely, a cross below the signal line can indicate bearish momentum, hinting at an opportunity to enter a short trade. It is advisable to seek additional confirmation from other technical indicators or price patterns to enhance the reliability of the signals.
Trade Exit Criteria with SMI Ergodic
Setting exit points is crucial to protect profits and limit losses. A common strategy is to exit a long position when the SMI Ergodic line crosses below the signal line, signaling a loss of upward momentum. For a short position, an exit signal occurs when the SMI Ergodic line crosses above the signal line, suggesting the downward momentum is waning. Traders can also use a predefined risk-reward ratio or set stop-loss and take-profit levels based on the volatility or key support and resistance levels.
Optimization of Entry and Exit Points
To optimize trade entries and exits, traders can adjust the SMI Ergodic’s sensitivity by changing its time period settings. A shorter time period makes the indicator more sensitive to price movements, providing earlier signals, while a longer time period offers smoother and potentially more reliable signals. Backtesting strategies with historical data can help determine the most effective settings for specific trading instruments and timeframes.
| SMI Ergodic Signal | Trade Action | Additional Confirmation |
|---|---|---|
| The line crosses above the signal line | Consider long entry | Bullish patterns, other indicators |
| The line crosses below the signal line | Consider short entry | Bearish patterns, other indicators |
| The line crosses below the signal line (in long) | Exit long position | Support levels, trailing stop-loss |
| The line crosses above the signal line (in short) | Exit short position | Resistance levels, trailing stop-loss |
By integrating the SMI Ergodic indicator into a comprehensive trading plan that includes proper risk management and market analysis, traders can enhance their ability to make informed decisions on trade entries and exits.
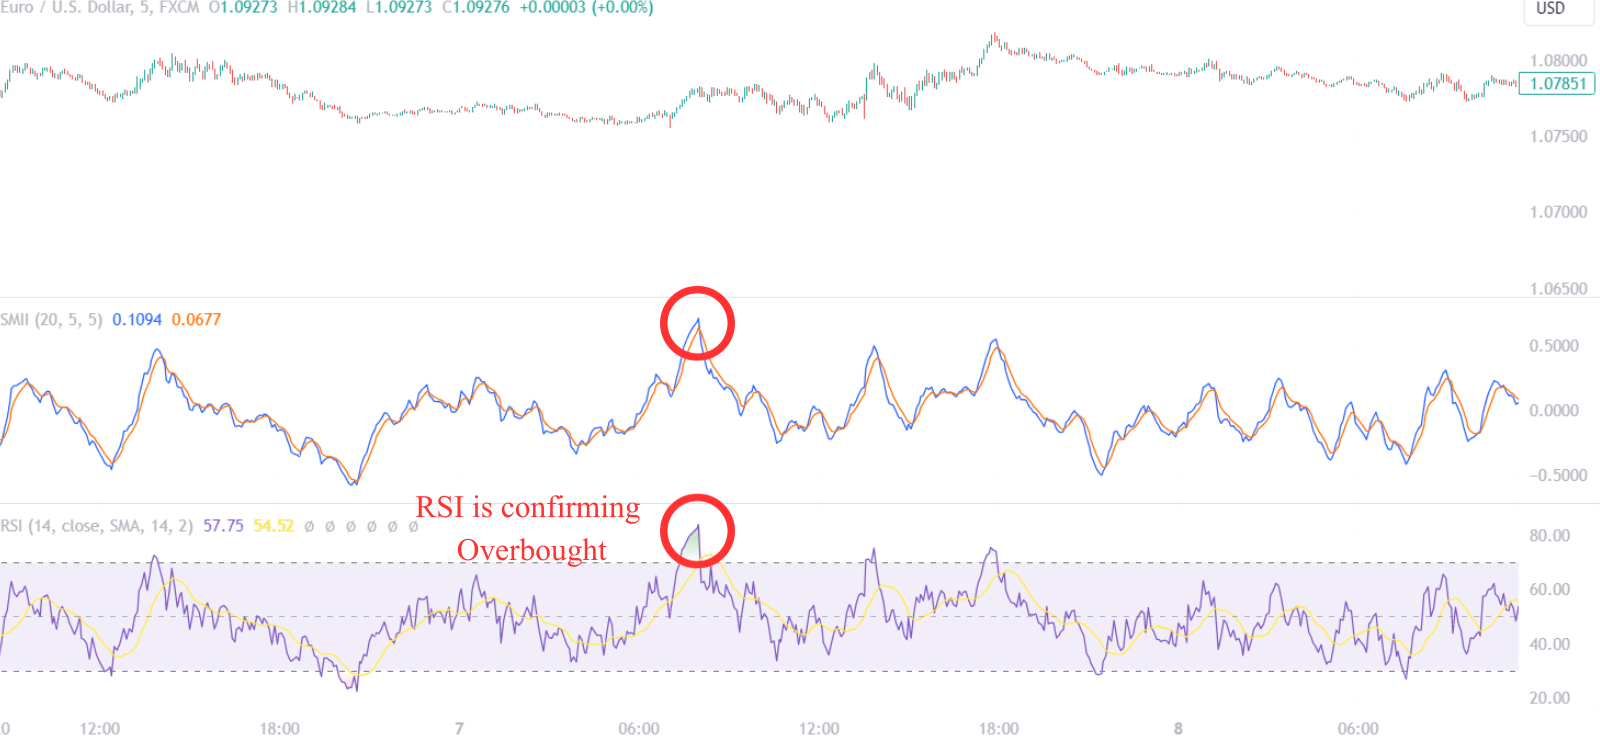
3.1. Identifying Overbought and Oversold Conditions
Overbought and Oversold Conditions with SMI Ergodic Indicator
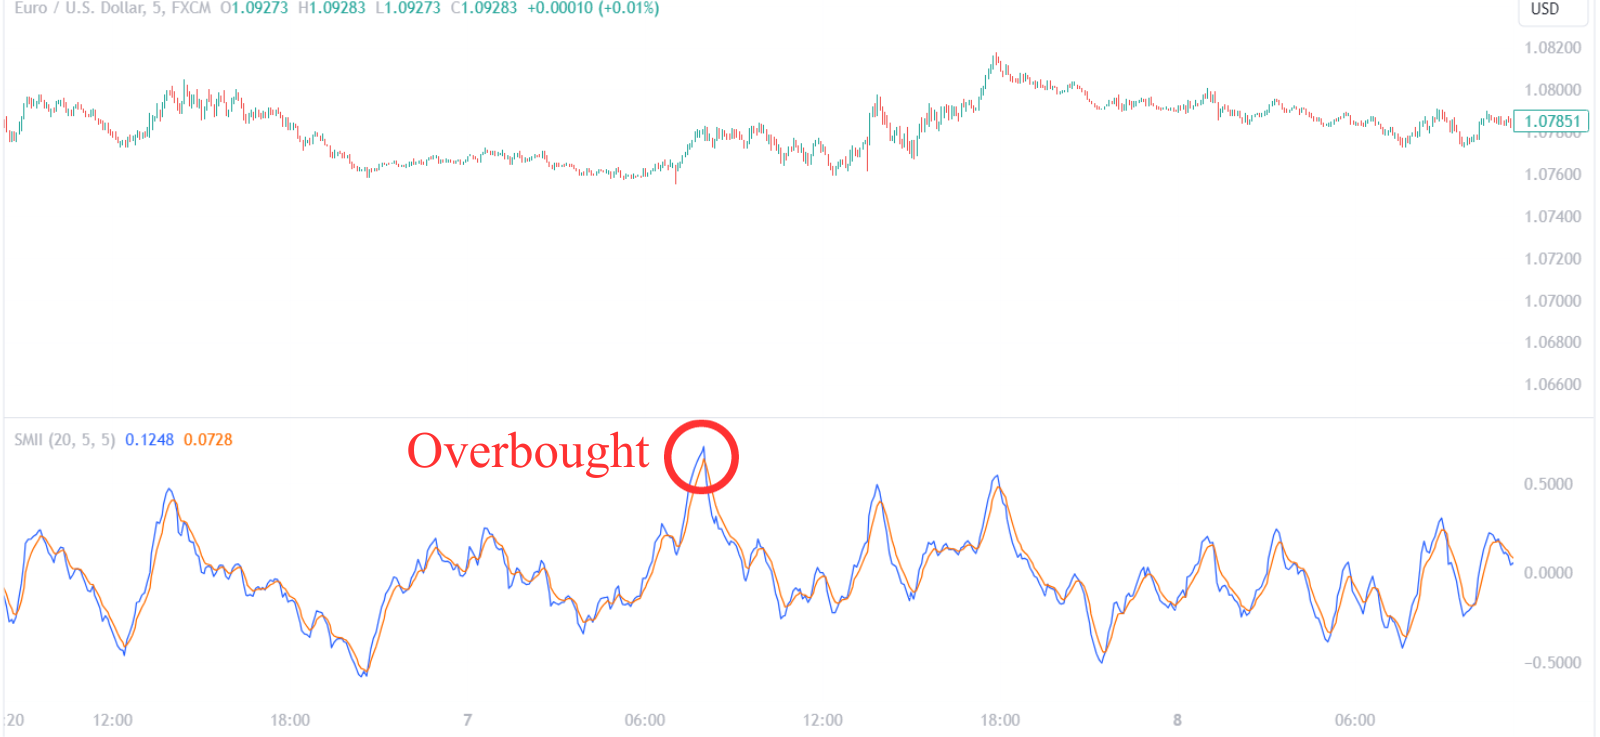
The SMI Ergodic Indicator is adept at pinpointing overbought and oversold market conditions which are critical for traders looking to capitalize on potential reversals. Overbought conditions suggest that an asset may be priced too highly and could be due for a downturn, while oversold conditions indicate an asset might be undervalued and poised for an upward correction.
To identify these conditions, traders observe the SMI Ergodic’s value relative to its thresholds. Typically, a value above a certain upper threshold, such as +40, signals an overbought market. Conversely, a value below a lower threshold, like -40, denotes an oversold market. These thresholds are not fixed and may vary based on the asset and market volatility.
Critical SMI Ergodic Values for Market Conditions
| SMI Ergodic Value | Market Condition |
|---|---|
| Above +40 | Overbought |
| Below -40 | Oversold |
Traders should consider these conditions as a prompt to look for additional confirmations before executing trades. For instance, in an overbought market, one might look for bearish reversal patterns or rising sell volume as confirmation to enter a short position. Similarly, in oversold conditions, bullish patterns and increasing buy volume can validate a long entry.
It’s important to integrate the overbought and oversold signals with other aspects of market analysis. The SMI Ergodic indicator should not be the sole determinant of trade decisions. Instead, it functions best when combined with other technical indicators, fundamental analysis, and an understanding of the broader market context.
3.2. Divergence Trading with SMI Ergodic
Divergence Trading with SMI Ergodic
Trading based on divergence involves identifying when the price action of an asset and an indicator, like the SMI Ergodic, are moving in opposite directions. This phenomenon can signal a potential reversal in the current trend. A bullish divergence occurs when prices form lower lows while the SMI Ergodic indicator forms higher lows, indicating a weakening downward momentum. Conversely, bearish divergence is present when prices reach higher highs but the SMI Ergodic creates lower highs, suggesting fading upward momentum.
To effectively trade divergences with the SMI Ergodic, traders should closely monitor the behavior of the indicator in relation to price. A key strategy is to look for divergence at extreme SMI Ergodic values. For instance, a bullish divergence near the -40 level could be a strong signal for a long position. Similarly, a bearish divergence around the +40 level might be a compelling cue for a short position.
Incorporating divergence into trading strategies requires a disciplined approach to confirmation. Entry points should be validated by additional indicators such as moving averages, RSI, or MACD. It’s also crucial to assess volume trends alongside divergence to gauge the strength of the potential reversal.
Risk management is paramount when trading divergences. Traders should set stop-loss orders to protect against false signals and unexpected market moves. The use of risk-reward ratios can help in determining viable take-profit levels, ensuring that trades are not only entered with caution but also exited with precision.
| Divergence Type | SMI Ergodic Behavior | Price Action | Confirmation Strategy |
|---|---|---|---|
| Bullish | Higher lows | Lower lows | Look for increasing buy volume, use additional indicators for entry confirmation |
| Bearish | Lower highs | Higher highs | Monitor sell volume, validate with other technical tools |
By focusing on these aspects, traders can leverage the SMI Ergodic indicator to spot potential reversals and enhance their trading decisions with a robust, divergence-based approach.
3.3. Combining SMI Ergodic with Other Technical Tools
Enhancing SMI Ergodic Signals with Moving Averages
Moving averages are foundational tools for traders, providing insights into the market’s direction. When the SMI Ergodic indicator signals a potential reversal, confirming this with a moving average can add a layer of reliability. For instance, a bullish divergence on the SMI Ergodic combined with the price crossing above a significant moving average, such as the 50-day or 200-day, can reinforce the likelihood of an uptrend.
Utilizing Oscillators for Additional Confirmation
Oscillators like the Relative Strength Index (RSI) or the Stochastic Oscillator are valuable for identifying overbought or oversold conditions. Traders can look for confluence between the SMI Ergodic divergence and these oscillators reaching extreme levels. A bearish divergence on the SMI Ergodic, alongside an RSI reading above 70, could suggest an impending downturn.
Incorporating Volume Analysis
Volume analysis can provide a deeper understanding of the strength behind price movements. An increase in volume accompanying a bullish SMI Ergodic divergence indicates strong buyer interest, potentially validating the signal. Conversely, a bearish divergence with rising sell volume might confirm a sell-off ahead.
Applying Trend Lines and Support/Resistance Levels
Trend lines and support/resistance levels are critical in defining market structure. The SMI Ergodic’s effectiveness is amplified when divergences align with a bounce off a trend line or a break through a key support or resistance level. This alignment can serve as a robust entry or exit signal for traders.
| Technical Tool | Purpose in Combination with SMI Ergodic | Signal Reinforcement |
|---|---|---|
| Moving Averages | Confirm market direction | Trend confirmation |
| Oscillators (RSI, Stochastic) | Identify overbought/oversold conditions | Extremes validation |
| Volume Analysis | Gauge strength of price movements | Interest confirmation |
| Trend Lines/Support/Resistance | Define market structure | Structural alignment |
By integrating these technical tools with the SMI Ergodic indicator, traders can filter out noise, increase the probability of successful trades, and execute strategies with greater confidence.
4. What Are the Best Strategies for Using the SMI Ergodic Indicator?
Trend Following with the SMI Ergodic Indicator
To capitalize on the SMI Ergodic Indicator, trend-following strategies are highly effective. Traders should look for the SMI Ergodic line to cross above the signal line to signify a bullish trend, and conversely, a bearish trend is indicated when the SMI Ergodic line crosses below the signal line. These crossovers can be powerful when they occur in conjunction with a recent bounce off a significant moving average, such as the 50-day or 200-day moving average.
Reversal Trades and Divergence
Another strategy involves reversal trades which are predicated on divergence between price and the SMI Ergodic Indicator. A bullish divergence occurs when the price records a lower low, but the SMI Ergodic forms a higher low, suggesting weakening downward momentum and a potential upside reversal. Similarly, a bearish divergence is present when the price hits a higher high while the SMI Ergodic makes a lower high, indicating fading upward momentum and a possible downside reversal.
Breakout Confirmation
For breakout traders, the SMI Ergodic Indicator can confirm the strength of a breakout. A strong move accompanied by a corresponding sharp rise or fall in the SMI Ergodic value adds credibility to the breakout, suggesting it is not a false signal. This is particularly true if the breakout occurs with increasing volume, which can be observed through volume analysis.
Combining with Other Technical Tools
| Strategy | SMI Ergodic Role | Complementary Tool | Purpose |
|---|---|---|---|
| Trend Confirmation | Directional Crossover | Moving Averages | Confirm trend validity |
| Overbought/Oversold Plays | Extremes Identification | Oscillators (RSI, Stochastic) | Validate momentum extremes |
| Strength of Breakouts | Breakout Confirmation | Volume Analysis | Confirm breakout with volume strength |
| Structural Trades | Alignment with Structure | Trend Lines/Support/Resistance | Trade bounces or breaks of key levels |
By integrating the SMI Ergodic with these strategies and tools, traders can enhance their market analysis and improve the timing and reliability of their trades. It is critical to use the SMI Ergodic in the context of overall market conditions and in conjunction with other technical analysis tools for optimal results.
4.1. Short-Term Trading Strategies
Scalping for Profits
Scalping is a popular short-term trading strategy that involves making numerous trades over a day to capture small price movements. Traders utilizing this method typically set tight stop-losses and have a laser focus on entry and exit points. The key to successful scalping lies in liquidity and volatility; highly liquid markets allow for quick entry and exit, while volatility provides the price movements necessary to make a profit.
Momentum Trading
In momentum trading, traders look for high-volume securities moving in one direction and attempt to jump on the bandwagon to profit from the trend. Identifying momentum can involve looking for stocks hitting new highs or news items that are likely to cause significant movement. Timing is critical, and traders often use short-term indicators like the 1-minute or 5-minute moving averages to pinpoint the perfect entry and exit points.
Utilizing Breakouts
Traders focusing on breakouts look for instances where the price moves outside a defined support or resistance level with increased volume. This strategy relies on the premise that such breaks often lead to significant directional moves. Volume is a key indicator; a breakout accompanied by high volume has a higher chance of success.
| Strategy | Key Indicator | Focus |
|---|---|---|
| Scalping | Liquidity & Volume | Tight stop-losses, quick trades |
| Momentum Trading | Volume & Trend | Following short-term trends |
| Breakouts | Volume & Price | Trading outside key levels |
News Playing
Short-term traders often capitalize on the volatility triggered by news events. By trading the news, traders must be quick to react as markets can move rapidly in response to announcements. This strategy requires a real-time news source and the ability to quickly analyze the potential market impact.
Reversion to the Mean
This strategy is based on the theory that prices and returns eventually return to the mean or average. This mean reversion strategy is typically applied in range-bound markets, where traders identify the overbought and oversold conditions using technical indicators like the Relative Strength Index (RSI) or Bollinger Bands. Positions are taken when a deviation from the mean is observed, with the expectation that prices will revert back to the mean level.
4.2. Long-Term Position Trading Strategies
Fundamental Analysis
Long-term position trading strategies often revolve around fundamental analysis. This involves a deep dive into a company’s financial health, management quality, market position, and potential for future growth. Traders employing this strategy typically look for undervalued stocks or sectors with strong growth prospects. They may hold positions for months or even years, as they are less concerned with short-term market fluctuations and more focused on the long-term value.
Buy and Hold
The buy-and-hold strategy is a classic example of long-term position trading. Traders select stocks with strong fundamentals or ETFs tracking indices, commodities, or other assets, and retain them through market cycles. This approach benefits from compound interest and dividends, and it requires less time to monitor daily market movements. The key here is patience and a strong conviction in the chosen assets’ long-term performance.
Sector Rotation
Traders adopting long-term strategies may also engage in sector rotation, shifting investments to sectors expected to outperform in the coming economic cycle. This strategy relies on macroeconomic analysis and forecasts to predict sector performance. For instance, during an economic recovery, cyclical sectors like technology or consumer discretionary might be favored.
Technical Analysis for Entry and Exit
While long-term traders focus on fundamentals, they may still use technical analysis to refine entry and exit points. Identifying long-term trend lines, support, and resistance levels can help traders maximize returns by entering at a more favorable price and setting strategic stop-loss orders to protect against significant downturns.
| Strategy | Focus Area | Description |
|---|---|---|
| Fundamental Analysis | Company/Asset Health | In-depth examination of financials, management, and market position. |
| Buy and Hold | Long-term Value | Holding strong assets through market cycles to benefit from dividends and compound interest. |
| Sector Rotation | Economic Cycles | Allocating investments to sectors likely to outperform based on macroeconomic trends. |
| Technical Analysis | Entry/Exit Points | Using chart patterns to determine optimal times to enter or exit a position. |
By integrating these strategies, long-term position traders aim to build a robust portfolio that can weather short-term market volatility while capitalizing on the growth potential over extended periods.
4.3. Risk Management Techniques with SMI Ergodic Indicator
Risk Management Techniques with SMI Ergodic Indicator
The SMI Ergodic Indicator, a tool used by traders to gauge market momentum, can be an effective component in a risk management strategy. Providing clear signals for potential trend reversals enables traders to adjust their positions before large market moves. The indicator consists of two lines: the SMI line and the Signal line. A crossover of these lines can indicate a change in trend, which traders may use as a trigger to tighten stops or take profits.
Position sizing can be refined using the SMI Ergodic Indicator. For instance, when the SMI line is in a strong upward trend above the Signal line, traders might increase their position size in a controlled manner. Conversely, if the SMI line crosses below the Signal line, it could be a signal to reduce exposure or switch to assets showing stronger momentum.
Setting stop-loss orders based on the SMI Ergodic Indicator can help protect capital. Traders might place a stop-loss just below a recent low if the SMI line is above the Signal line, suggesting an uptrend. If the SMI line is below the Signal line, indicating a potential downtrend, a stop-loss could be set just above a recent high.
Diversification, while not a direct function of the SMI Ergodic Indicator, complements its use. By spreading investments across various assets that show positive momentum signals from the SMI Ergodic Indicator, traders can mitigate risk further. This approach aligns with sector rotation strategies, where assets within sectors poised for growth are preferred.
Incorporating the SMI Ergodic Indicator into a broader trading plan is crucial. It should be used in conjunction with other analysis methods, such as fundamental analysis or other technical indicators, to confirm signals and strengthen decision-making. This multi-faceted approach is key to managing risk and enhancing the potential for consistent trading profits.


