
1. What is the Up/Down Volume Ratio?
The Up/Down Volume Ratio is a market sentiment indicator used by traders to understand the buying and selling pressure on a given trading day. It is calculated by dividing the volume of shares traded on upticks (price going up) by the volume of shares traded on downticks (price going down). This ratio provides insight into the overall bullishness or bearishness of market participants.
For instance, a ratio greater than 1 indicates that more volume is associated with rising prices, suggesting a bullish sentiment. Conversely, a ratio less than 1 implies that there is more volume on downticks, indicating a bearish sentiment. When the ratio is exactly 1, it suggests a neutral market where buying and selling pressures are balanced.
2. How do You Calculate the Up/Down Volume Ratio?
To calculate the Up/Down Volume Ratio, the following points can help traders:
2.1. Identifying Up Volume and Down Volume
Identifying up volume and down volume is critical to effectively use the Up/Down Volume Ratio. Up volume is recorded when transactions occur at a price higher than the previous trade, indicating buyer dominance. Conversely, down volume is logged when trades are executed at a price lower than the preceding transaction, suggesting seller control.
To ascertain these volumes, traders examine each trade’s price in comparison to the previous trade. Trades at a higher price than the one preceding it contribute to the up volume tally, while trades at a lower price add to the down volume. Trades occurring at the same price as the previous trade are typically excluded from this analysis or are proportionally divided between up and down volume based on the direction of the preceding price movement.
Real-time tracking of up and down volumes allows traders to respond swiftly to shifts in market sentiment. For instance, a sudden spike in down volume may suggest an impending price drop, prompting a trader to consider a short position or exit a long position.
| Example Time Frame | Up Volume | Down Volume |
| Intraday (1 Hour) | 50,000 | 40,000 |
| Daily | 1,000,000 | 950,000 |
| Weekly | 4,500,000 | 4,000,000 |
2.2. The Up/Down Volume Ratio Formula
The Up/Down Volume Ratio is calculated by dividing the total up volume by the total down volume over a specific time frame. The formula is:
[ \text{Up/Down Volume Ratio} = \frac{\text{Up Volume}}{\text{Down Volume}} ]
This formula outputs a numerical value that traders interpret as a signal of market sentiment. A value above 1 implies a bullish sentiment, as more volume is associated with price increases. Conversely, a value below 1 suggests bearish sentiment, with more volume linked to price decreases.
Example Calculation:
| Day | Up Volume | Down Volume | Up/Down Volume Ratio |
| 1 | 2,000,000 | 1,500,000 | 1.33 |
| 2 | 1,500,000 | 2,000,000 | 0.75 |
| 3 | 2,500,000 | 2,500,000 | 1.00 |
In this example:
- On Day 1, the Up/Down Volume Ratio of 1.33 indicates more trading volume occurred on price upswings.
- On Day 2, the ratio of 0.75 demonstrates a dominance of trading volume on price downswings.
- On Day 3, the ratio is 1.00, indicating an equilibrium between up and down volumes.
2.3. Analyzing Different Time Frames
When analyzing the Up/Down Volume Ratio across different time frames, traders can capture a spectrum of market sentiments, from short-term noise to long-term trends. It’s pivotal to comprehend that the ratio’s implications may vary depending on whether it is applied to intraday, daily, weekly, or even monthly data. Each time frame can shed light on distinct aspects of market behavior and trader psychology.
Short-term intraday analysis, for example, can be fraught with volatility and may reflect immediate reactions to news or market events. Here, the ratio can fluctuate wildly, offering insights into the knee-jerk reactions of traders. In contrast, longer-term assessments like weekly or monthly analyses tend to smooth out these short-term aberrations, often providing a clearer picture of underlying trends.
Comparative Analysis of Different Time Frames:
| Time Frame | Trend Indication | Typical Use-Case |
| Intraday | Short-term volatility | Day trading |
| Daily | Near-term momentum | Swing trading |
| Weekly | Intermediate trends | Position trading |
| Monthly | Long-term trends | Strategic portfolio review |
3. How to Use the Up/Down Volume Ratio in Trading?
The Up/Down Volume Ratio in Trading can be set up with the help of the following points:
3.1. Recognizing Bullish and Bearish Signals
Bullish and bearish signals are pivotal in trading, and the Up/Down Volume Ratio is a vital indicator for spotting these trends. A ratio consistently above 1 may point to a bullish trend, as it indicates that most trading volume is associated with price increases. On the flip side, a ratio below 1 often flags bearish sentiment, revealing that more volume is tied to decreasing prices.
Bullish Indicators:
- Persistent high ratios over a timeframe suggest strong buying pressure.
- Sudden spikes in up volume, particularly when accompanied by positive news or market events, could indicate the start of an upward price movement.
Bearish Indicators:
- Consistently low ratios imply sustained selling pressure.
- Sharp increases in down volume might signal an impending price drop or a reversal of an uptrend.
Traders can utilize the Up/Down Volume Ratio to inform their strategies, but it’s crucial to remain aware of the context in which these signals occur. The ratio’s relevance is amplified when it aligns with other technical indicators and broader market trends.
Example of Signal Interpretation:
| Ratio | Volume | Price Action | Potential Interpretation |
| 1.4 | High | Breakout | Strong Bullish Signal |
| 0.7 | High | Support Breach | Strong Bearish Signal |

By integrating the ratio with price action—such as breakouts above resistance or breaches below support—traders can gain additional insights into market momentum.
Additionally, the Up/Down Volume Ratio can inform risk management decisions. A high ratio might justify a tighter stop-loss order in anticipation of a continued uptrend, while a low ratio could prompt a more conservative approach to protect against potential declines.
Risk Management Alignment:
- High Ratio: Consider tighter stop-losses to capitalize on bullish momentum.
- Low Ratio: Employ broader stop-losses or reduce position size to mitigate potential losses.
3.2. Combining with Other Technical Indicators
When integrating the Up/Down Volume Ratio with other technical indicators, traders enhance their market analysis and fortify decision-making processes. The ratio’s effectiveness multiplies when used alongside tools that measure trend strength, momentum, and potential reversals.
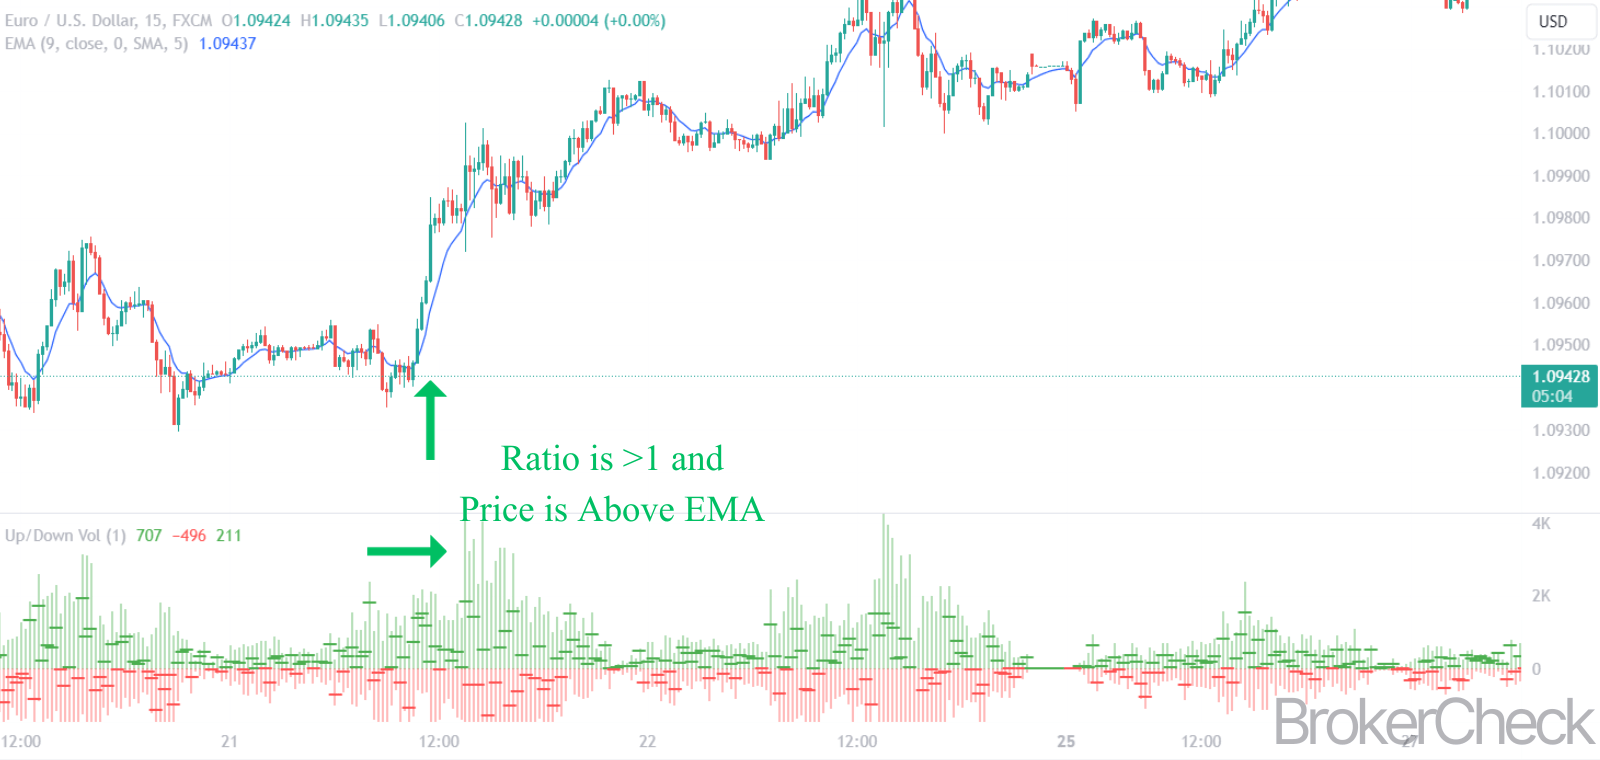
Moving Averages are frequently paired with the Up/Down Volume Ratio. A simple moving average (SMA) or an exponential moving average (EMA) can help smooth out price data to identify the prevailing trend direction. When the Up/Down Volume Ratio aligns with the direction of the moving average, it can reinforce the legitimacy of a trend.
Oscillators, such as the Relative Strength Index (RSI) or Stochastic, can provide context to the ratio by indicating overbought or oversold conditions. For example, an Up/Down Volume Ratio above 1 coupled with an RSI below 30 could suggest a potential reversal from a bearish to a bullish trend.
Key Indicator Combinations:
- Up/Down Volume Ratio + SMA/EMA: Confirms trend direction.
- Up/Down Volume Ratio + RSI/Stochastic: Identifies overbought/oversold conditions.
MACD (Moving Average Convergence Divergence) is another powerful tool that can be combined with the Up/Down Volume Ratio. When both the MACD and the ratio indicate bullishness, it may signal a strong buying opportunity. Conversely, bearish signals from both tools can warn of a potential sell-off.
Bollinger Bands can also complement the Up/Down Volume Ratio by providing insights into market volatility and price levels relative to the standard deviations. A high Up/Down Volume Ratio near the upper Bollinger Band could indicate a strong uptrend, whereas a low ratio near the lower band might signal a downtrend.
Effective Indicator Synergies:
- Up/Down Volume Ratio + MACD: Verifies momentum.
- Up/Down Volume Ratio + Bollinger Bands: Assesses volatility and trend strength.
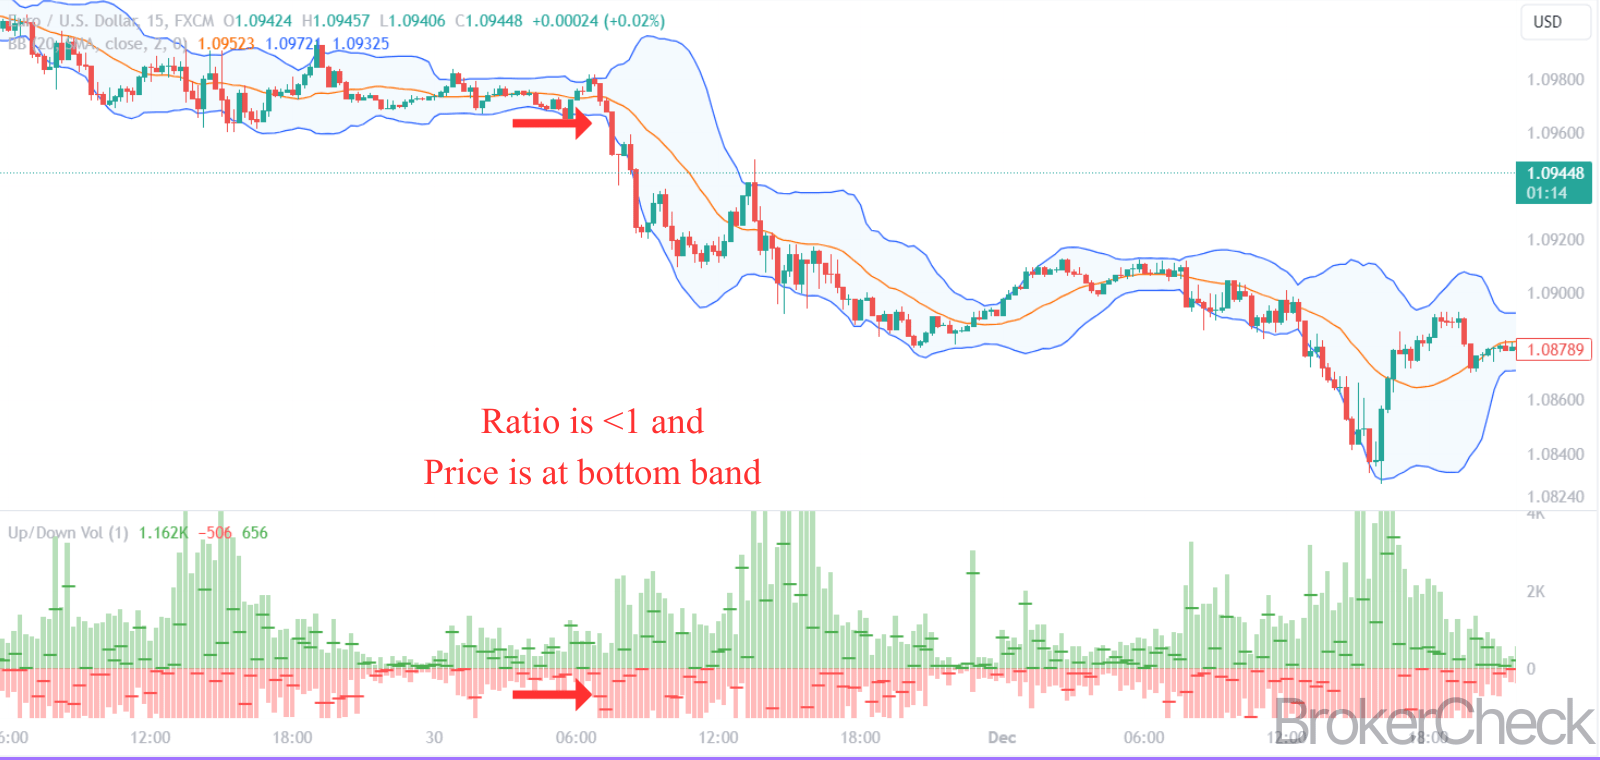
Chart Patterns and Price Action are essential for interpreting the Up/Down Volume Ratio within the context of market structure. Breakouts or breakdowns with corresponding high up or down volume ratios can provide actionable signals.
Practical Combinations for Trade Entry:
| Indicator | Ratio | Price Action | Signal Strength |
| Moving Averages | > 1 | Price above MA | Strong Bullish |
| RSI/Stochastic | < 1 | RSI > 70 | Strong Bearish |
| MACD | > 1 | MACD Crossover | Confirmed Bullish |
| Bollinger Bands | < 1 | Price at Lower Band | Confirmed Bearish |
3.3. Setting Up Volume Ratio Alerts
Volume ratio alerts act as an early warning system, enabling traders to preemptively adjust their positions in response to shifting market dynamics. The alerts are configured based on specific volume ratio thresholds that are deemed significant for the trader’s strategy. When the Up/Down Volume Ratio crosses these pre-set levels, the trader receives a notification, which can be a prompt to execute a trade or perform a deeper analysis.
Setting Up Alerts:
- Select Alert Thresholds: Choose ratio levels that align with historical data indicating significant market moves.
- Configure Alert Parameters: Input the chosen thresholds into the trading platform’s alert system.
- Determine Alert Types: Decide on the type of notification preferred (e.g., email, SMS, pop-up).
- Apply to Appropriate Time Frames: Set alerts for time frames relevant to trading style (intraday, daily, etc.).
Example Alert Configuration:
| Ratio Level | Alert Type | Time Frame | Action Prompt |
| Above 1.3 | Daily | Review for long position entry | |
| Below 0.8 | SMS | Intraday | Consider exiting long positions |
Alerts must be tailored to the trader’s specific needs, taking into account their risk tolerance, trading style, and the particular market they are trading in. The key is to set alerts that provide actionable intelligence rather than overwhelming the trader with unnecessary notifications.
Optimizing Alert Usage:
- Immediate Response: Use alerts for conditions requiring quick action, like sudden volume spikes.
- Confirmation: Set alerts as a secondary confirmation for signals from other technical analysis tools.
- Adjustments: Regularly review and adjust alert parameters to stay aligned with evolving market conditions.
4. What are the Limitations of the Up/Down Volume Ratio?
The Up/Down Volume Ratio is a quantitative metric providing insights into market sentiment. However, it has some limitations that are mentioned below:
4.1. False Signals and Market Noise
The Up/Down Volume Ratio is a tool traders use to discern market trends, but it has its pitfalls, particularly regarding false signals and market noise. These false signals can lead traders astray, prompting actions that may not align with the underlying market conditions. Market noise, consisting of random fluctuations that do not correlate with long-term trends, can magnify this problem, especially when the ratio is applied to shorter time frames.
Key Issues with False Signals and Market Noise:
- Overreaction to Short-Term Events: Traders might misinterpret short-lived spikes in volume as lasting trends.
- Misreading Market Sentiment: A high Up/Down Volume Ratio could be mistaken for bullish sentiment when it may be the result of a one-time event or anomaly.
To mitigate the risks associated with false signals and market noise, traders often employ filters or look for confirmation from other indicators or market data. For instance, a trader might wait for additional confirmation of a trend by observing consistent ratio levels over a longer period before making a trade decision.
Strategies to Counter False Signals:
- Use of Filters: Apply moving averages or other smoothing techniques to the ratio to reduce the impact of outliers.
- Confirmation Requirement: Seek corroborating signals from price action, other volume indicators, or market fundamentals.
Example of Filtering and Confirmation:
| Indicator | Filter Applied | Additional Confirmation | Interpretation |
| Up/Down Volume Ratio | 10-day SMA | Price above 50-day MA | A more reliable bullish signal |
| Up/Down Volume Ratio | 10-day SMA | Price below 50-day MA | Less reliable; caution advised |
Traders should also be aware of the timing of trades based on volume signals. Acting on volume data without considering the context can result in suboptimal trade execution. Assessing the Up/Down Volume Ratio in conjunction with market cycles and upcoming economic events can enhance its effectiveness.
Timing Considerations for Trades:
- Avoidance of Hasty Decisions: Resist the urge to trade on abrupt ratio shifts without thorough analysis.
- Informed Entry and Exit: Time trades to coincide with supportive market conditions and avoid periods of excessive noise.
4.2. Impact of Market Events
Market events dramatically influence the Up/Down Volume Ratio, often leading to abrupt changes in trading volume that can misrepresent underlying market sentiment. Events like earnings announcements, central bank decisions, or political developments can cause significant volume spikes or drops, temporarily skewing the ratio.
Direct Impacts of Market Events:
- Earnings Reports: Sharp volume increases often accompany these, with the ratio reflecting the market’s immediate reaction, which may not be sustainable.
- Economic Data Releases: High-impact data can lead to volatile trading, with the Up/Down Volume Ratio experiencing short-term spikes in either direction.
- Geopolitical Events: Uncertainty or tension can cause market-wide risk aversion, often resulting in higher down volume and a lower ratio.
Traders need to differentiate between volume changes driven by genuine shifts in market sentiment and those resulting from transient events. A spike in the Up/Down Volume Ratio might not necessarily signal a sustainable bullish trend if it’s purely event-driven. Conversely, a sudden drop in the ratio could reflect a knee-jerk reaction rather than a true bearish reversal.
Analyzing Market Event Impact:
- Pre-Event Positioning: Traders might anticipate potential outcomes and adjust their positions accordingly, affecting volume and the ratio.
- Post-Event Reaction: The immediate aftermath of an event can see heightened volume as the market assimilates new information.
- Long-Term Trend Confirmation: It’s essential to observe whether subsequent volume and price action confirm or negate the initial event-driven movement.
Example of Market Event Analysis:
| Event Type | Immediate Ratio Impact | Post-Event Observation Period | Long-Term Trend Confirmation |
| Earnings Report | High Up Volume (Ratio > 1) | Next 5-10 Trading Days | Price and Volume Stabilization |
| Economic Release | Low Down Volume (Ratio < 1) | Following 3-5 Trading Days | Continuation or Reversal of Price Action |
4.3. Volume Data Accuracy
Volume data accuracy plays a pivotal role in the reliability of the Up/Down Volume Ratio. Discrepancies in volume reporting can stem from various sources, such as differences in exchange data, reporting errors, or delays in data dissemination. These inaccuracies can distort the Up/Down Volume Ratio, leading to misinformed trading decisions.
Common Sources of Inaccuracy:
- Exchange Discrepancies: Variations in how exchanges report volume data can lead to inconsistencies.
- Reporting Errors: Mistakes in data entry or processing can affect the accuracy of volume figures.
- Data Feeds: Latency or errors in electronic data feeds can result in outdated or incorrect information.
Traders must ensure the integrity of the volume data they rely on. This often involves using multiple data sources to cross-verify information or subscribing to reputable data services known for their accuracy and timeliness.
Steps to Ensure Data Accuracy:
- Cross-Verification: Compare volume data across different platforms or data providers.
- Reputable Sources: Use data from established, reliable market data services.
- Real-Time Access: Employ platforms that offer real-time volume data to minimize the impact of delays.
Example of Data Source Comparison:
| Data Source | Reported Up Volume | Reported Down Volume | Calculated Ratio |
| Source A | 150,000 | 100,000 | 1.5 |
| Source B | 148,000 | 102,000 | 1.45 |
| Source C | 152,000 | 98,000 | 1.55 |
By referencing multiple sources, traders can identify potential anomalies and achieve a more accurate representation of market volume. Moreover, selecting the right timeframe is essential, as volume accuracy can fluctuate throughout the trading day. Peak trading hours typically provide the most reliable data due to higher liquidity and transaction volumes.
Timeframe Considerations for Volume Accuracy:
- Peak Hours: Focus on periods with higher trading activity for the most accurate volume data.
- Off-Hours: Be cautious with volume data outside of main trading sessions, as lower liquidity can lead to inaccuracies.
5. What to Consider When Integrating Up/Down Volume Ratio into Your Trading Strategy?
When integrating the Up/Down Volume Ratio into your trading strategy, it’s essential to consider the following:
5.1. Risk Management Techniques
Effective risk management is critical for traders incorporating the Up/Down Volume Ratio into their strategies. Diverse techniques can be employed to manage exposure and mitigate potential losses.
Key Risk Management Techniques:
- Stop-Loss Orders: Utilize stop-loss orders to automatically exit positions at predetermined price levels, thereby capping potential losses if the market moves contrary to expectations.
- Position Sizing: Allocate capital to positions based on the strength of the volume ratio signal, ensuring that the size of any given trade is in proportion to the trader’s risk tolerance and account size.
Position Sizing and Stop-Loss Configuration:
| Signal Strength | Position Size (% of Capital) | Stop-Loss (% from Entry) |
| Strong (Ratio > 1.5) | 10% | 2% |
| Moderate (1 < Ratio < 1.5) | 5% | 3% |
| Weak (Ratio ≈ 1) | 2% | 5% |
Diversification is another crucial aspect of risk management. By not putting all eggs in one basket, traders can reduce the impact of a wrong call based on the Up/Down Volume Ratio.
Diversification Strategy Components:
- Across Asset Classes: Spread exposure across asset classes to avoid systemic risks associated with any single class.
- Within Asset Classes: Invest in various sectors and instruments to minimize sector-specific or instrument-specific risks.
Example of Diversified Portfolio Allocation:
| Asset Class | Sector/Instrument | Allocation % |
| Equities | Technology | 20% |
| Equities | Healthcare | 15% |
| Fixed Income | Corporate Bonds | 25% |
| Commodities | Gold | 10% |
| Forex | Major Currency Pairs | 30% |
Continuous education and practice enable traders to adapt to changing market conditions and refine their application of the Up/Down Volume Ratio.
Continuous Improvement Tactics:
- Market Research: Stay abreast of financial news, economic indicators, and global events that can affect volume dynamics.
- Backtesting: Use historical data to test how the Up/Down Volume Ratio would have performed, helping to identify strengths and weaknesses in the strategy.
Backtesting Framework:
| Historical Period | Number of Trades | Win Rate | Average Profit/Loss |
| Last 12 months | 50 | 60% | 2.1% |
| Last 5 years | 250 | 55% | 1.8% |
5.2. Portfolio Diversification
Portfolio diversification is a cornerstone of sound trading strategy, particularly when integrating analytical tools like the Up/Down Volume Ratio. Diversification acts as a risk mitigation tactic, spreading exposure across various asset classes and sectors to minimize the impact of adverse price movements in any single investment.
Diversification Benefits:
- Risk Reduction: By investing across different assets, the negative performance of one can be offset by the positive performance of another.
- Volatility Management: A diversified portfolio typically experiences lower volatility, as the varied assets often do not move in tandem.
A diversified portfolio can buffer against misleading signals that might arise from the Up/Down Volume Ratio, especially when the ratio is affected by short-term market noise or events. By not over-relying on a single indicator for all trading decisions, traders can better navigate complex market environments.
Diversification Strategy Breakdown:
- Asset Class Diversity: Include a mix of stocks, bonds, commodities, and currencies to insulate against market-specific shocks.
- Sectoral Diversity: Spread investments across multiple sectors such as technology, healthcare, finance, and energy.
- Geographical Diversity: Allocate funds to international markets to take advantage of varying economic cycles and reduce country-specific risks.
Example of Asset Allocation:
| Asset Type | Allocation |
| Equities | 40% |
| Fixed Income | 30% |
| Commodities | 15% |
| Cash/Cash Equivalents | 5% |
| Cryptocurrencies | 10% |
Moreover, diversification should be dynamic, reflecting changes in market conditions, economic indicators, and individual financial goals. Regular portfolio rebalancing ensures that the desired level of diversification is maintained.
Rebalancing Strategy:
- Periodic Review: Assess and adjust the portfolio composition on a regular schedule, such as quarterly or annually.
- Threshold-Based Rebalancing: Implement changes whenever an asset class deviates from its target allocation by a predetermined percentage.
Rebalancing Parameters:
| Asset Class | Target Allocation | Rebalance Trigger |
| Equities | 40% | ±5% |
| Fixed Income | 30% | ±5% |
| Commodities | 15% | ±3% |
| Cash/Cash Equivalents | 5% | ±2% |
| Cryptocurrencies | 10% | ±2% |
5.3. Continuous Education and Practice
Continuous education and practice are indispensable for traders aiming to leverage the Up/Down Volume Ratio effectively. The financial markets are in a state of perpetual evolution, with new patterns and behaviors emerging as the global economic landscape shifts. Traders must commit to learning and adapting their strategies to maintain a competitive edge.
Continuous Education and Practice:
- Stay Informed: Regularly engage with the latest financial research, news, and expert analysis to understand the factors influencing volume changes and market sentiment.
- Skill Enhancement: Develop a deeper understanding of technical analysis and the Up/Down Volume Ratio by attending workshops, webinars, and courses offered by seasoned professionals.
- Practice and Refinement: Use trading simulations and paper trading to hone skills without financial risk, allowing for experimentation with the Up/Down Volume Ratio in various market scenarios.
Benefits of Continuous Education:
- Adaptability: Ability to quickly adapt trading strategies in response to market changes.
- Informed Decision-Making: Enhanced capability to make decisions based on a comprehensive understanding of market dynamics.
- Confidence: Increased confidence in using the Up/Down Volume Ratio, supported by a solid foundation of knowledge and practice.
Strategies for Effective Practice:
- Backtesting: Evaluate the effectiveness of the Up/Down Volume Ratio using historical data to simulate past market conditions.
- Paper Trading: Execute trades in a risk-free environment using real-time market data to test strategies without actual capital at stake.
- Performance Review: Regularly analyze trading performance to identify areas for improvement and validate the effectiveness of the Up/Down Volume Ratio within the trading strategy.
Example of an Education and Practice Plan:
| Activity | Frequency | Objective |
| Financial News Review | Daily | Stay current with market trends |
| Technical Analysis Course | Quarterly | Improve analytical skills |
| Trading Simulation | Monthly | Test and refine trading strategies |
| Strategy Performance Analysis | Bi-Annually | Assess the effectiveness and make adjustments |