How to Trade Stocks With Pivot Points
Technical analysis
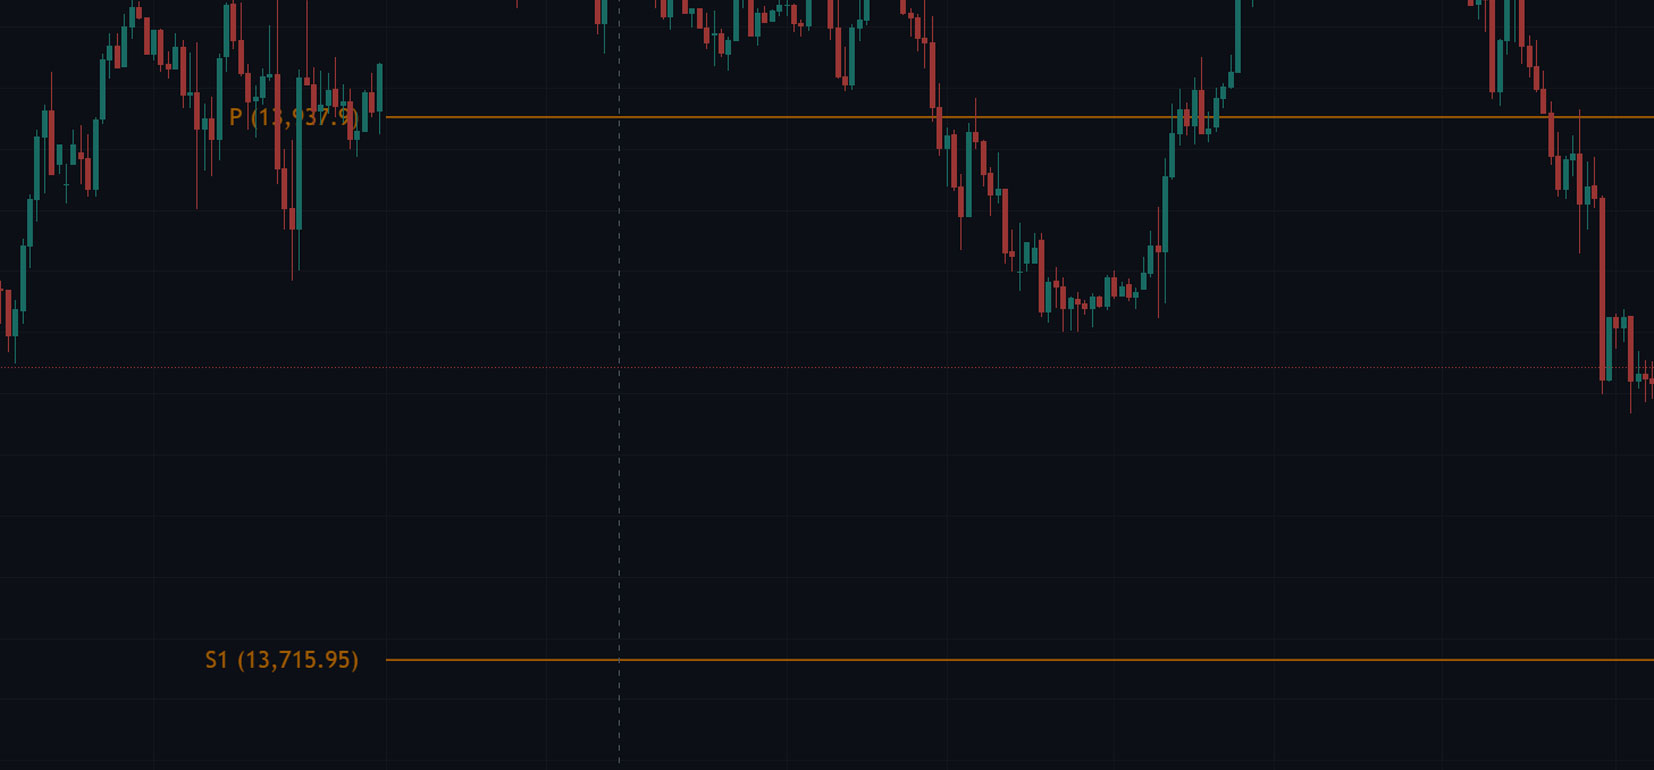
Pivot points are a popular indicator used by traders to predict where a market is likely to go. The price of a stock that retreats below a pivot point indicates that it is in a bad spot.
Pivot points are calculated using a simple formula. It uses the previous day’s high and low prices as well as the closing prices of the day before.
When the price of a stock is trading above a pivot point, this indicates that the overall sentiment is positive and the market is bullish. Conversely, when the price of a stock is trading below a pivot point, this indicates that the sentiment is negative and the market is bearish.
There are two major types of pivot points: daily and weekly. A daily pivot point is the most common. Weekly pivot points are also commonly used.
Pivot points can be used for support and resistance. They help a trader determine where to set a stop loss and where to exit a position. But, a trader needs to use other forms of technical analysis along with pivot points to maximize the effectiveness of his or her investment.
Traditionally, floor traders on stock exchanges used pivot points as a way to predict levels of support and resistance in the market. Floor traders used the previous day’s low and high prices, as well as the close price. This method provided a quick view of how the market might move.
Traders can use pivot points as an intraday indicator for stocks or futures. They can then plan out their trades before they start. They can use the pivot point system to exit a position, enter a position, or reenter a position depending on their needs and risk tolerance.
Pivot points are useful for detecting market ranges and potential trend change points. However, they are not a perfect indicator and cannot be used to predict the exact direction of the price. If a trader believes that a specific stock has a tendency to go down, they should try to enter a position before the price hits the pivot point’s support level. Likewise, if a trader thinks that a stock has a tendency to go up, they should try to enter a position when the price hits the pivot’s resistance level.
Resistance and support levels
Support and resistance are two important parts of a trading strategy. They help traders to identify when they should buy and sell. There are several ways to identify support and resistance on a chart. These include moving averages, Fibonacci retracement and trend lines.
Moving averages are one of the most popular indicators for identifying support and resistance levels. This technical indicator appears as a curving line and can be used to identify the areas of highest and lowest price.
The Fibonacci retracement is also a popular tool for determining support and resistance. This technique can be used to determine where a strong trend will retrace.
Pivot points can also be used to identify major support and resistance levels. A pivot point is a series of lines derived from the high and low prices for the day. Using this method, traders will be able to identify two support and two resistance levels.
Regardless of what time frame you use, it is important to identify the appropriate levels for your particular trade. These levels will help you to minimize risk and maximise profit potential.
The most simple way to plot support and resistance is by using lows and highs. Traders should set their targets slightly below the support level and slightly above the resistance level.
Resistance and support levels are not exact points, but rather zones in which demand and supply can change. Identifying the correct support and resistance can give traders a clear picture of the current state of the market.
Market psychology plays a key role in the market’s movement. When the prices of a certain asset begin to fall, buyers are likely to enter the market. Conversely, when the prices of an asset begin to rise, sellers are more likely to exit the market.
Traders must look for a significant pause in the decline of a price before a reversal. Once they spot such a reversal, they will be able to take advantage of the situation.
Traders should always remember to place their entries and exits at the most advantageous points. Whether it is by using moving averages, pivot points or trendlines, make sure you understand the relevant support and resistance levels before taking a position.
Intraday trading strategies
Pivot points are a technical analysis tool that can be applied to stock indices, especially for intraday trading. These indicators are used to analyze the market and forecast support and resistance levels.
Pivot point calculations are important because they can be used as entry and exit signals for the trader. In addition, pivot points can be used to determine the direction of the price.
There are several different types of pivot points. The basic pivot point is located in the middle of the chart. It is made up of the average of the high and low prices from the previous day. However, it is also possible to use different formulas to find the appropriate pivot levels.
When a pivot point is touched, it is usually a good time to buy the stock. This is because the stock is likely to follow a bullish trend and you will have the opportunity to make a profit. You can also buy the stock when it reaches a support level.
A more sophisticated version of the pivot point is the Fibonacci projection. This is a mathematical sequence found in nature. It is commonly used by technical traders. Using this tool, you can identify support and resistance levels for the price.
As with any other indicator, it is recommended to combine this indicator with other trend indicators. Using the right tools can help you identify profitable trades and avoid losing ones. For example, you can place a stop-loss order at a certain level.
Another thing to consider is the type of trading strategy you plan to use. If you are new to the field, it is best to use a combination of indicators to determine the proper entry and exit points for your trading.
The best way to make the most of pivot points is to use a stop-loss order. By using this strategy, you can minimize risk and maximize the chances of winning. Also, remember to track a consistent group of stocks.
Other useful tools to use include the FTSE 100 index and its pivot point charts. Using these tools will give you a good idea of the overall direction of the market.
Pivot Points Summary
Traders often use pivot points to identify key support and resistance levels in the market. They can also be used as stop-loss levels. Pivot points can be used in conjunction with other technical analysis tools to better predict the direction of a stock’s trend.
Whether you are an amateur or an experienced trader, it is important to understand the purpose and use of pivot points. If you are looking to start trading stocks on a regular basis, pivot points can be a helpful tool for you. However, it is important to remember that pivot points are only a tool and that they cannot be considered a fool-proof way to trade.
Although they are very accurate in their estimations of key levels in the market, there are some downsides to using pivot points. The most obvious disadvantage is that the price of a stock does not necessarily follow a specific path. You can also run into confusion when you are using pivot points, as they are different from other forms of support and resistance.
It is essential to use pivot points with other technical indicators, such as moving averages and candlestick patterns. The more positive indicators you have, the greater your chances of success.
Another benefit of using pivot points is that they can provide a systematic approach to trading. For instance, if you know that a stock has a strong bearish trend, you can start buying it. Similarly, if you know that a stock is in a bullish trend, you can buy more of it as it rises.
In order to avoid confusion, it is important to color code your pivot points. This will allow you to quickly look at the risk and reward of every trade.
Depending on the time frame, you can use pivot points to spot key support and resistance levels, or to determine the overall trend of a particular stock. As a general rule, stocks that trade above a certain level are considered to be bullish. But, when a stock retreats below a pivot point, it is likely to be in a bad place.