


1. Overview of the Moon Phases Indicator
The Moon Phases Indicator is a unique and unconventional tool used in financial markets. Contrary to traditional financial indicators, which are typically based on mathematical calculations of price data, the Moon Phases Indicator correlates market movements with the lunar cycle. The premise behind this indicator is rooted in the belief that the moon’s gravitational pull, which influences tides and natural cycles on Earth, might also have an effect on market psychology and behavior.
1.1. Concept and Historical Background
The concept of using lunar cycles in financial markets isn’t new. It dates back to the early 20th century when financial astrologers first proposed that astronomical events could impact human emotions and, consequently, market trends. Modern proponents of this theory suggest that full moons and new moons can create emotional highs and lows that translate into market volatility or stability.
1.2. Functionality and Application
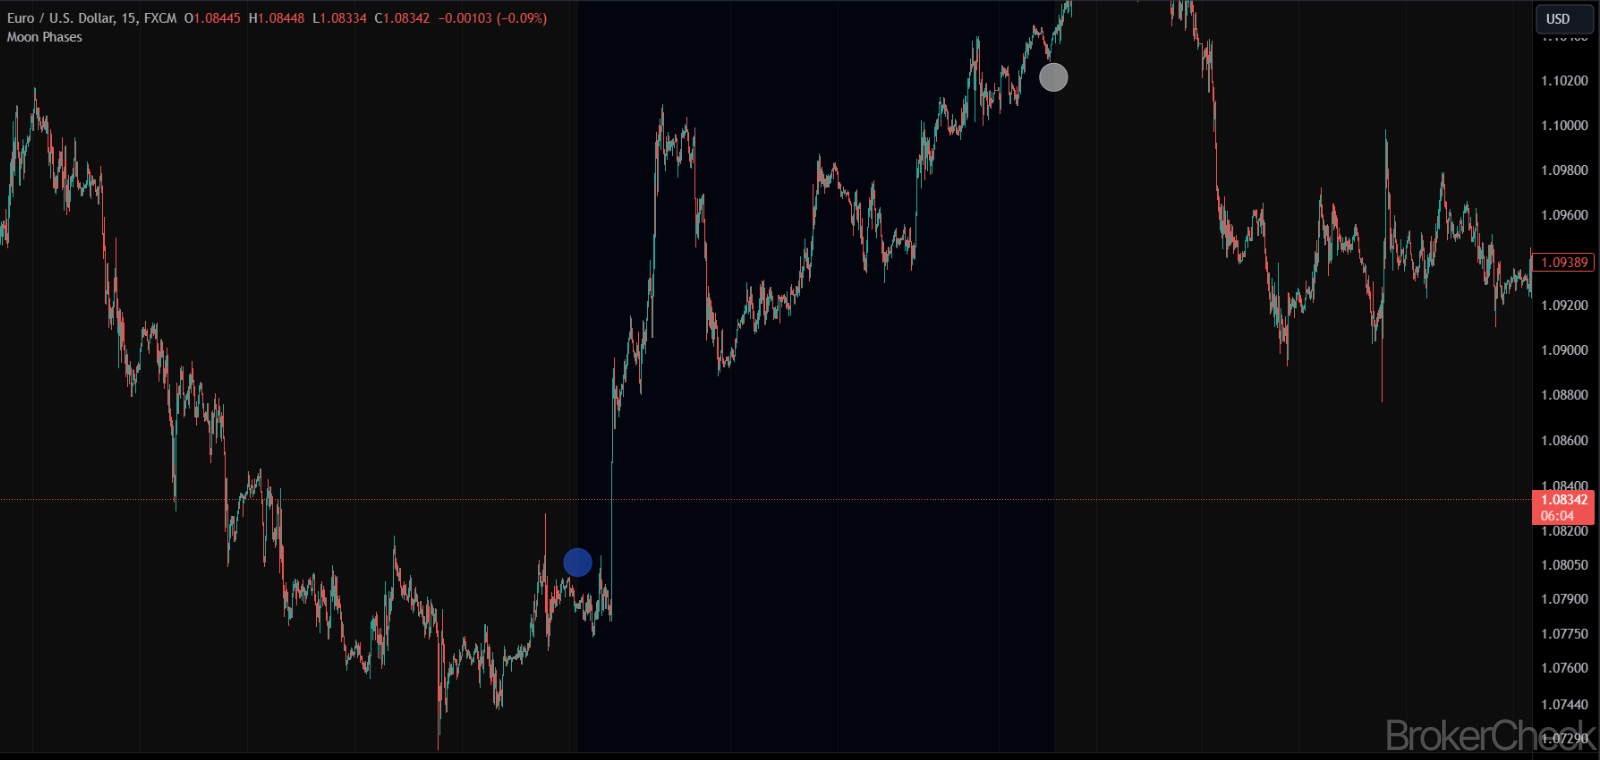
The Moon Phases Indicator marks the dates of new moons and full moons on a financial chart. Traders use these markers to anticipate potential shifts in market sentiment. For example, a full moon is often associated with heightened emotional responses and could theoretically lead to increased market volatility. Conversely, a new moon might correspond with a period of consolidation or reduced volatility.
1.3. Popularity and Reception
While not widely accepted or used in mainstream financial analysis, the Moon Phases Indicator has a niche following. It’s primarily utilized by traders interested in unconventional market analysis methods or those who incorporate astrological aspects into their trading strategies.
1.4. Advantages
- Unique Perspective: Offers a different viewpoint from traditional technical analysis.
- Complementary Tool: Can be used alongside other technical indicators for a more rounded analysis.
1.5. Limitations
- Lack of Scientific Backing: There’s limited empirical evidence supporting the efficacy of lunar cycles in predicting market movements.
- Subjectivity: Interpretations of the indicator can be highly subjective and vary greatly among traders.
Overall, the Moon Phases Indicator represents an unconventional approach in financial market analysis, drawing on theories from financial astrology. It’s essential for traders to understand both the intrigue and skepticism surrounding this tool and to consider it as a part of a broader, more diverse trading strategy.
| Aspect | Details |
|---|---|
| Concept | Correlates market movements with lunar cycles, based on the theory that the moon’s gravitational pull affects market psychology. |
| Historical Background | Rooted in early 20th-century financial astrology, suggesting astronomical events impact market trends. |
| Functionality | Marks new moons and full moons on financial charts to anticipate shifts in market sentiment. |
| Popularity | Has a niche following, especially among traders who integrate astrological aspects into their strategies. |
| Advantages | Provides a unique perspective and can complement other technical analysis tools. |
| Limitations | Lacks strong scientific backing and is subject to highly subjective interpretations. |
2. Interpretation of the Moon Phases Indicator
The interpretation of the Moon Phases Indicator in financial markets involves understanding how lunar phases might correlate with market sentiment and behavior. This section explores the different ways traders might interpret signals from this indicator.
2.1. New Moon and Market Sentiment
The new moon phase, often associated with beginnings and fresh starts, is observed by some traders for potential shifts towards bullish sentiment or the start of new market trends. Traders might look for increases in trading volume or trend reversals following a new moon.
2.2. Full Moon and Market Volatility
The full moon phase is traditionally linked with heightened emotions and potential unpredictability. In market terms, this could translate to increased volatility. Traders may watch for spikes in price movements or unusual market activity around full moons.
2.3. Lunar Phases and Market Cycles
Some traders analyze the correlation between lunar phases and longer-term market cycles. By tracking market performance over multiple lunar cycles, they attempt to identify patterns or cyclic trends that align with the lunar calendar.
2.4. Psychological Aspect
Given the nature of the Moon Phases Indicator, much of its interpretation is psychological, based on the belief that lunar cycles impact human emotions, which in turn influence market behavior. Traders using this indicator often combine it with an understanding of market psychology.
| Aspect | Interpretation |
|---|---|
| New Moon | Observed for potential bullish sentiment shifts or the beginning of new trends, indicated by volume increases or trend reversals. |
| Full Moon | Associated with increased volatility, observed through spikes in price movements or unusual market activity. |
| Lunar Phases and Market Cycles | Long-term tracking to identify patterns or cycles aligning with lunar phases. |
| Psychological Aspect | Focuses on the belief in lunar influence on human emotions and consequent market behavior. |
3. Combination of the Moon Phases Indicator with Other Indicators
Integrating the Moon Phases Indicator with other financial indicators can enhance its effectiveness and provide a more holistic view of the market. This section discusses how to effectively combine this astrological-based indicator with traditional technical analysis tools.
3.1. Moon Phases and Technical Analysis Indicators
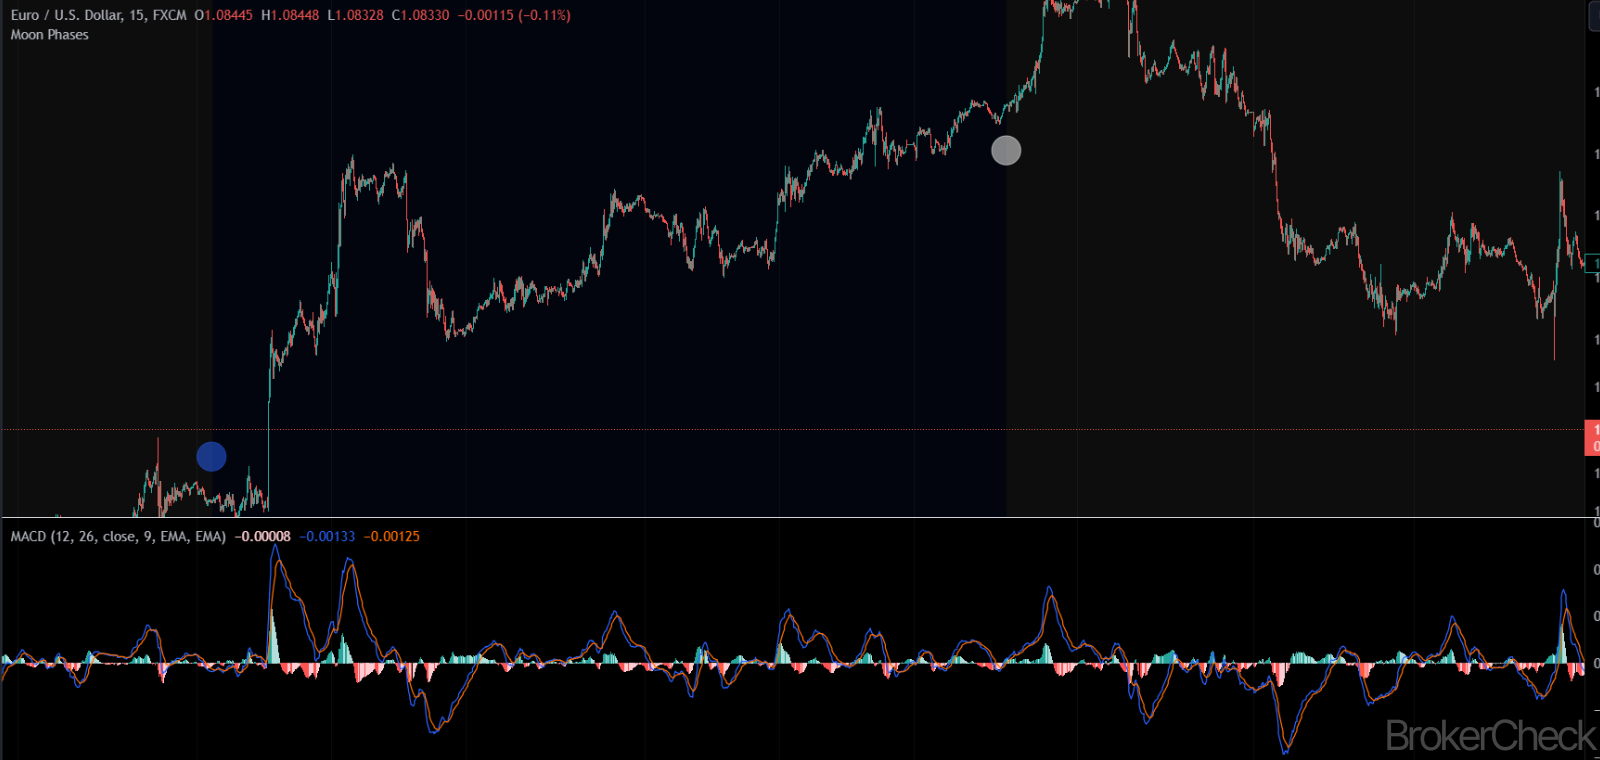
Combining the Moon Phases Indicator with standard technical analysis tools like moving averages, RSI (Relative Strength Index), or MACD (Moving Average Convergence Divergence) can help validate its signals. For instance, a new moon phase aligned with a bullish crossover in MACD could reinforce a potential trend reversal signal.
3.2. Lunar Cycles and Volume Analysis
Volume analysis can be particularly insightful when used alongside the Moon Phases Indicator. An increase in trading volume around new or full moons can provide additional confirmation of a change in market sentiment or increased volatility.
3.3. Using Sentiment Indicators
Sentiment indicators, such as the Fear and Greed Index or the Put/Call Ratio, can complement the Moon Phases Indicator. These tools can help gauge the emotional state of the market, aligning with the psychological basis of the Moon Phases Indicator.
3.4. Economic Calendar and Lunar Phases
Aligning the lunar cycle with the economic calendar can also be beneficial. Traders might observe how market reactions to economic events, such as interest rate decisions or employment reports, differ around new or full moons.
| Indicator | Combination with Moon Phases |
|---|---|
| Technical Analysis Indicators | Validate Moon Phases signals with tools like moving averages, RSI, or MACD. |
| Volume Analysis | Observe volume changes around lunar phases for additional market sentiment insights. |
| Sentiment Indicators | Use to gauge market emotions, supplementing the psychological aspect of the Moon Phases Indicator. |
| Economic Calendar | Analyze market reactions to economic events in relation to lunar phases. |
4. Risk Management When Using the Moon Phases Indicator
While the Moon Phases Indicator provides a novel approach to market analysis, it’s crucial to employ effective risk management strategies due to its unconventional nature and subjective interpretation. This section outlines key considerations for managing risks when using this indicator.
4.1. Diversifying Analysis Methods
Traders should not rely solely on the Moon Phases Indicator for decision-making. Combining it with other technical, fundamental, or sentiment analysis tools can provide a more balanced view of the market and reduce reliance on a single, unconventional method.
4.2. Setting Stop-Loss and Take-Profit Orders
Implementing stop-loss and take-profit orders is essential, especially given the speculative nature of the Moon Phases Indicator. These orders can help limit potential losses and lock in profits, providing a safety net for trades based on lunar cycle analysis.
4.3. Position Sizing
Maintaining appropriate position sizes is crucial. Traders should consider reducing their position sizes when trading based on the Moon Phases Indicator to mitigate potential risks associated with its subjective interpretations.
4.4. Continuous Market Education
Staying informed about market trends and continuously educating oneself about various trading strategies is important. This ongoing education can help traders better understand the context in which the Moon Phases Indicator might be most effective.
4.5. Emotional Discipline
Given the psychological aspect of the Moon Phases Indicator, maintaining emotional discipline is key. Traders should be aware of their biases and avoid making decisions based purely on the emotional allure of astrological-based trading.
| Strategy | Details |
|---|---|
| Diversifying Analysis | Combine the Moon Phases Indicator with other analysis methods to avoid reliance on a single approach. |
| Stop-Loss and Take-Profit | Use these orders to manage risks and protect investments when trading based on lunar cycles. |
| Position Sizing | Adjust position sizes appropriately to mitigate risks associated with the indicator’s subjectivity. |
| Continuous Education | Stay informed about broader market trends and trading strategies for a well-rounded approach. |
| Emotional Discipline | Maintain a disciplined approach to trading, being aware of and controlling emotional biases. |


