
1. Introduction to Aroon Indicator
The Aroon indicator, developed by Tushar Chande in 1995, is a powerful tool for traders looking to identify trend strength, potential reversals, and trading opportunities. Aroon, derived from the Sanskrit word “Aruna” meaning “dawn,” helps detect the emergence of new trends, much like the break of day. The indicator consists of two lines: the Aroon Up and Aroon Down, which fluctuate between 0 and 100, representing the strength of bullish and bearish trends.
2. Calculating Aroon: Step by Step
To calculate the Aroon indicator, follow these steps:
- Choose a period: Select the number of periods for the calculation. This is typically set at 14 or 25 days, but you can experiment with different periods to find the one that best suits your trading style, timeframe, and instrument.
- Identify highs and lows: Determine the highest and lowest price points during the chosen period. Keep track of the number of periods since these high and low prices occurred, as this information will be used in the next steps.
- Calculate Aroon Up: Divide the number of periods since the highest price by the total number of periods, and then multiply the result by 100. This will give you the Aroon Up value, which indicates the strength of the bullish trend. Higher values (closer to 100) suggest a stronger bullish trend, while lower values (closer to 0) indicate a weaker trend.
- Calculate Aroon Down: Divide the number of periods since the lowest price by the total number of periods, and then multiply the result by 100. This will give you the Aroon Down value, which indicates the strength of the bearish trend. Similar to the Aroon Up value, higher values (closer to 100) suggest a stronger bearish trend, while lower values (closer to 0) indicate a weaker trend.
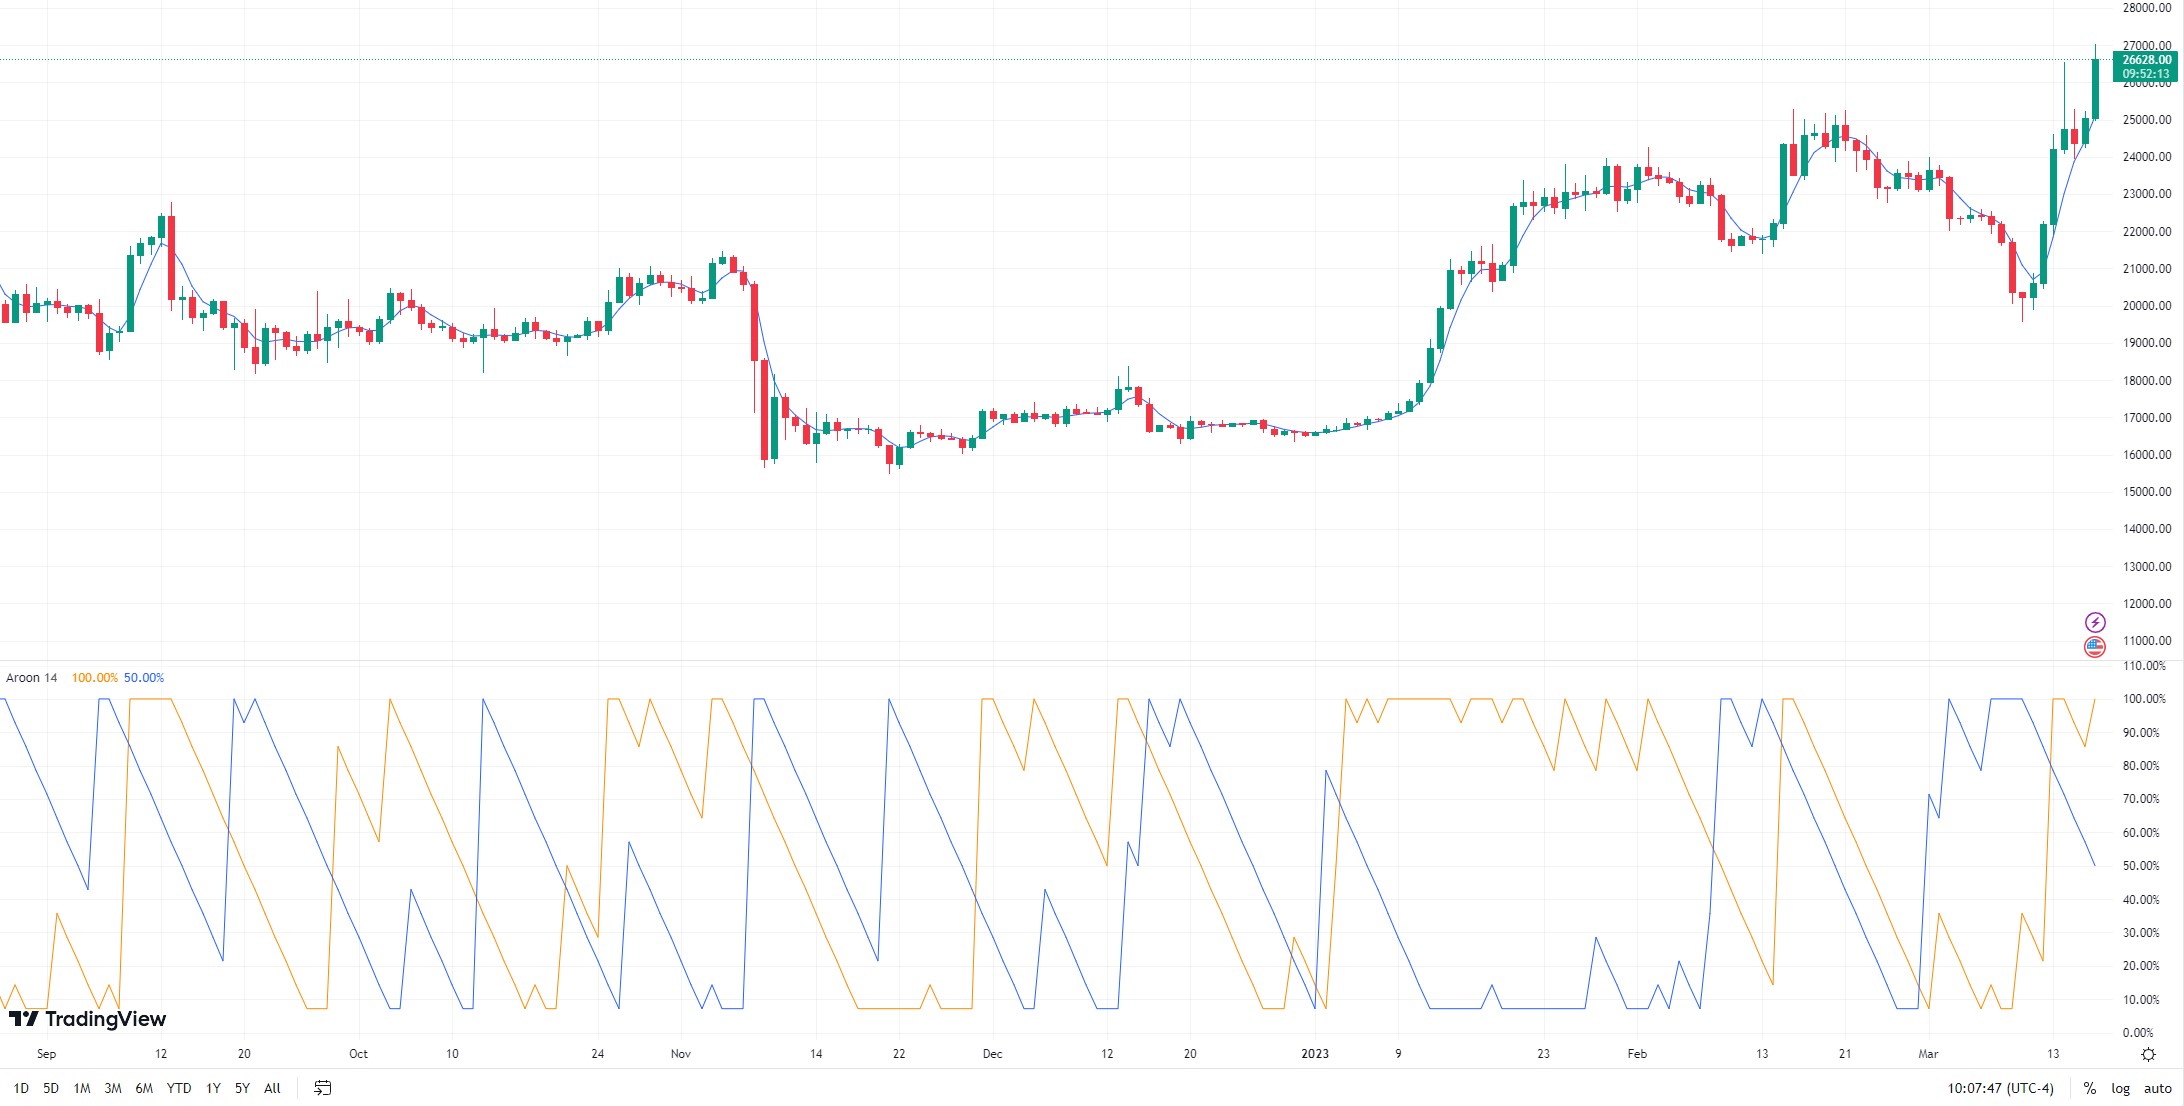
3. Interpreting Aroon Signals
Here’s how to interpret Aroon signals:
- Bullish trend: When the Aroon Up value is above 70, it indicates a strong bullish trend. This suggests that there is upward momentum in the market, and traders may look for buying opportunities to capitalize on the trend.
- Bearish trend: Conversely, when the Aroon Down value is above 70, it signals a strong bearish trend. This suggests that there is downward momentum in the market, and traders may look for selling opportunities to capitalize on the trend.
- Consolidation: If both Aroon Up and Down values are below 30, it suggests a lack of a trend or a period of consolidation. This may indicate that the market is moving sideways and could be preparing for a breakout in either direction. Traders may want to monitor the market closely during these periods and be prepared to act once a new trend emerges.
- Reversals: Aroon Up crossing above Aroon Down implies a potential bullish reversal, suggesting that the market may be shifting from a bearish to a bullish trend. Traders may look for buying opportunities in anticipation of the trend change. On the other hand, Aroon Down crossing above Aroon Up suggests a potential bearish reversal, indicating a shift from a bullish to a bearish trend. In this case, traders may look for selling opportunities to take advantage of the trend change.
By understanding and applying these interpretations of Aroon signals, traders can gain valuable insights into the market’s direction and potential trend changes, helping them make more informed trading decisions.
4. Examples of Aroon Indicator in Action
Consider a stock with a 25-day Aroon indicator. On day 1, the stock’s highest price was $100, and the lowest price was $80. By day 25, the highest price reached $120, and the lowest price was $85. Let’s interpret the Aroon signals:
- Calculate Aroon Up: Assume the highest price occurred 10 days ago. Divide 15 (25 – 10) by 25 and multiply by 100, resulting in an Aroon Up value of 60.
- Calculate Aroon Down: Assume the lowest price occurred 20 days ago. Divide 5 (25 – 20) by 25 and multiply by 100, resulting in an Aroon Down value of 20.
- Interpretation: In this case, the Aroon Up value is below 70, and the Aroon Down value is below 30, indicating that there is no strong trend in either direction.
In a real-world example, consider SPY during the market recovery of March 2020. The Aroon indicator successfully identified the bullish reversal as the Aroon Up crossed above the Aroon Down, providing traders with a valuable signal to capitalize on the upward trend.
5. Limitations and Considerations
While the Aroon indicator is a useful tool, it has its limitations:
- False signals: Aroon may produce false reversal signals during sideways markets or periods of high volatility.
- Lagging indicator: Aroon can be slow to react to rapid trend changes, potentially leading to late entries or exits.
- Complementary tools: Traders should use Aroon in conjunction with other technical analysis tools to confirm signals and enhance decision-making.