1. Overview of Moving Average Crossover Strategy
Moving average crossover strategies are among the most popular technical analysis tools used by traders to identify trends in financial markets. These strategies leverage the concept of moving averages, which help smooth out price data to provide a clearer picture of a market’s direction. The essence of the strategy lies in the relationship between two or more moving averages, with crossovers between them signaling potential trading opportunities. In this article, we will break down the moving average crossover strategy and guide you on how to apply it effectively in your trading.
1.1 Brief Overview of the Moving Average Crossover Strategy
A moving average crossover occurs when two different moving averages intersect. Most commonly, traders use a shorter-term moving average and a longer-term moving average. The crossover between these averages is seen as a signal that the trend may be shifting, which can inform buying or selling decisions. The basic idea is simple: when the shorter-term moving average crosses above the longer-term one, it signals a bullish trend. Conversely, when the shorter-term moving average crosses below the longer-term one, it may signal a bearish trend.
1.2 Importance of Understanding the Strategy
Understanding the moving average crossover strategy is crucial for traders because it provides a systematic approach to decision-making. By using this strategy, traders can avoid the pitfalls of emotional trading, relying instead on clear signals to inform their actions. The strategy is versatile and can be applied to various asset classes, including stocks, forex, and commodities. Mastery of this strategy enables traders to capitalize on trend changes and enhance their ability to manage risk and rewards effectively.
| Section | Description |
|---|---|
| 1.1 | Overview of the moving average crossover strategy, its concept, and importance in trading. |
| 1.2 | Why it’s critical to understand the strategy for systematic trading and risk management. |
| 1.3 | Structure of the article to guide readers from basics to advanced strategy application. |
2. Understanding Moving Averages
Moving averages are essential tools used by traders to smooth out price data and reveal trends over time. By calculating the average price over a specific period and continuously updating it, moving averages help filter out the short-term price fluctuations, or “noise,” that often obscures the true direction of the market. They are particularly useful in identifying and confirming trends, making them a core component of the moving average crossover strategy.
2.1 Definition of Moving Averages
A moving average represents the average price of an asset over a defined period, which adjusts as new prices are added. By doing so, it smooths the price data, making trends easier to spot. Traders use moving averages to gauge whether a market is trending upward, downward, or sideways over time. The moving average adjusts dynamically with the latest prices, which allows traders to see the general direction of an asset’s price without being distracted by short-term volatility.
2.2 Types of Moving Averages
There are different types of moving averages, each calculated differently to emphasize various aspects of price movement. The most common types of moving averages include the Simple Moving Average (SMA), Exponential Moving Average (EMA), and Weighted Moving Average (WMA).
The Simple Moving Average (SMA) is the most straightforward form, calculated by taking the average of an asset’s prices over a given time period. Each data point in this calculation has an equal weight, so the result is a simple average that reflects the historical prices evenly.
The Exponential Moving Average (EMA), in contrast, gives more importance to recent prices. This weighting causes the EMA to respond more quickly to recent price changes compared to the SMA. Because of this sensitivity, many traders prefer the EMA when they want to capture short-term market movements more accurately.
The Weighted Moving Average (WMA) is another variation where recent prices are assigned greater weight than older prices. Unlike the EMA, which applies exponential weighting, the WMA uses a linear weighting system, where the most recent price points have the most significant impact on the moving average.
2.3 How Moving Averages Are Calculated
The calculation of each type of moving average depends on its underlying methodology. The Simple Moving Average is calculated by summing up the closing prices over a chosen number of periods and dividing by the total number of periods. This method ensures that each price point within the period contributes equally to the average.
The Exponential Moving Average is calculated differently, using a more complex formula that applies a greater weight to recent prices. This weighting is achieved by using a smoothing factor, which is derived by dividing two by the number of periods plus one. The EMA calculation allows it to adapt more quickly to recent price changes, making it more reactive to the current market conditions.
The Weighted Moving Average multiplies each price point by a weighting factor. The most recent price data is given the highest weight, and earlier data points receive progressively smaller weights. This weighted sum is then divided by the sum of the weights to calculate the final average. This method allows the WMA to track price movements more responsively, like the EMA, but with a linear weighting approach.
2.4 Visual Representation of Moving Averages
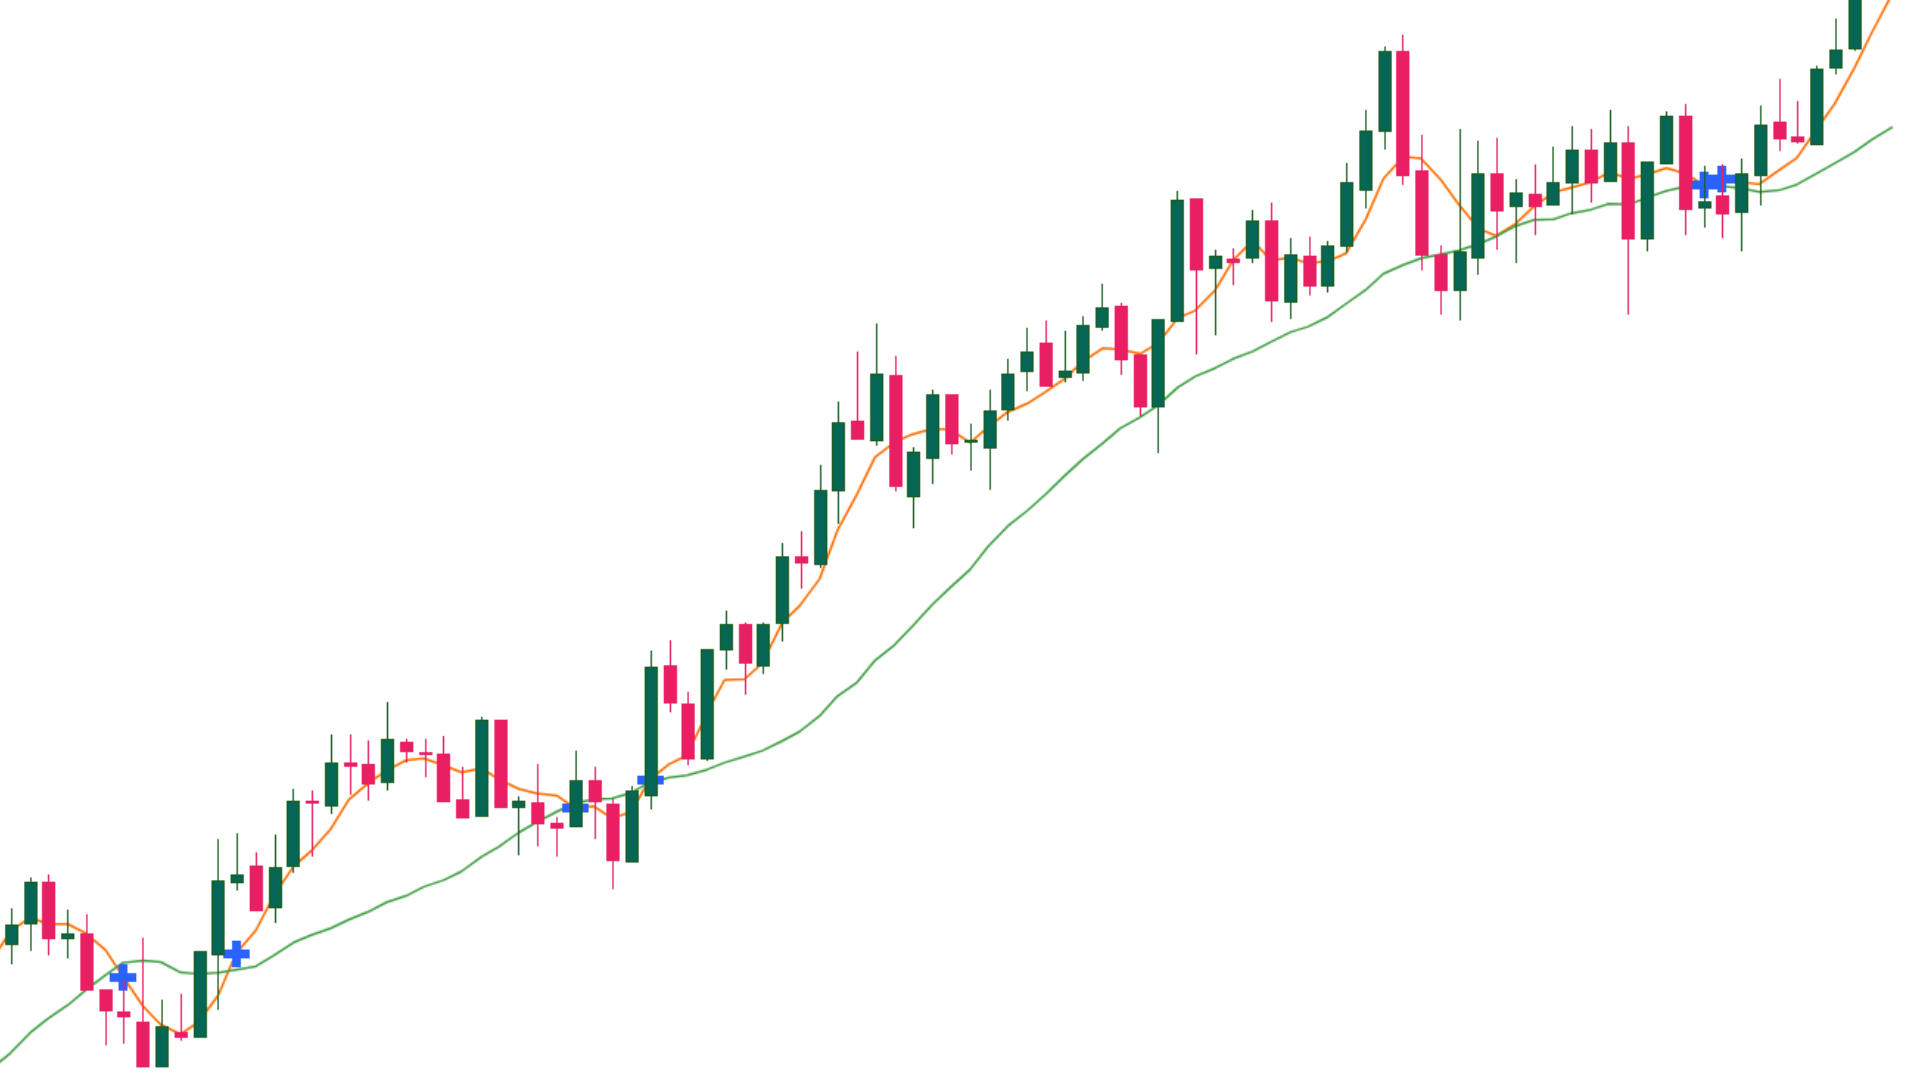
On a price chart, moving averages are represented as smooth lines that follow the general direction of the asset’s price. The value of the moving average changes as new price data is added, but it moves more slowly than the actual price to provide a clear view of the underlying trend. The moving average line helps traders visually assess whether the asset’s price is above or below the average, which indicates upward or downward momentum.
For example, in a bull market, the price of an asset might consistently stay above its moving average. In contrast, when the price falls below the moving average, it may suggest a bearish trend. The visual representation becomes even more powerful when multiple moving averages of different time frames are plotted together. The interaction between short-term and long-term moving averages creates the foundation for the crossover signals that this strategy relies on.
| Section | Description |
|---|---|
| 2.1 | Definition of moving averages and how they smooth price data to reveal trends. |
| 2.2 | Explanation of various types of moving averages, including SMA, EMA, and WMA. |
| 2.3 | Detailed breakdown of how each type of moving average is calculated. |
| 2.4 | Description of how moving averages are visualized on price charts and their role in identifying trends. |
3. The Crossover Concept
The moving average crossover is a crucial element in technical analysis, widely used to identify potential buy or sell signals in a market. A crossover occurs when two moving averages of different time periods intersect, signaling a potential shift in the trend direction. This section explains the concept of crossovers in detail and their significance for traders.
3.1 What is a Crossover?
A crossover happens when a shorter-term moving average crosses either above or below a longer-term moving average. This crossing point is considered a key signal for traders, indicating a potential trend reversal or the continuation of an existing trend. The premise is straightforward: when a shorter moving average, which reacts more quickly to price changes, crosses above a longer moving average, it can signal the start of a bullish trend. Conversely, when the shorter moving average crosses below the longer moving average, it may signal the beginning of a bearish trend.
The strength of the crossover signal depends on the time frames of the moving averages used. For example, a crossover between a 50-day and 200-day moving average is considered a stronger signal than one between a 5-day and 20-day moving average, as the longer time frames reduce the influence of short-term volatility.
3.2 Bullish Crossover vs. Bearish Crossover
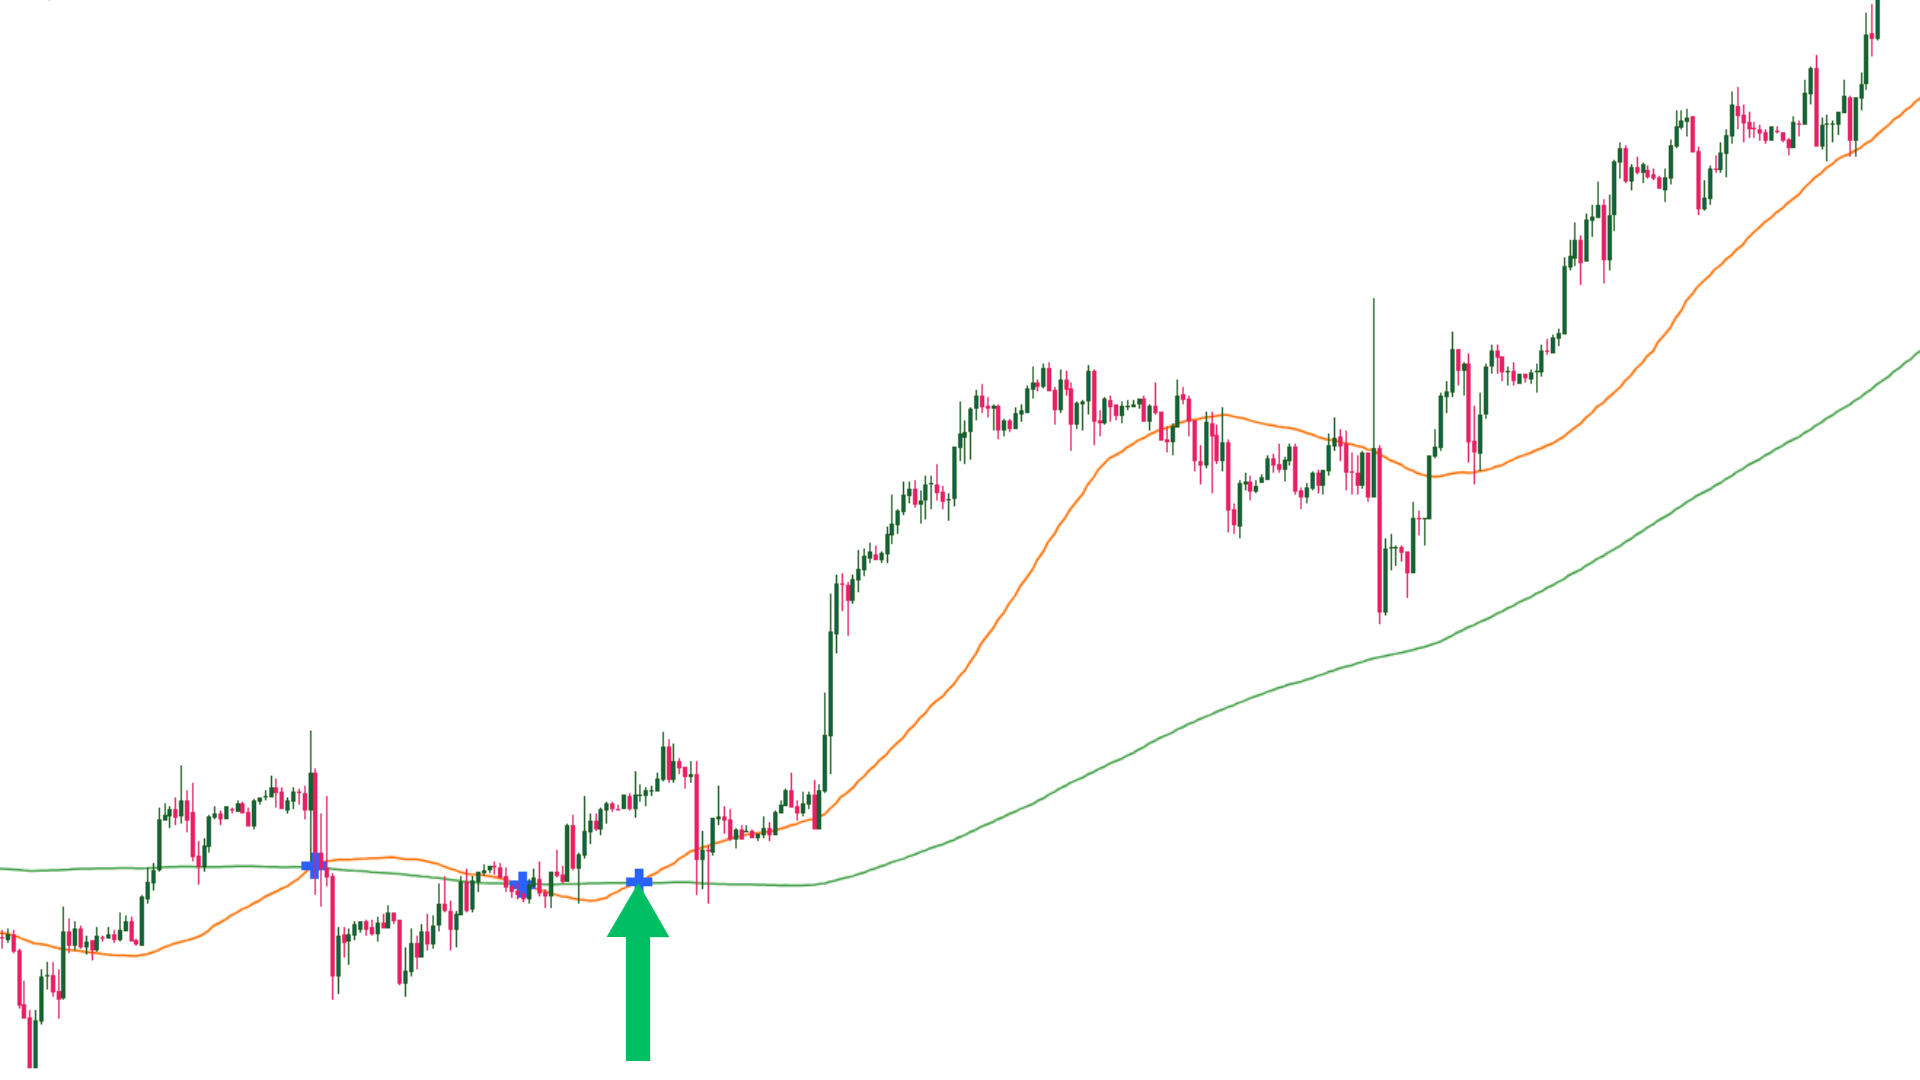
A bullish crossover occurs when a short-term moving average crosses above a long-term moving average. This indicates that recent prices are moving higher than the longer-term trend, suggesting that momentum is building in favor of an upward trend. The bullish crossover is often seen as a buy signal, prompting traders to enter long positions in anticipation of rising prices.
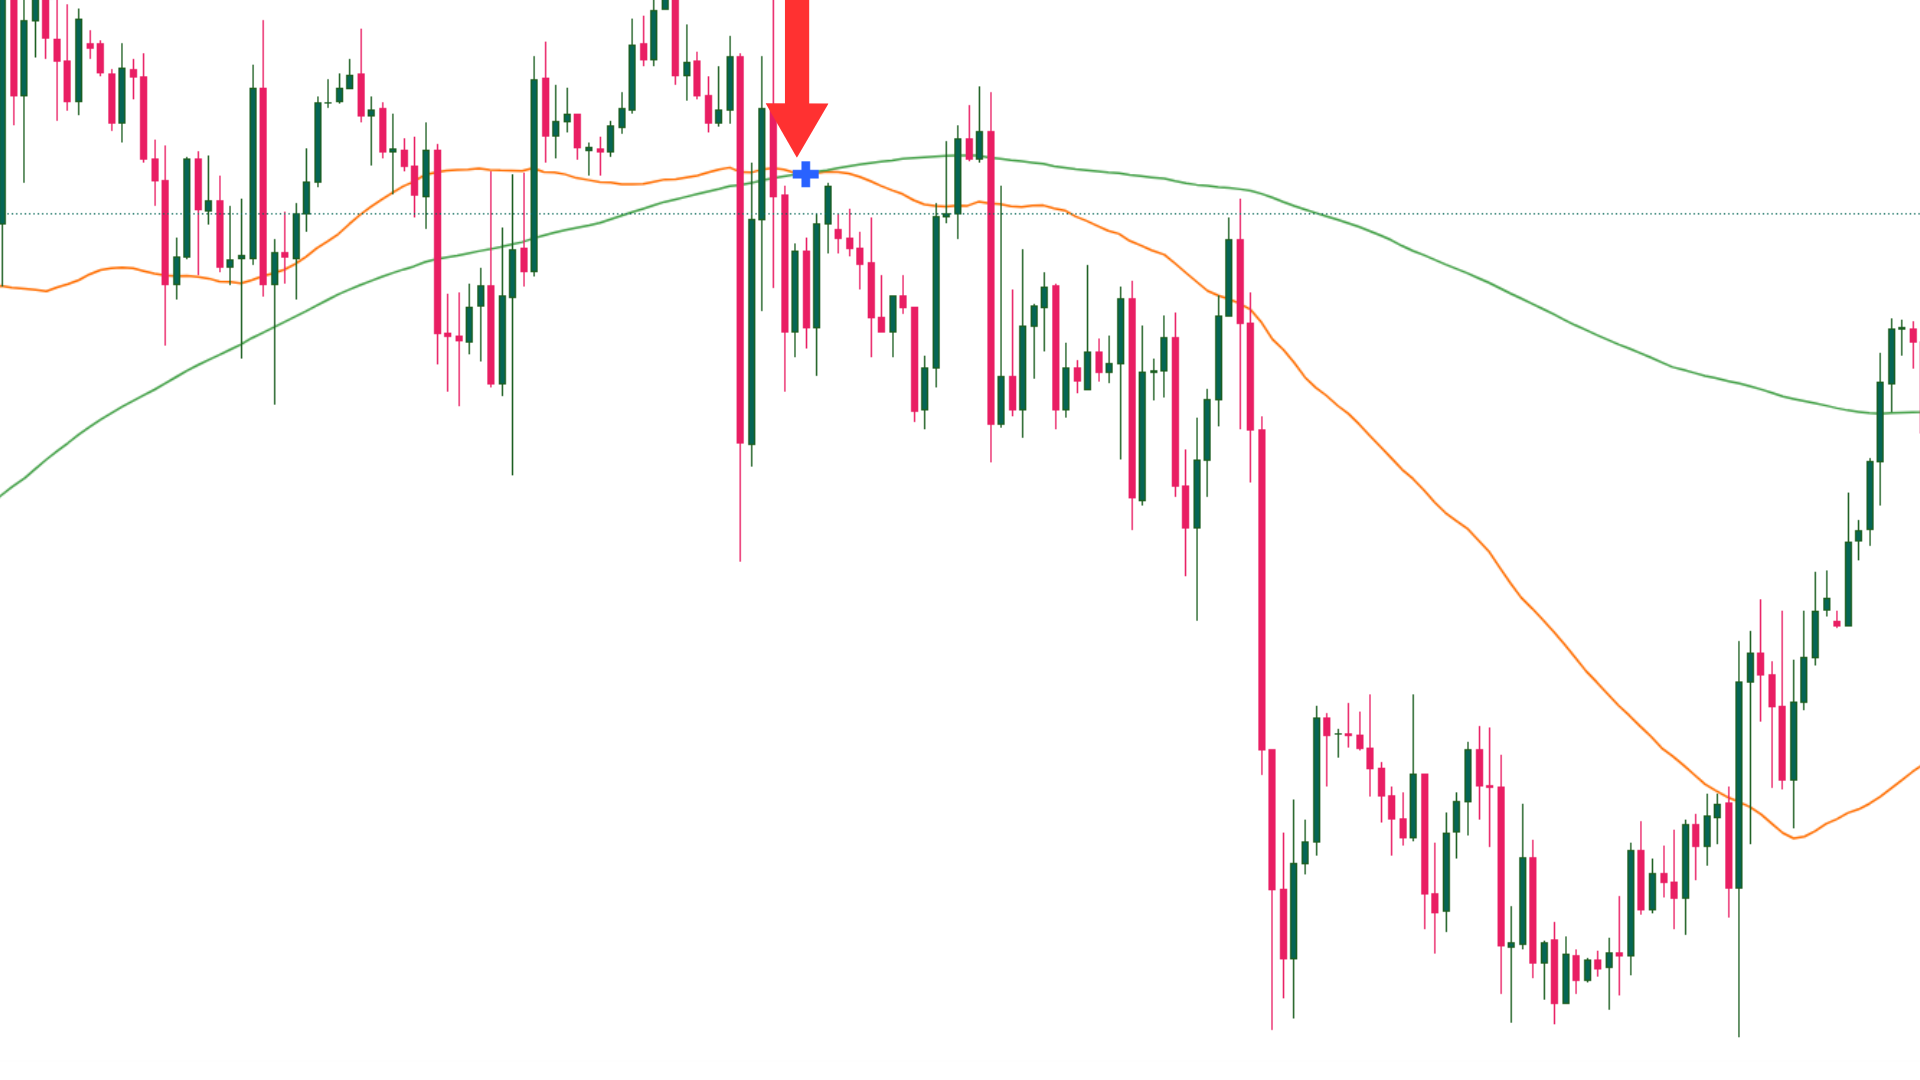
A bearish crossover, on the other hand, happens when a short-term moving average crosses below a long-term moving average. This suggests that recent prices are declining relative to the broader trend, signaling that a downtrend may be forming. Traders interpret bearish crossovers as a signal to sell or take short positions, preparing for a decline in asset prices.
Both bullish and bearish crossovers are important because they offer traders a clear, rule-based signal for entering or exiting positions, which reduces emotional decision-making in volatile markets.
3.3 Significance of Crossover Signals
The significance of crossover signals lies in their ability to identify trend shifts early, allowing traders to capitalize on potential market movements. These signals are most effective in trending markets, where they can confirm the continuation of an existing trend or mark the beginning of a new one.
Bullish and bearish crossovers provide clarity in situations where market trends might be ambiguous. They offer traders a systematic approach to determining entry and exit points, making the strategy particularly valuable for reducing emotional biases and enhancing discipline.
While crossovers are generally effective, it’s important to note that they are not foolproof. They can produce false signals, especially in ranging or choppy markets where prices fluctuate without a clear direction. To reduce the impact of false signals, traders often combine moving average crossovers with other technical indicators, such as the Relative Strength Index (RSI), to confirm the strength of a trend.
| Section | Description |
|---|---|
| 3.1 | Explanation of what a moving average crossover is and its role in indicating trend shifts. |
| 3.2 | Differences between bullish crossovers (buy signals) and bearish crossovers (sell signals). |
| 3.3 | Significance of crossover signals in identifying trend reversals and managing trading decisions. |
4. Choosing the Right Moving Averages
Selecting the appropriate moving averages for a crossover strategy is crucial for achieving successful results. The choice of time periods for the moving averages, the type of moving average, and how these factors align with your trading objectives all play an important role in determining the effectiveness of the strategy. In this section, we will explore how to choose the right moving averages based on various factors, common combinations used by traders, and the advantages and disadvantages of different setups.
4.1 Factors to Consider When Selecting Moving Averages
When choosing moving averages for a crossover strategy, traders need to take several factors into account. The time period of the moving averages is one of the most important considerations. Shorter-term moving averages, such as a 10-day or 20-day average, are more sensitive to recent price changes and are suitable for identifying short-term trends. However, they can be prone to producing more false signals in volatile markets. On the other hand, longer-term moving averages, such as the 50-day or 200-day average, react more slowly to price movements but provide a clearer picture of the long-term trend, reducing the likelihood of false signals.
Another important factor is the type of market or asset being traded. Highly volatile markets may require shorter-term averages to capture more frequent changes in trend, whereas stable markets may benefit from longer-term averages to filter out unnecessary noise. Additionally, your personal trading style—whether you are a day trader, swing trader, or long-term investor—will influence the selection of moving averages. Short-term traders often rely on quicker-moving averages, while long-term investors prefer slower averages to reflect the broader trend.
4.2 Common Combinations of Moving Averages
There are certain combinations of moving averages that are widely used in crossover strategies due to their reliability. One of the most common setups is the combination of the 50-day and 200-day moving averages. This pairing is often used by long-term traders and investors because it provides a balance between filtering out short-term fluctuations while capturing significant trend shifts. The crossover of the 50-day moving average above the 200-day moving average is famously known as the “Golden Cross,” signaling a strong bullish trend, while the opposite scenario, called the “Death Cross,” indicates a bearish trend.
Another popular combination for shorter-term traders is the 5-day and 20-day moving average crossover. This setup is used by those looking to capitalize on quicker shifts in momentum and short-term trends. Although this combination is more responsive to recent price changes, it can also result in more frequent signals, increasing the potential for both profit and risk.
In addition, some traders use exponential moving averages (EMAs) instead of simple moving averages (SMAs) for quicker responsiveness. For instance, pairing a 12-day EMA with a 26-day EMA is a popular setup for spotting short-term trend changes in markets such as forex and commodities.
4.3 Advantages and Disadvantages of Different Combinations
Each combination of moving averages comes with its own set of advantages and disadvantages. Short-term moving average combinations, such as the 5-day and 20-day crossover, are highly responsive to price changes, making them ideal for capturing quick profits in fast-moving markets. However, this sensitivity can also be a disadvantage, as these shorter time frames are more susceptible to false signals during periods of market consolidation or volatility.
Long-term combinations, like the 50-day and 200-day moving averages, offer the advantage of filtering out much of the market noise, giving clearer signals on major trend reversals. However, the downside is that these longer-term averages tend to lag behind the market, meaning that traders may miss the early stages of a trend.
Using exponential moving averages (EMAs) instead of simple moving averages (SMAs) offers the benefit of quicker reactions to price changes, which can be an advantage for traders looking to catch trends earlier. However, the drawback is that EMAs can sometimes react too quickly, producing more false signals than their simple counterparts.
Ultimately, the right combination depends on the trader’s objectives, risk tolerance, and the nature of the asset being traded. Balancing the benefits of responsiveness with the need for accuracy in signaling is key to finding the most effective moving average combination for your strategy.
| Section | Description |
|---|---|
| 4.1 | Factors to consider when selecting moving averages, including time periods, market type, and trading style. |
| 4.2 | Common moving average combinations used in crossover strategies, such as 50-day and 200-day or 5-day and 20-day setups. |
| 4.3 | Advantages and disadvantages of short-term and long-term moving average combinations, as well as the use of EMAs versus SMAs. |
5. Implementing the Strategy
Once you understand how moving averages work and have selected the right combination for your trading needs, the next step is implementing the moving average crossover strategy. This involves following a structured approach that allows you to set up the strategy on your trading platform, manage your trades, and define your risk parameters. In this section, we will go through a step-by-step guide to help you apply this strategy effectively, whether you are using a trading platform or doing manual calculations.
5.1 Step-by-Step Guide to Implementing the Strategy
To successfully implement a moving average crossover strategy, it is important to follow a systematic approach. The first step is to determine the time frames for the moving averages you will use based on your trading objectives. For instance, if you are trading short-term trends, you might use a combination like the 5-day and 20-day moving averages. For long-term trends, the 50-day and 200-day averages may be more appropriate.
After selecting your moving averages, you will need to apply them to a price chart. Most trading platforms provide tools that allow you to add multiple moving averages to a chart and visually track their interactions with the asset’s price. Once you have the moving averages plotted, observe the points where they cross over.
Bullish Crossover
A bullish crossover (when the shorter average crosses above the longer average) will signal a potential buying opportunity.
Bearish Crossover
A bearish crossover (when the shorter average crosses below the longer average) will suggest a possible sell.
Combination With Another Indicator
Next, you will need to confirm the crossover signal using additional indicators, such as the Relative Strength Index (RSI) or Moving Average Convergence Divergence (MACD), to avoid acting on false signals. Once confirmed, you can enter a position based on the direction of the crossover.
Finally, you must set stop-loss and take-profit orders to protect your capital and lock in gains. Stop-loss orders will automatically exit your position if the trade moves against you beyond a certain point, while take-profit orders ensure that you close the trade at a pre-set profit level.
5.2 Using Trading Platforms or Software
Most trading platforms come equipped with built-in tools to implement moving average crossover strategies. Platforms like MetaTrader, TradingView, or Thinkorswim allow you to add moving averages to your charts with just a few clicks. These platforms also offer alerts that can notify you when a crossover occurs, ensuring that you never miss an important trading signal.
Additionally, these platforms allow you to backtest the strategy. You can simulate how the strategy would have performed on historical data, giving you a better sense of its effectiveness before you apply it in live trading. Some platforms also offer optimization tools, allowing you to tweak the parameters of your moving averages and test different settings to find the most profitable combinations.
5.3 Manual Calculations (Optional)
For traders who prefer a hands-on approach, it is possible to manually calculate moving averages and identify crossovers. This method, while more time-consuming, offers a deeper understanding of how the strategy works. To manually calculate a moving average, you first need to gather the closing prices for the selected period. For example, to calculate a 10-day SMA, sum up the closing prices of the last 10 trading days and divide by 10. Repeat this process daily as new prices come in, and plot the moving averages on a chart to observe crossovers.
Manually tracking moving averages and crossovers can help you develop an intuition for market movements, but it is generally less efficient than using software, especially when trading multiple assets or markets.
5.4 Setting Stop-Loss and Take-Profit Orders
Risk management is a critical component of the moving average crossover strategy. Setting stop-loss and take-profit orders ensures that you limit potential losses and secure profits at the right time. A stop-loss order is designed to protect you from significant losses by automatically closing your position if the price moves against your trade by a certain amount. For example, if you enter a long position on a bullish crossover, you might set a stop-loss below the recent support level to minimize downside risk.
On the other hand, a take-profit order helps you lock in gains by closing your position once the price reaches a certain target. This allows you to exit the trade before the market reverses, ensuring that you secure profits without having to constantly monitor the market.
Properly setting these orders requires a balance between the expected reward and acceptable risk. Many traders use a risk-reward ratio, such as 1:2, meaning they are willing to risk one unit of loss for every two units of potential profit. Adjusting your stop-loss and take-profit levels according to this ratio helps maintain disciplined risk management.
| Section | Description |
|---|---|
| 5.1 | Step-by-step guide to setting up and executing the moving average crossover strategy, including choosing time frames and entering trades. |
| 5.2 | Overview of how to use trading platforms and software to apply and automate the strategy. |
| 5.3 | Explanation of manual calculations for traders who prefer to calculate moving averages and track crossovers by hand. |
| 5.4 | Importance of setting stop-loss and take-profit orders to manage risk and lock in profits. |
6. Backtesting and Optimization
Backtesting and optimization are essential steps in the process of implementing a moving average crossover strategy. Backtesting allows traders to assess how a strategy would have performed based on historical data, helping them determine its effectiveness before risking real capital. Optimization, on the other hand, focuses on fine-tuning the strategy to enhance its performance. Together, these processes provide insights into the strengths and weaknesses of a strategy and enable traders to adjust parameters for improved results.
6.1 Importance of Backtesting
Backtesting is crucial because it gives traders the ability to evaluate the performance of their moving average crossover strategy over past market conditions. By applying the strategy to historical price data, traders can see how it would have performed, identifying periods where the strategy generated profitable signals and periods where it struggled. This provides valuable information about the potential success of the strategy under different market conditions.
Backtesting helps traders gain confidence in their strategy and allows them to make data-driven adjustments. It also reveals potential weaknesses, such as how the strategy might perform during periods of high volatility or sideways markets. This information is critical for refining the strategy before committing real capital to live trades.
6.2 Backtesting Tools and Techniques
Many modern trading platforms come equipped with backtesting tools that allow traders to simulate their moving average crossover strategy on historical data. These tools typically enable traders to select a time frame, apply their chosen moving averages, and analyze how crossovers performed during that period.
When backtesting, it is important to consider various market environments—bullish, bearish, and sideways—to understand how the strategy behaves under different conditions. Traders can also test the strategy over multiple assets to see whether it is effective in different markets, such as stocks, forex, or commodities.
Some advanced backtesting techniques involve using a large set of data to simulate hundreds or thousands of trades, generating a detailed analysis of metrics like win rate, average profit per trade, maximum drawdown, and overall return. This data provides a comprehensive view of the strategy’s performance over time.
6.3 Optimizing Moving Average Parameters
Optimization involves fine-tuning the parameters of your moving average crossover strategy to maximize its effectiveness. This process focuses on adjusting the length of the moving averages, the type of moving averages (SMA, EMA, or WMA), and additional factors such as time frames or stop-loss and take-profit levels.
For example, if backtesting reveals that a 50-day and 200-day moving average crossover produces strong signals on certain assets but underperforms on others, optimization might involve adjusting the moving average periods. You might find that using a 40-day and 150-day combination results in better performance in a particular market or time frame.
However, it is essential to avoid over-optimization, also known as “curve fitting,” where the strategy is excessively fine-tuned to past data. Over-optimization can lead to a strategy that performs well in backtesting but fails in live markets because it has been tailored too specifically to past conditions. The goal of optimization is to enhance the strategy while maintaining a balance between flexibility and robustness.
| Section | Description |
|---|---|
| 6.1 | Importance of backtesting for evaluating the moving average crossover strategy using historical data. |
| 6.2 | Overview of backtesting tools and techniques for simulating the strategy in different market conditions. |
| 6.3 | Explanation of optimizing moving average parameters to improve strategy performance while avoiding over-optimization. |
7. Risk Management Considerations
Effective risk management is a critical component of any trading strategy, and the moving average crossover strategy is no exception. Managing risk ensures that traders protect their capital, reduce the impact of losses, and stay disciplined in executing their strategy. In this section, we will explore how traders can manage risk while trading with a moving average crossover strategy, focusing on position sizing, diversification, and maintaining emotional control.
7.1 Managing Risk in Moving Average Crossover Trading
Risk management in the moving average crossover strategy revolves around limiting potential losses while maximizing gains. The first step in managing risk is to define how much capital you are willing to risk on each trade. This is commonly done by setting a percentage of your overall capital that you are prepared to lose on any given trade—usually between 1% and 3%. This approach ensures that even if the trade goes against you, your losses remain manageable and do not significantly affect your overall portfolio.
A key tool for managing risk in crossover trading is the use of stop-loss orders. A stop-loss order is a predetermined price point where your trade will be automatically closed to prevent further losses. Setting a stop-loss order based on recent support or resistance levels ensures that you limit your exposure if the market moves in an unexpected direction.
In addition to setting stop-losses, traders often set take-profit orders to automatically exit a trade when a certain profit level is reached. This helps lock in profits before the market reverses, which is particularly useful when the price may fluctuate after a crossover occurs.
7.2 Position Sizing
Position sizing is another crucial aspect of risk management. Determining the size of each position relative to your account balance ensures that you do not overexpose yourself to any single trade. Position sizing is typically calculated based on the percentage of capital you are willing to risk and the distance between your entry price and your stop-loss level.
For example, if you are willing to risk 2% of your total capital on a trade and the difference between your entry price and stop-loss is $5 per share, you can calculate the number of shares to trade by dividing the amount you’re willing to risk by the price difference. This approach ensures that each trade carries the same level of risk, regardless of the asset’s price volatility.
By maintaining consistent position sizes, traders protect themselves from overleveraging on any single trade, which could lead to significant losses. This consistency helps preserve capital over the long term, even if some trades do not perform as expected.
7.3 Diversification
Diversification is another strategy to reduce risk while trading with moving averages. Instead of focusing all your efforts on a single asset or market, diversification involves spreading your trades across different asset classes, industries, or markets. This reduces the overall risk of your portfolio, as the performance of one asset may not correlate with another. For instance, if you are using the moving average crossover strategy to trade stocks, consider diversifying into other markets, such as forex or commodities, to hedge against potential losses in one sector.
Diversification can also be applied within a specific market by trading different assets that may not move in tandem. For example, in the stock market, some sectors may rise while others decline. A well-diversified portfolio minimizes the impact of individual asset fluctuations on the overall performance of your trades.
7.4 Emotional Control
One of the most overlooked aspects of risk management is maintaining emotional control. Even with a solid strategy like the moving average crossover, emotions such as fear and greed can lead to poor decision-making. Traders who lack emotional control may abandon their strategy during temporary setbacks or chase profits after a winning streak, leading to increased risk and potential losses.
To manage emotions effectively, it is crucial to stick to your predefined strategy, including stop-losses and take-profit levels, regardless of market conditions. Having a clear plan in place helps remove emotions from trading decisions and keeps you disciplined.
Additionally, traders should be prepared for both winning and losing streaks. Losing trades are an inevitable part of any trading strategy, but proper risk management ensures that losses are contained. Maintaining emotional discipline allows you to stay focused on long-term success rather than reacting to short-term fluctuations.
| Section | Description |
|---|---|
| 7.1 | Importance of managing risk with stop-loss and take-profit orders to protect capital and lock in gains. |
| 7.2 | Role of position sizing in managing risk by ensuring consistent trade sizes relative to account balance. |
| 7.3 | How diversification helps spread risk across different markets or assets, reducing overall exposure. |
| 7.4 | Importance of emotional control in adhering to the strategy and avoiding impulsive decisions. |
8. Real-World Examples
Examining real-world examples of moving average crossover trades can provide valuable insights into how the strategy works in practice. By analyzing both successful and unsuccessful trades, traders can gain a deeper understanding of how different market conditions affect the performance of the strategy. In this section, we will look at case studies of moving average crossover trades, discuss the importance of analyzing historical data, and highlight key lessons learned from both successes and failures.
8.1 Case Studies of Successful Moving Average Crossover Trades
A classic example of a successful moving average crossover trade can be found in stock markets during periods of strong trends. For instance, the “Golden Cross” (when the 50-day moving average crosses above the 200-day moving average) is often cited as a bullish signal in equity markets. One notable example occurred in early 2020 when the 50-day moving average of the S&P 500 crossed above the 200-day moving average after the initial recovery from the COVID-19 market crash. This crossover indicated the start of a strong upward trend, leading to significant gains for traders who entered long positions based on the signal.
In forex markets, shorter-term moving averages are often used for more frequent crossovers. A trader using the 10-day and 50-day moving averages on a currency pair might have benefited from a bullish crossover during the dollar’s rise against the euro in 2021. By entering the trade shortly after the crossover, traders could have captured the price momentum in favor of the U.S. dollar, capitalizing on the medium-term trend.
These examples show how the moving average crossover strategy can be applied across different markets and time frames to generate profits during trending conditions.
8.2 Analyzing Historical Data
Analyzing historical data is a key practice for understanding how the moving average crossover strategy works over time. By studying how crossovers have performed in various markets under different conditions, traders can identify patterns and determine when the strategy is most effective.
For instance, during a bull market, the strategy often generates more reliable buy signals, as the price tends to rise steadily above key moving averages. In contrast, during periods of market consolidation or low volatility, moving averages may produce more frequent and unreliable signals, leading to false crossovers. Understanding these historical trends helps traders fine-tune their approach by recognizing which market environments are best suited for the moving average crossover strategy.
Analyzing historical data also helps traders understand the lagging nature of moving averages. While crossovers can indicate the beginning of a trend, they tend to occur after the price has already started moving in a particular direction. This means that traders might miss the earliest part of a trend, but the signals still provide an opportunity to capture the majority of the price movement.
8.3 Learning from Both Successes and Failures
While it’s essential to study successful trades, understanding failed crossover trades is equally important. One common pitfall of the moving average crossover strategy is the occurrence of false signals, where a crossover occurs but the trend does not materialize. This is particularly common in choppy or sideways markets, where price fluctuations cause moving averages to cross multiple times without a clear trend direction.
For example, in early 2018, a bearish crossover occurred in the cryptocurrency market when Bitcoin’s 50-day moving average crossed below its 200-day moving average. While this “Death Cross” suggested a prolonged downtrend, the price of Bitcoin soon rebounded, leading to a false signal and potential losses for traders who had acted on the crossover alone. This example highlights the importance of combining moving average crossovers with other indicators, such as volume or momentum, to confirm signals before entering a trade.
Learning from both successes and failures helps traders improve their risk management techniques and refine their strategies to avoid potential pitfalls in the future.
| Section | Description |
|---|---|
| 8.1 | Real-world examples of successful moving average crossover trades in both stock and forex markets. |
| 8.2 | Importance of analyzing historical data to understand how crossovers perform under different market conditions. |
| 8.3 | Lessons learned from both successful and failed crossover trades, emphasizing the need for confirmation of signals. |
Conclusion
The moving average crossover strategy is a powerful tool in the arsenal of any trader, providing a systematic approach to identifying potential trends and executing trades with confidence. By using the relationship between short-term and long-term moving averages, this strategy helps traders spot bullish or bearish crossovers that signal possible market shifts. However, like all trading strategies, its success depends on careful implementation, risk management, and the ability to adapt to different market conditions.
Understanding the foundational concepts of moving averages—how they are calculated and their various types—sets the stage for applying the crossover strategy effectively. Selecting the appropriate combination of moving averages, such as the popular 50-day and 200-day pairing, is critical for filtering out noise and identifying meaningful trend changes. Furthermore, a step-by-step approach to implementing the strategy ensures that traders make informed decisions, using backtesting to refine their approach and risk management techniques like position sizing, stop-loss orders, and take-profit levels to protect their capital.
Real-world examples illustrate how this strategy has worked across different markets, while lessons learned from both successes and failures highlight the need for confirming signals with additional indicators. Traders who maintain discipline and emotional control, while continuously evaluating their strategy through optimization, are better positioned to capitalize on the opportunities that moving average crossovers present.
In summary, the moving average crossover strategy is not a standalone solution but a versatile tool that can be enhanced with sound risk management and supplemented by other technical analysis techniques. When used correctly, it can help traders make more informed decisions, reduce emotional bias, and increase the likelihood of consistent trading success.