1. Overview of the MA Cross Indicator
The Moving Average Cross (MA Cross) indicator is a fundamental tool in financial technical analysis, widely used for trend identification and decision-making in trading. This indicator involves the utilization of two moving averages – a combination of a shorter period moving average and a longer period moving average. The basic premise of the MA Cross is to signal potential changes in the market trend based on the crossing of these two moving averages.
1.1. Concept and Functionality
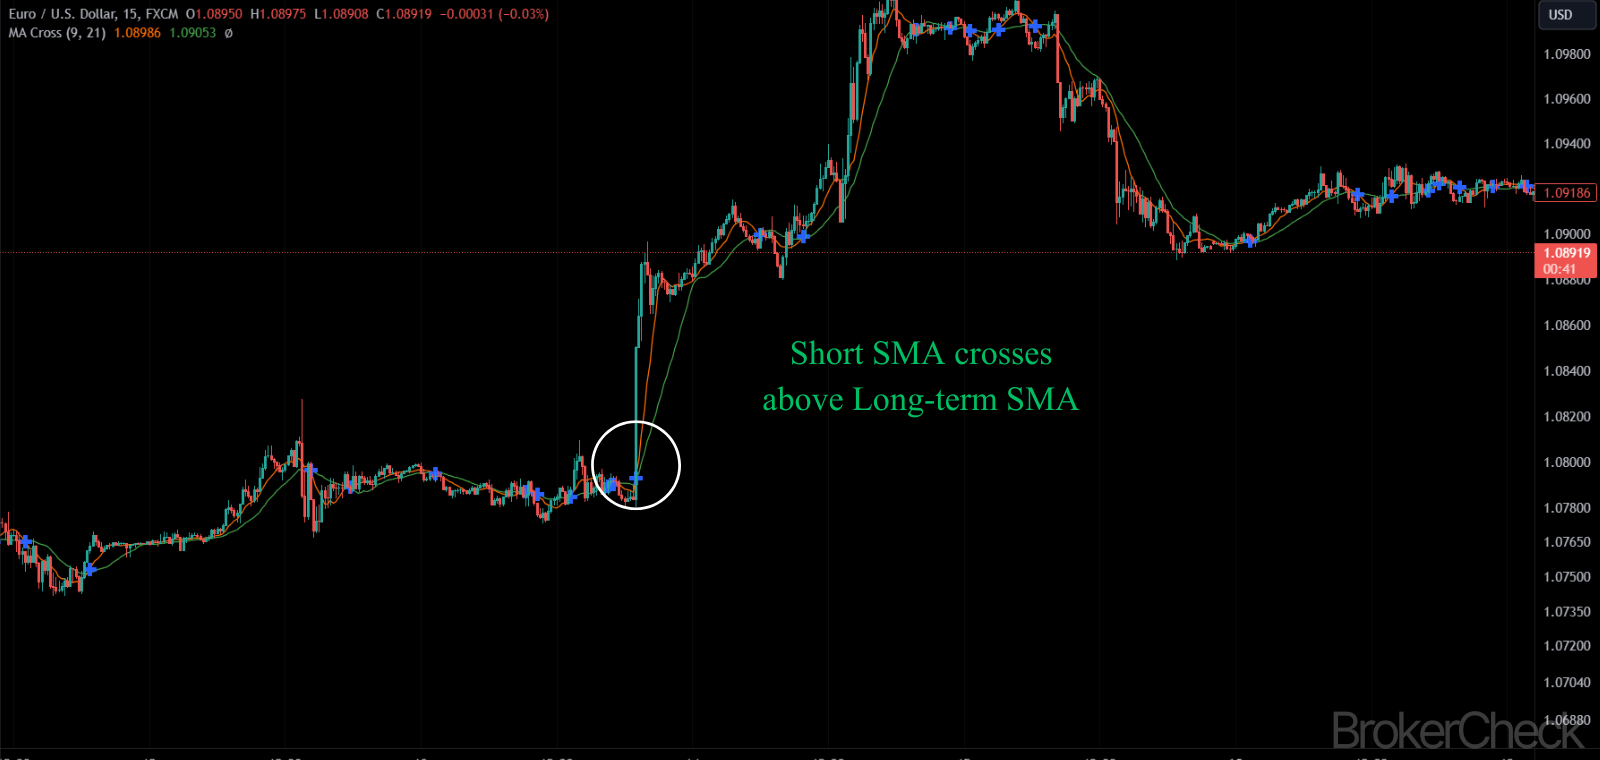
The MA Cross operates on a simple concept: when the short-term moving average crosses above the long-term moving average, it suggests an upward trend, signaling a potential buying opportunity. Conversely, when the short-term moving average crosses below the long-term moving average, it indicates a downward trend, suggesting a selling point. This technique is popular because it visually represents the shifts in market momentum and helps traders identify potential entry and exit points.

1.2. Types of Moving Averages Used
Traders can choose different types of moving averages for the MA Cross, such as Simple Moving Average (SMA), Exponential Moving Average (EMA), or Weighted Moving Average (WMA). Each type has its characteristics, with EMA being more sensitive to recent price changes and SMA providing a more generalized view of the market trend.
1.3. Advantages and Limitations
The MA Cross is favored for its simplicity and effectiveness, especially suitable for new traders. It is easily interpretable and can be combined with other indicators for enhanced analysis. However, it’s important to note its limitations, such as the potential for false signals in sideways or choppy markets and its lagging nature, as it is based on past data.
1.4. Best Practices and Common Mistakes
Best practices in using the MA Cross include applying it in trending markets for better reliability and combining it with other analysis tools for confirmation. Common mistakes include relying solely on MA Cross signals without considering market context or other indicators, leading to misinterpretation of market trends.
| Aspect | Detail |
|---|---|
| Indicator Type | Trend-following |
| Components | Short-term and Long-term Moving Averages |
| Popular MA Types | SMA, EMA, WMA |
| Key Signal | Crossing of two MAs (Bullish or Bearish) |
| Advantages | Simple, User-friendly, Effective in Trending Markets |
| Limitations | Lagging Nature, Prone to False Signals in Non-trending Markets |
| Suggested Use | Combination with Other Indicators, Apply in Trending Markets |
2. Calculation Process of the MA Cross Indicator
Understanding the calculation process of the MA Cross Indicator is crucial for traders who wish to customize it according to their trading strategy. This section breaks down the calculation steps for the two types of moving averages typically used in this indicator – the Simple Moving Average (SMA) and the Exponential Moving Average (EMA).
2.1. Calculating the Simple Moving Average (SMA)
The SMA is calculated by taking the arithmetic mean of a set number of past prices. For instance, a 10-day SMA is the sum of the last 10 closing prices divided by 10. The formula is:
SMA = (P1 + P2 + ... + Pn) / n
where P1, P2,…, Pn are the closing prices for the 1st to nth day, and n is the number of periods.
2.2. Calculating the Exponential Moving Average (EMA)
The EMA gives more weight to recent prices and is calculated using the following formula:
EMA = (Current Price × (2 / (1 + n))) + (Previous EMA × (1 - (2 / (1 + n))))
where n is the number of periods. EMA reacts more quickly to price changes, making it more sensitive to recent information.
2.3. Determining the Cross
The ‘cross’ occurs when the short-term moving average intersects with the long-term moving average. A bullish cross is identified when the short-term MA crosses above the long-term MA, and a bearish cross is marked when the short-term MA crosses below the long-term MA.
2.4. Setting the Right Parameters
Choosing the right periods for the short-term and long-term MAs is crucial. Common combinations include 50 and 200 days (long-term trend analysis), or 15 and 50 days (short-term trend analysis). The choice of periods should align with the trader’s strategy and market conditions.
| Aspect | Detail |
|---|---|
| Calculation of SMA | Average of a set number of past prices |
| Calculation of EMA | Weighted mean, giving more importance to recent prices |
| Bullish Cross | Short-term MA crosses above Long-term MA |
| Bearish Cross | Short-term MA crosses below Long-term MA |
| Parameter Setting | Depends on trading strategy and market analysis |
3. Optimal Values for MA Cross Setup in Different Timeframes
Selecting the optimal values for the MA Cross setup is crucial for maximizing its effectiveness in different market conditions and timeframes. This section provides insights into the best parameter values for short-term, medium-term, and long-term trading strategies.
3.1. Short-Term Trading
For short-term trading, such as day trading or scalping, traders typically use lower period moving averages to capture quick changes in the market. Common combinations are:
- 5 and 20 periods: Ideal for very short-term movements.
- 10 and 50 periods: Provides a balance between responsiveness and smoothing out market noise.
Shorter periods can lead to more frequent signals, which may be beneficial for quick trades but can also increase the risk of false signals.
3.2. Medium-Term Trading
For swing traders or those who hold positions for several days to weeks, medium-term settings provide a balance between market noise and lag. Popular combinations include:
- 20 and 50 periods: Suitable for capturing medium-term trends.
- 50 and 100 periods: Offers a broader view of the trend direction.
These settings help to filter out short-term fluctuations and focus on more established trends.
3.3. Long-Term Trading
Long-term traders, such as position traders, require settings that filter out short-term noise and focus on the bigger picture. Commonly used combinations are:
- 50 and 200 periods: Known as the “Golden Cross” and “Death Cross” signals, widely watched by traders.
- 100 and 200 periods: Offers a more conservative approach, reducing the number of signals but potentially increasing their reliability.
These settings are less sensitive to short-term price movements, providing a clear view of long-term trends.
3.4. Adjusting Parameters Based on Market Conditions
It’s important to remember that there is no one-size-fits-all setup. Traders should adjust these parameters based on current market volatility, liquidity, and their individual trading style.

| Timeframe | Optimal Short-Term MA | Optimal Long-Term MA | Use Case |
|---|---|---|---|
| Short-Term | 5-10 periods | 20-50 periods | Day Trading, Scalping |
| Medium-Term | 20-50 periods | 50-100 periods | Swing Trading |
| Long-Term | 50-100 periods | 200 periods | Position Trading |
4. Interpretation of the MA Cross Indicator
Interpreting the MA Cross indicator is essential for traders to make informed decisions. This section elaborates on how to read the signals from the MA Cross and what they imply for market trends and potential trading actions.
4.1. Understanding Bullish and Bearish Crosses
A bullish cross occurs when the short-term moving average crosses above the long-term moving average, suggesting a potential upward trend and a buying opportunity. Conversely, a bearish cross, where the short-term moving average crosses below the long-term moving average, indicates a potential downward trend and a selling opportunity. These crosses are the primary signals traders look for when using the MA Cross indicator.
4.2. Strength of the Signal
The strength of a bullish or bearish cross can be gauged by several factors, such as the distance between the moving averages and the angle of the cross. A wider gap and a steeper angle often indicate a stronger trend. Additionally, the volume of trading can also affirm the strength of the trend.
4.3. False Signals and Market Noise
One of the limitations of the MA Cross is its susceptibility to false signals, especially in a sideways or choppy market. These false signals can lead to premature entries or exits. It’s crucial for traders to recognize market conditions and use additional indicators for confirmation.
4.4. Combining with Other Indicators
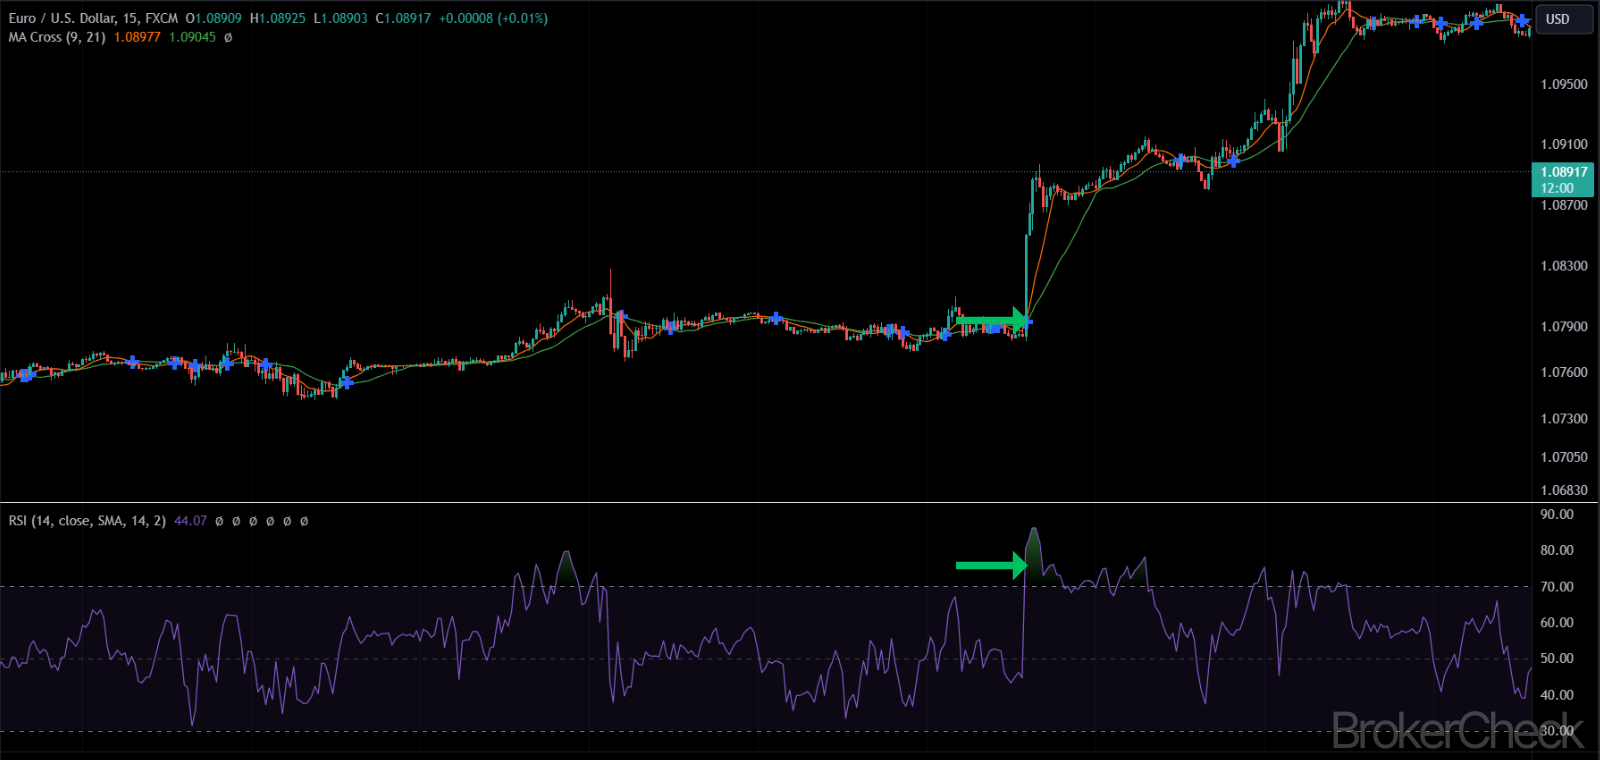
To enhance the reliability of the MA Cross signals, traders often combine it with other indicators like the Relative Strength Index (RSI), MACD, or support and resistance levels. This combination can provide a more comprehensive view of the market and help validate the signals.
| Signal Type | Meaning | Strength Indicators | Additional Considerations |
|---|---|---|---|
| Bullish Cross | Short-term MA crosses above Long-term MA | Gap width, Angle steepness, Trading volume | Confirm with other indicators |
| Bearish Cross | Short-term MA crosses below Long-term MA | Gap width, Angle steepness, Trading volume | Confirm with other indicators |
| False Signals | Potential incorrect trend indication | Market conditions, Volume analysis | Avoid in sideways/choppy markets |
5. Combination of MA Cross with Other Indicators
While the MA Cross indicator is powerful on its own, combining it with other technical indicators can significantly enhance its effectiveness. This integration helps in confirming signals, reducing false positives, and providing a more comprehensive market analysis.
5.1. MA Cross and Relative Strength Index (RSI)
Combining the MA Cross with the RSI, which measures the speed and change of price movements, can help in validating trend strength. For instance, a bullish MA Cross along with an RSI above 50 can confirm an uptrend, while a bearish MA Cross with an RSI below 50 can validate a downtrend.
5.2. MA Cross and Moving Average Convergence Divergence (MACD)
The MACD is another popular indicator that can complement the MA Cross. It consists of two moving averages (a slow and a fast one) and a histogram. When both MACD and MA Cross indicate a trend in the same direction, it strengthens the signal’s reliability.
5.3. MA Cross and Bollinger Bands
Bollinger Bands, which consist of a set of three lines plotted in relation to securities prices, can be used alongside the MA Cross to assess market volatility. A bullish or bearish MA Cross in conjunction with the price touching the upper or lower Bollinger Band can indicate strong buy or sell signals respectively.
5.4. MA Cross and Volume Indicators
Incorporating volume indicators with the MA Cross can also provide insights into the strength of a trend. An increase in volume accompanying an MA Cross can affirm the trend’s strength, while low volume may suggest a lack of conviction and a potential for reversal.
| Indicator Combination | Function | Usage |
|---|---|---|
| MA Cross + RSI | Trend Strength Confirmation | Confirming uptrends or downtrends |
| MA Cross + MACD | Trend Confirmation | Strengthening signal reliability |
| MA Cross + Bollinger Bands | Volatility and Trend Analysis | Identifying strong buy/sell opportunities |
| MA Cross + Volume Indicators | Trend Strength Assessment | Affirming trend strength or weakness |
6. Risk Management with the MA Cross Indicator
Effective risk management is crucial when trading with the MA Cross indicator. This section outlines strategies to mitigate risks and protect investments while utilizing this technical tool.
6.1. Setting Stop-Loss and Take-Profit Levels
One of the primary risk management techniques is setting stop-loss and take-profit orders. A stop-loss order can be placed below the most recent low for a long position or above the most recent high for a short position. Similarly, take-profit levels should align with key resistance (for long positions) or support levels (for short positions).
6.2. Position Sizing
Position sizing is critical in managing risk. Traders should only risk a small percentage of their trading capital on a single trade to avoid significant losses. A common approach is to risk no more than 1-2% of the total trading capital on a single trade.
6.3. Avoiding Overreliance on the Indicator
While the MA Cross is a valuable tool, overreliance on it can lead to misjudgments, especially during market anomalies or atypical volatility. Traders should use it in conjunction with other indicators and market analysis techniques.
6.4. Being Cognizant of Market Conditions
Market conditions play a significant role in the effectiveness of the MA Cross. In highly volatile or sideways markets, the MA Cross may produce more false signals. Understanding current market dynamics can help traders make more informed decisions.
| Risk Management Strategy | Detail |
|---|---|
| Stop-Loss and Take-Profit Levels | Protect capital and lock in profits |
| Position Sizing | Limit exposure by risking a small percentage of capital per trade |
| Avoid Overreliance | Combine MA Cross with other analysis tools |
| Market Conditions Awareness | Adapt strategy based on current market dynamics |