1. What is Moving Average Ribbon?
A Moving Average Ribbon is a technical analysis tool composed of multiple moving averages of different lengths plotted on the same chart. This visualization technique displays a series of lines that create a ribbon-like appearance, which traders use to identify both trend direction and strength.
The ribbon consists of moving averages typically calculated over short, medium, and long-term periods. These can range from very short-term averages like 5 days to longer-term averages such as 200 days. When the shorter-term moving averages are above the longer-term averages, it suggests an uptrend. Conversely, when shorter-term averages are below, it indicates a downtrend.
Traders observe the separation or convergence of the lines within the ribbon. A wider ribbon implies a stronger trend, while a narrow ribbon or one that begins to intertwine suggests a weakening trend or a potential trend reversal. The Moving Average Ribbon can be customized by selecting different time periods and types of moving averages, such as simple, exponential, or weighted, to suit various trading strategies.
The Moving Average Ribbon is not just a trend-following indicator; it can also provide dynamic support and resistance levels. Traders might look for price interactions with the ribbon lines to make informed decisions on entry and exit points, as well as to set stop-loss orders.
2. How to Set Up the Moving Average Ribbon Strategy?
Selecting the Right Moving Average
Setting up the Moving Average Ribbon strategy begins with choosing the appropriate moving averages to include in the ribbon. The selection should cover a range of time frames that reflect the trader’s specific trading style and the time horizon of their trades. A common approach is to use a sequence of moving averages in incremental time periods, such as 5, 10, 20, 30, 40, 50, and 60 periods. Exponential moving averages (EMAs) are often preferred over simple moving averages (SMAs) as they give more weight to recent price action and can react more quickly to price changes.
Configuring the Chart
Once the moving averages are selected, the next step is to apply these to the price chart. Most trading platforms can add multiple moving averages and customize their parameters. Ensure that each moving average is set to the correct type (simple, exponential, or weighted) and period. It’s also useful to assign different colors to each moving average for clarity.
Ribbon Interpretation
After the moving averages are applied, the ribbon will form. Traders should monitor the orientation and order of the moving averages. For a bullish signal, the shortest moving average should be at the top of the ribbon, with the longest at the bottom, and the lines should be parallel or fanning out. For a bearish signal, the longest moving average should be at the top with the shortest at the bottom, again with the lines parallel or fanning inward.
Entry and Exit Points
Entry points are identified when the price moves above or below the ribbon, or when the moving averages align in a way that suggests the beginning of a trend. Exit points or stop-loss orders can be set around the ribbon levels, particularly if the price begins to breach the moving averages in the opposite direction of the existing trend.
| Condition | Action |
|---|---|
| Price moves above the ribbon | Consider a long position |
| Price moves below the ribbon | Consider a short position |
| Moving averages fan out | Trend strength increasing |
| Moving averages intertwine | Potential trend reversal |
Following these guidelines, traders can effectively set up and utilize the Moving Average Ribbon strategy. As with all trading strategies, combining the Moving Average Ribbon with other indicators and analysis methods is important to validate signals and manage risk.
2.1. Selecting the Right Moving Averages
Tailoring to Market Conditions
The efficacy of a Moving Average Ribbon is highly contingent on selecting averages that resonate with current market conditions. A volatile market characterized by rapid price fluctuations, may necessitate shorter moving averages to capture the essence of the trend. Conversely, longer moving averages could provide a clearer picture in a market exhibiting less volatility and more discernible trends, filtering out noise and short-term fluctuations.
Adapting to Trading Style
The trader’s individual style significantly influences the choice of moving averages. Day traders might lean towards a ribbon comprised of very short-term moving averages, such as 5, 10, and 15 periods, to detect quick trend changes. Swing traders, looking to capture trends over several days or weeks, may opt for a blend that includes averages from 30 to 60 periods. Position traders, with a long-term outlook, could find value in incorporating moving averages from 100 to 200 periods to affirm the persistence of a trend over time.
Consideration of Price Sensitivity
The sensitivity of moving averages to price movements is another critical factor. EMAs are more sensitive due to their focus on recent prices, making them suitable for traders who require prompt trend indications. However, this sensitivity can also lead to false signals in choppy markets. Conversely, SMAs provide a more smoothed data set, which could be advantageous for traders seeking to avoid false breakouts.
Synergy with Market Instruments
Different financial instruments may also respond better to specific time periods. A currency pair with high liquidity, like EUR/USD, might track well with shorter moving averages. At the same time, a commodity with seasonal trends, such as crude oil, might align better with longer periods. Traders should backtest their chosen averages against historical data for their particular market to refine their selection.
By meticulously selecting moving averages that align with market dynamics, trading style, price sensitivity, and the behavior of the chosen financial instrument, traders can enhance the effectiveness of their Moving Average Ribbon strategy. It’s important to remember that no single combination of moving averages will be universally optimal; continuous evaluation and adjustment are paramount to maintaining the relevance of this technical analysis tool.
2.2. Customizing Moving Averages on TradingView
Customizing Moving Averages on TradingView
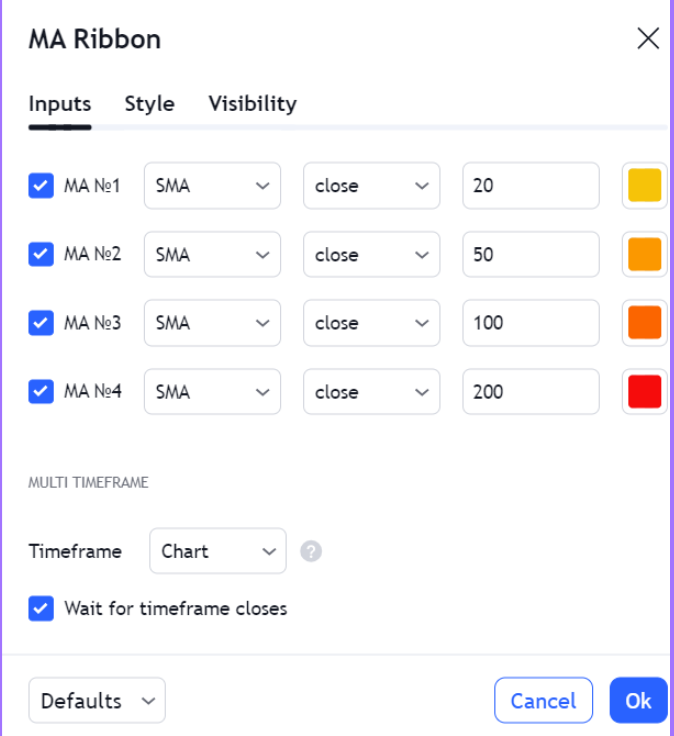
TradingView offers a robust platform for traders seeking to employ the Moving Average Ribbon strategy with a user-friendly interface for customizing moving averages. To begin, access the Indicators menu and select Moving Average multiple times to add various lengths. Each instance can be tailored individually by clicking the settings cog next to the indicator’s name on the chart.
In the Inputs tab, specify the period for each moving average, ensuring the sequence reflects the trader’s time frame preferences. The Style tab allows for the customization of each moving average’s color and thickness, facilitating a clear distinction between the different periods. For a more responsive ribbon, traders may choose EMAs within the MA Method dropdown menu.
For advanced customization, traders can leverage the platform’s Pine Script editor to create a bespoke Moving Average Ribbon indicator. This scripting language enables the definition of specific parameters and conditions, like automatic shading between moving averages to visualize the trend’s strength visually.
| Feature | Customization Option |
|---|---|
| Indicator Selection | Add multiple moving averages |
| Period Settings | Define the length for each MA |
| Style Customization | Adjust color and line thickness |
| MA Method | Choose between SMA, EMA, WMA, etc. |
| Pine Script | Write custom scripts for unique requirements |
By utilizing these features, traders can configure their Moving Average Ribbon to match their trading approach with precision. It’s essential to periodically review and adjust these settings to adapt to changing market conditions and maintain the effectiveness of the strategy.
2.3. Adjusting Settings on MetaTrader
Adjusting Settings on MetaTrader
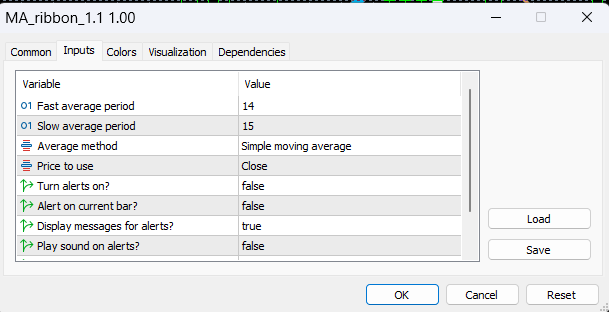
MetaTrader, a widely used platform among traders, accommodates the configuration of the Moving Average Ribbon with relative ease. To adjust settings, open the Navigator window and drag the Moving Average indicator onto the chart for each desired period. Subsequent right-clicking on each MA line and selecting Properties opens the customization window.
Within this window, traders can modify the Period, Shift, MA Method, and Apply to parameters. The MA Method offers options such as Simple, Exponential, Smoothed, and Linear Weighted. Each method’s responsiveness to price action varies, with Exponential being preferred for a more dynamic approach. The Apply to setting determines which price data—close, open, high, low, median, typical, or weighted close—is factored into the MA calculation.
Visual differentiation is facilitated by the Colors tab, where unique hues can be assigned to each moving average line. Moreover, the Levels tab enables the addition of horizontal lines at specified prices, which may serve as markers for support or resistance.
For those seeking a more streamlined process, custom indicators are available for download or can be coded in the MQL4 language. These indicators can instantiate the entire ribbon with pre-set parameters, reducing setup time and potential for error.
| Parameter | Options | Purpose |
|---|---|---|
| Period | Customizable | Sets the number of bars for MA calculation |
| Shift | Customizable | Adjusts the MA offset relative to the current bar |
| MA Method | SMA, EMA, SMMA, LWMA | Determines the type of moving average |
| Apply to | Various price data | Selects the price point for MA calculation |
| Colors | Customizable | Allows for visual distinction between MA lines |
By fine-tuning these settings, MetaTrader users can tailor the Moving Average Ribbon to align with their trading preferences, market conditions, and the characteristics of the instruments they are analyzing. As market conditions evolve, periodic reassessment and adjustment of these parameters are crucial to sustain the strategy’s effectiveness.
3. How to Use the Moving Average Ribbon for Entry Strategy?
Identifying Trend Confirmations
Traders employ the Moving Average Ribbon to pinpoint entry points by identifying trend confirmations. An ascending ribbon, where shorter-term moving averages are positioned above longer-term ones, signals bullish momentum. Conversely, a descending ribbon suggests bearish conditions. Entry is considered when the price action confirms the direction indicated by the ribbon’s orientation.
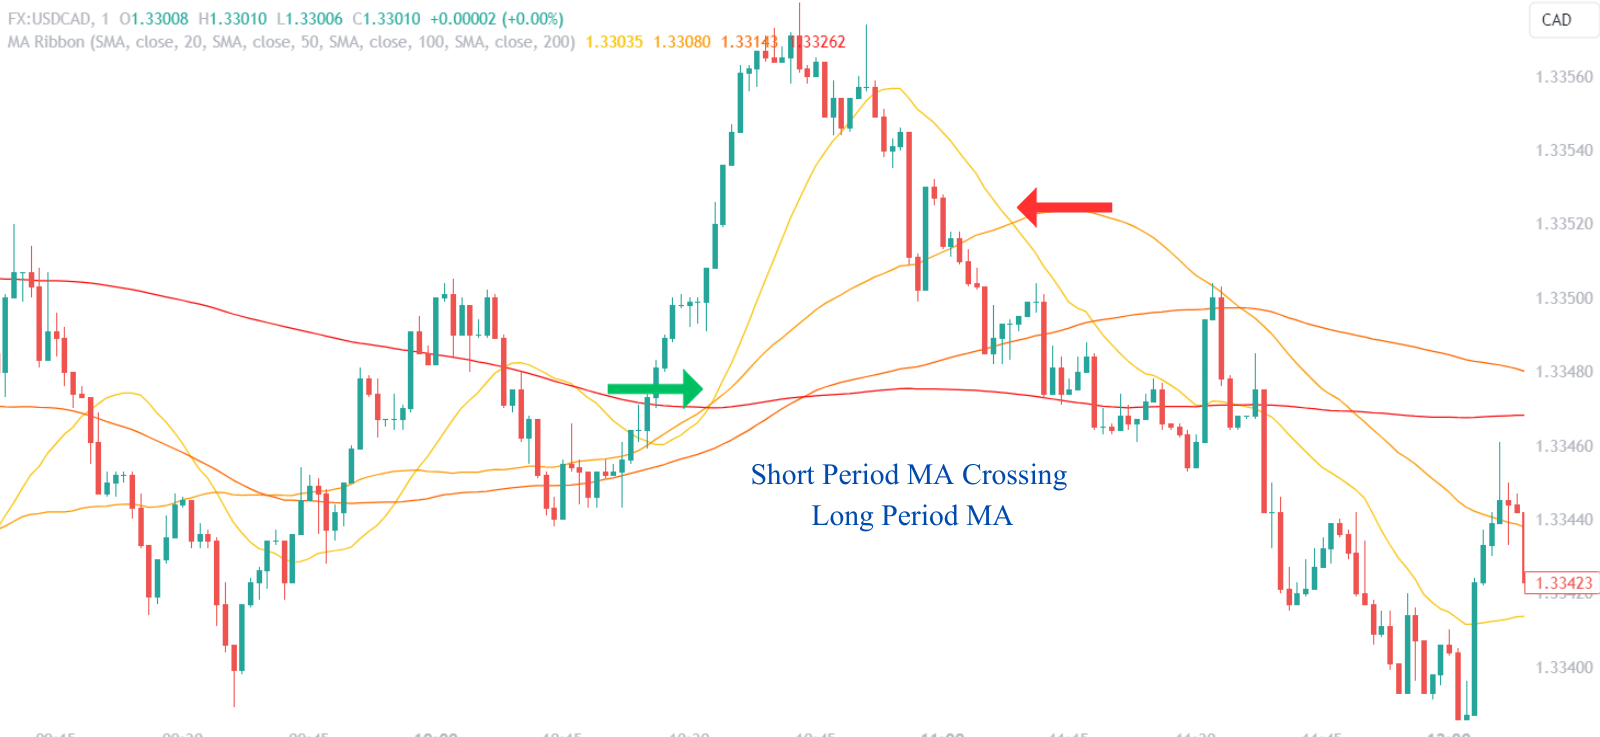
For instance, a trader might enter a long position when the price action closes above the ribbon, particularly if the short-term moving averages have recently crossed above the longer-term averages. This crossover can be perceived as a confirmation of upward momentum. A tight stop-loss is often placed just below the ribbon or the most recent moving average line within the ribbon that acted as support.
Exploiting Ribbon Expansions
Ribbon expansions, where the distance between moving averages widens, indicate increasing trend strength. Traders watch for these expansions as a sign to enter trades in the direction of the trend. An expansion following a period of consolidation or ribbon intertwining can offer a particularly strong entry signal, as it suggests a breakout from indecision to a new trend.
| Ribbon Condition | Implication | Potential Action |
|---|---|---|
| Ascending Ribbon | Bullish Trend Confirmation | Initiate Long Position |
| Descending Ribbon | Bearish Trend Confirmation | Initiate Short Position |
| Ribbon Expansion | Increasing Trend Strength | Enter in Trend Direction |
Leveraging Price Pullbacks
Price pullbacks to the ribbon can serve as strategic entry points, especially when the pullback occurs on low volume, suggesting a lack of conviction in the price retracement. Traders might seek to enter a position when the price touches or slightly penetrates the ribbon but finds support, indicating the primary trend is still intact.
Monitoring Moving Average Crossovers
Moving average crossovers within the ribbon offer additional entry cues. A short-term moving average crossing above a longer-term average within the ribbon can be a bullish entry trigger, particularly if it occurs after a period of price consolidation. Conversely, a short-term average crossing below signals a potential short entry. These crossovers are more significant when accompanied by increased trading volume, enhancing the reliability of the signal.
Reacting to Momentum Shifts
Finally, traders should be responsive to momentum shifts indicated by the speed and nature of the moving averages’ alignment changes. A rapid alignment of shorter moving averages to the top of the ribbon can precede strong price movements, warranting timely entries. Conversely, a slowdown in the alignment shift or a reversal in order may necessitate caution or a reassessment of the entry strategy.
In practice, the Moving Average Ribbon should be used in conjunction with other indicators and analysis methods to filter signals and reduce the likelihood of false entries. Market context and volatility should be considered, as they can significantly impact the effectiveness of the ribbon as an entry tool.
3.1. Identifying Trend Direction
Assessing Ribbon Orientation
The orientation of the Moving Average Ribbon is instrumental in determining the prevailing trend direction. A ribbon where short-term moving averages are positioned above longer-term ones is indicative of upward price momentum. This arrangement suggests that recent price action has been stronger than past performance, typically leading to a bullish outlook.
Conversely, when longer-term moving averages rise to the top of the ribbon, it reflects a dominance of bearish sentiment. Here, the price has been falling, or at least underperforming compared to its historical average, hinting at a possible downtrend.
Evaluating Ribbon Behavior
The behavior of the ribbon over time provides vital clues about the trend’s sustainability. A consistent, upward-sloping ribbon that maintains ordered layers of moving averages signifies a stable uptrend. On the other hand, a downward-sloping ribbon that keeps its structure intact suggests a persistent downtrend.
Analyzing Ribbon Convergence and Divergence
Convergence of the moving averages within the ribbon, where the lines come closer together, often precedes a weakening trend or a potential change in direction. In contrast, divergence or separation of the moving averages signals trend strength. The degree of divergence can offer insights into the trend’s momentum, with a wider gap underscoring a more robust trend.
| Ribbon Feature | Indication |
|---|---|
| Ordered, upward-sloping | Stable uptrend |
| Ordered, downward-sloping | Persistent downtrend |
| Convergence of MAs | Weakening trend or reversal |
| Divergence of MAs | Strong trend with momentum |
Ribbon as a Trend Filter
The ribbon acts as a filter, helping to distinguish between genuine trends and market noise. Traders might disregard short-term price fluctuations that do not disrupt the ribbon’s overall orientation, focusing instead on sustained movements that alter the ribbon structure. This approach aids in reducing the impact of volatility and minor retracements on trend analysis.
3.2. Spotting Entry Points
Assessing Moving Average Positioning
A critical aspect of spotting entry points using the Moving Average Ribbon is to observe the positioning of the moving averages relative to each other and the price action. Crossovers are particularly noteworthy; a short-term moving average crossing above a long-term one may signal an opportune moment to enter a long position, while the inverse scenario could suggest a short entry. The significance of these crossovers is amplified when they occur with substantial volume, providing a more robust entry signal.
Recognizing Price Interactions with the Ribbon
Traders should pay close attention to how prices interact with the Moving Average Ribbon. A price that consistently remains on one side of the ribbon underscores the direction of the trend. An entry point is often identified when the price, after a pullback, touches or slightly breaches the ribbon yet does not close on the opposite side, indicating that the prevailing trend is likely to continue.
Utilizing Ribbon Width for Entry Timing
The width of the Moving Average Ribbon can be a powerful indicator for timing entry points. Narrow ribbons suggest consolidation and the potential for a breakout, while expanding ribbons reflect increased trend momentum. Traders might use an expansion as a cue to enter a trade in the direction of the widening, expecting the trend to pick up pace.
Implementing Volume as a Confirmatory Tool
Volume acts as a confirmatory tool when spotting entry points. An increase in volume accompanying a price move through the ribbon or a crossover within the ribbon adds credence to the signal. Conversely, a price move with low volume may lack the conviction and thus require more scrutiny before committing to an entry.
Monitoring for False Signals
Vigilance against false signals is essential. Not every interaction with the Moving Average Ribbon warrants an entry, especially in choppy markets where price can frequently cross the ribbon without a sustained trend. Additional indicators, such as the Relative Strength Index (RSI) or Moving Average Convergence Divergence (MACD), can be used in tandem to filter out less reliable signals.
| Signal Type | Condition | Volume Confirmation | Action |
|---|---|---|---|
| Crossover Entry | Short MA crosses above long MA | High volume | Consider a long position |
| Crossover Entry | Short MA crosses below long MA | High volume | Consider a short position |
| Price Interaction | Price touches/re-enters ribbon | Low volume | Exercise caution |
| Trend Confirmation | Price stays on one side of ribbon | Consistent volume | Confirm trend direction |
| Ribbon Expansion | MAs fan out indicating momentum | Increasing volume | Time entry with trend |
By systematically assessing these factors, traders can spot entry points with higher confidence, aligning their trades with the prevailing market momentum and reducing exposure to false breakouts or weak trends.
3.3. Confirming Entry with Additional Indicators
Utilizing the RSI for Trend Validation
The Relative Strength Index (RSI) is a momentum oscillator that can validate entry points signaled by the Moving Average Ribbon. By comparing the magnitude of recent gains to recent losses, RSI helps identify overbought or oversold conditions. An RSI reading above 70 indicates an overbought market, while a reading below 30 suggests an oversold market. When the Moving Average Ribbon suggests an entry, confirm it with RSI values that align with the trend direction without signaling extreme conditions. For instance, a bullish entry should be supported by an RSI above the oversold threshold, preferably rising towards the midpoint (50), which indicates increasing bullish momentum.
Incorporating the MACD for Entry Confirmation
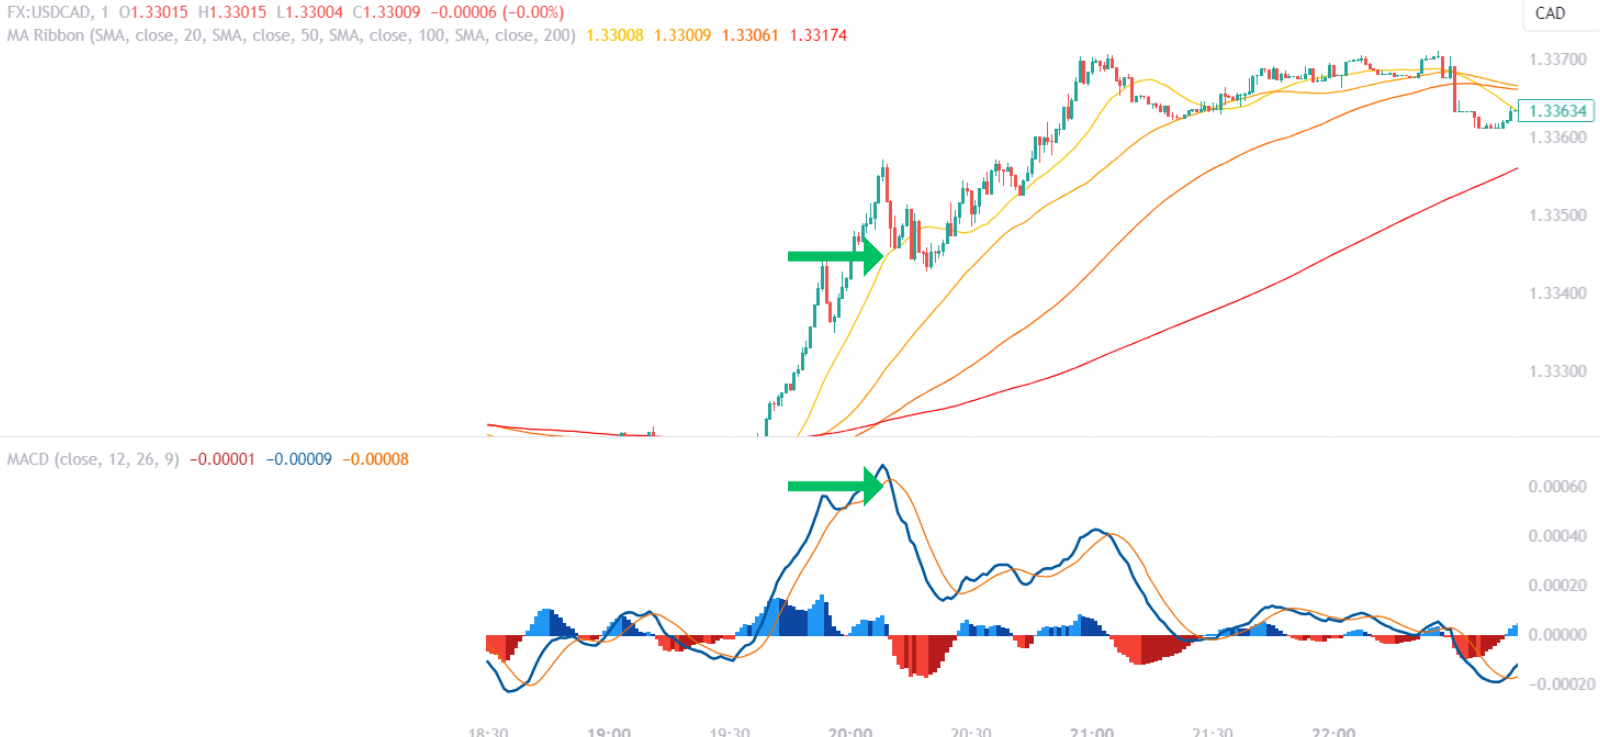
The Moving Average Convergence Divergence (MACD) is another tool that complements the Moving Average Ribbon. It consists of two moving averages (a fast and a slow one) and a histogram that measures the distance between them. A bullish signal is reinforced when the MACD line (fast MA) crosses above the signal line (slow MA), particularly if this crossover occurs above the histogram’s baseline, implying positive momentum. Conversely, for bearish signals, the MACD line crossing below the signal line while the histogram bars descend below the baseline strengthens the validity of a downtrend.
Applying Bollinger Bands for Market Volatility Insights
Bollinger Bands provide insight into market volatility and price levels relative to moving averages. The bands widen during periods of high volatility and contract during low volatility. A price breaking above the upper Bollinger Band may indicate a strong upward move, especially if the Moving Average Ribbon aligns bullishly. Similarly, a price dip below the lower band could validate a bearish entry, provided the ribbon is oriented downwards. The mid-line of the Bollinger Bands, typically a simple moving average, also serves as an additional reference point for the Moving Average Ribbon’s signals.
Leveraging Volume-Based Indicators for Confirmation
Volume-based indicators like the On-Balance Volume (OBV) or Volume-Weighted Average Price (VWAP) can corroborate the signals from the Moving Average Ribbon. OBV adds volume on up days and subtracts it on down days, offering a cumulative measure that can confirm the trend’s strength. A rising OBV alongside an ascending ribbon fortifies a bullish entry. VWAP provides a volume-average price for the day, acting as a benchmark. When prices are above VWAP in conjunction with a bullish ribbon, it suggests a strong uptrend, favoring long entries.
| Indicator | Trend Confirmation | Ideal Condition |
|---|---|---|
| RSI | Aligns with Ribbon Direction | Avoids Extreme Overbought/Oversold Readings |
| MACD | Crossover Supports Ribbon Signal | Histogram Confirms Momentum Direction |
| Bollinger Bands | Price Break Aligns with Ribbon | Bands Concur with Volatility Assessment |
| OBV | Volume Trend Matches Ribbon | Cumulative Volume Growth Supports Trend |
| VWAP | Price Relative to VWAP Matches Ribbon | Prices Above/Below VWAP Confirm Trend |
By integrating these indicators into the analysis, traders can attain a multi-dimensional view of the market, enhancing the reliability of the entries predicated on the Moving Average Ribbon. Each indicator adds a layer of confirmation, mitigating the risk of false positives and enabling more strategic decision-making.
4. What Are the Best Practices for Moving Average Ribbon Strategy?
Optimize Period Settings for Market Conditions
Best practices for the Moving Average Ribbon strategy involve optimizing the period settings for the specific market conditions. Shorter periods can be responsive to price changes, offering timely signals in volatile markets. Conversely, longer periods may be more suitable in trending markets to avoid market noise and short-term fluctuations. Traders should regularly backtest different period combinations to determine the optimal settings for their trading style and the current market environment.
Balance Between Responsiveness and Reliability
Achieving a balance between responsiveness and reliability is key. Use a variety of moving averages to create a comprehensive ribbon that can accurately reflect different market dynamics. A common approach is to include a mix of short, medium, and long-term moving averages. This setup allows for the detection of both immediate price movements and more established trends, providing a layered perspective on market momentum.
Apply Consistent Visual Analysis
Consistent visual analysis is crucial when interpreting the Moving Average Ribbon. Pay attention to the separation and order of the moving averages. A well-ordered, fan-like structure usually indicates a clear trend, while a tangled or converging set of lines may signal a trend losing its strength or a market in consolidation. Visual cues should always be assessed in the context of recent price action to avoid misinterpretation.
Integrate with Other Technical Indicators
Incorporate other technical indicators to validate signals. While the Moving Average Ribbon is a powerful tool on its own, it is most effective when used in conjunction with other indicators such as RSI, MACD, or Bollinger Bands. These complementary tools can help confirm trend strength, momentum, and potential reversals, leading to more informed trading decisions.
Monitor Market Context and Adjust Accordingly
Always consider the broader market context. Economic data releases, geopolitical events, and market sentiment can all influence price action and the effectiveness of the Moving Average Ribbon strategy. Stay informed about the broader market conditions and be prepared to adjust the strategy accordingly. This might involve tightening stop-loss orders ahead of major announcements or reassessing the chosen moving average periods in response to a shift in market volatility.
By adhering to these best practices, traders can enhance the efficacy of the Moving Average Ribbon strategy, potentially leading to more successful trading outcomes.
4.1. Time Frame Considerations
Time Frame Considerations
When integrating the Moving Average Ribbon into a trading strategy, the selection of time frames is critical. Different time frames can dramatically affect the interpretation of market trends and the resulting trading decisions. Shorter time frames, like the 1-minute to 15-minute charts, are typically utilized by day traders who seek to capture quick, intraday price movements. These traders rely on the ribbon for immediate trend identification and swift entry and exit points. However, this comes with increased market noise, which can lead to a higher frequency of false signals.
Longer time frames, such as 4-hour, daily, or weekly charts, are favored by swing and position traders. These traders are less concerned with short-term fluctuations and more focused on capturing larger market movements over days, weeks, or even months. On these time frames, the Moving Average Ribbon helps to filter out minor price changes and provides a clearer view of the prevailing trend. Longer time frames tend to offer more reliable signals, as they reflect more significant shifts in market sentiment.
| Time Frame | Trading Style | Ribbon Characteristics | Signal Reliability |
|---|---|---|---|
| Short (1-15min) | Day Trading | Quick trend identification | Lower (more noise) |
| Long (4H-Daily) | Swing/Position | Filters minor price fluctuations | Higher (less noise) |
It’s also essential for traders to align the time frame with their individual trading style and risk tolerance. A mismatch can lead to discomfort and misaligned trades. For instance, a risk-averse trader may find the frequent adjustments required by a short time frame strategy too stressful, while an active trader might find longer time frames too slow and unresponsive to their needs.
The Moving Average Ribbon’s parameters should be adjusted to suit the chosen time frame. Shorter moving average periods are generally better for shorter time frames, while longer periods are more appropriate for longer time frames. This customization ensures that the ribbon remains sensitive to the specific market dynamics at play within the chosen time frame, enhancing the trader’s ability to make well-informed decisions.
4.2. Risk Management Techniques
Position Sizing
Position sizing is a fundamental risk management technique. It involves determining the amount of capital to allocate to a trade based on the trader’s risk tolerance and account size. A common method is to risk a small percentage of the account on a single trade, typically between 1% and 2%. This strategy ensures that a series of losses will not significantly draw down the account, allowing the trader to continue operating even during a losing streak.
Stop-Loss Orders
Stop-loss orders are crucial for controlling potential losses. These orders are set at a predetermined level and will automatically close a position when the price reaches that point. In the context of the Moving Average Ribbon, a stop-loss might be placed just below a key moving average within the ribbon or under a recent swing low in a long position. For a short position, the stop-loss could be placed above a key moving average or a recent swing high.
Take-Profit Orders
Equally important are take-profit orders, which lock in profits by closing a position once the target price is reached. Setting these orders requires an understanding of the market’s volatility and the average price movement. When using the Moving Average Ribbon, take-profit levels might align with key resistance levels in an uptrend or support levels in a downtrend.
Trailing Stops
Trailing stops offer a dynamic approach to risk management. They adjust as the price moves in favor of the trade, preserving a portion of the profits if the market reverses. A trailing stop can be set as a fixed distance from the market price or based on a technical indicator, such as a moving average from the ribbon.
Diversification
Lastly, diversification across different asset classes or market sectors can mitigate unsystematic risk. By not overexposing to a single market, traders can reduce the impact of sector-specific downturns. Combining the Moving Average Ribbon strategy with diversification helps balance the portfolio, potentially smoothing out returns over time.
| Risk Management Technique | Purpose | Implementation with Moving Average Ribbon |
|---|---|---|
| Position Sizing | Limit exposure per trade | Allocate a small percentage of the account |
| Stop-Loss Orders | Control potential losses | Set below/above key MAs or swing points |
| Take-Profit Orders | Secure profits | Align with resistance/support levels |
| Trailing Stops | Preserve profits as price moves in favor | Adjust based on price changes or MAs |
| Diversification | Reduce sector-specific risk | Spread trades across different assets |
By employing these risk management techniques, traders can help protect their capital while utilizing the Moving Average Ribbon strategy to navigate the markets.
4.3. Combining with Other Trading Strategies
Harmonizing with Price Action Techniques
Integrating the Moving Average Ribbon with price action strategies enhances the trader’s capability to discern high-quality entry points. Price action focuses on the analysis of pure price movements, patterns, and formations without the reliance on additional indicators. When the Moving Average Ribbon indicates a potential entry, confirmation through price action—such as a bullish engulfing pattern or a break of a key resistance level—can provide a higher degree of conviction in the trade.
Synergy with Chart Patterns
Chart patterns, like head and shoulders, triangles, or flags, can also be synthesized with the Moving Average Ribbon. These patterns often signal continuation or reversal, and when they align with the trend direction indicated by the ribbon, the probability of a successful trade can increase. For instance, a flag formation occurring above a bullish-oriented Moving Average Ribbon could reinforce the likelihood of an upward breakout.
Strategic Integration with Fibonacci Retracements
Fibonacci retracements are a popular tool for identifying potential support and resistance levels based on previous market swings. When the ribbon suggests a bullish trend and the price retraces to a significant Fibonacci level, such as the 61.8% retracement, and holds, the confluence of these signals can serve as a robust entry point for a long position. Conversely, in a downtrend, a retracement to a Fibonacci resistance level that coincides with the ribbon’s guidance could be an optimal point to initiate a short.
Coordination with Elliott Wave Theory
The principles of Elliott Wave Theory can be coordinated with the Moving Average Ribbon to anticipate trend continuations or reversals. If the ribbon identifies a strong trend and Elliott Wave analysis indicates the completion of a corrective wave, entering at the start of the next impulse wave aligns with the existing momentum, potentially leading to a more profitable outcome.
Confluence with Candlestick Formations
Lastly, candlestick formations such as hammers, shooting stars, or doji can be powerful when combined with the ribbon. A doji candlestick forming at the edge of the ribbon during a pullback may signal indecision and the potential resumption of the trend. When these candlestick signals appear in sync with the ribbon’s trend direction, they can act as a catalyst for entering or exiting trades.
By strategically combining the Moving Average Ribbon with these diverse trading strategies, traders can construct a multifaceted approach that leverages the strengths of several analytical methods. This integration can lead to a more nuanced understanding of the market, enabling traders to make decisions with greater confidence and precision.
5. What To Consider Before Using the Moving Average Ribbon?
Assessing Market Type and Conditions
Before implementing the Moving Average Ribbon, identify the market type—ranging or trending—as this affects the indicator’s efficacy. In a strong trending market, the ribbon provides clear signals and its multiple moving averages offer dynamic support or resistance levels. However, in a ranging market, the moving averages may produce numerous crossovers, leading to false signals and potential losses.
Customization of Moving Average Periods
Customizing the moving averages within the ribbon is crucial to align with trading objectives and the specific asset’s characteristics. Highly volatile markets may require shorter moving averages for quicker responses, whereas less volatile markets benefit from longer periods that filter out noise. Continuous backtesting and adjustment ensure the ribbon’s periods remain relevant to current market conditions.
Correlation with Trading Strategy
Ensure the Moving Average Ribbon aligns with your overall trading strategy. It should complement your trading style, risk tolerance, and time frame preference. For example, scalpers and day traders might use a tighter ribbon for short-term signals, while swing traders may prefer a wider ribbon for long-term trend confirmation.
Integration with Other Technical Tools
While the Moving Average Ribbon is a comprehensive tool, it should not be used in isolation. Integrating it with other technical analysis instruments enhances signal accuracy. Ensure these tools do not provide redundant information but rather offer different perspectives, such as volume, momentum, or volatility.
Awareness of Economic Events and News Releases
Stay aware of economic events and news releases, as these can drastically affect market conditions and the performance of technical indicators like the Moving Average Ribbon. Sudden market moves caused by news events may not be accurately reflected by the indicator, which could lead to misleading signals. It’s advisable to avoid trading during major news releases or to adjust the strategy to account for increased volatility.
By considering these factors, traders can optimize the use of the Moving Average Ribbon in their trading arsenal, improving their ability to navigate diverse market scenarios effectively.
5.1. Market Conditions and Volatility
Assessing Volatility with the Moving Average Ribbon
Volatility plays a pivotal role in the effectiveness of the Moving Average Ribbon. High volatility often results in wider spreads between the moving averages, signaling strong trends but also greater risk of rapid reversals. Conversely, low volatility may lead to narrower spreads and more frequent crossovers, indicative of a consolidating market with less directional momentum.
Traders can gauge volatility by observing the expansion and contraction of the ribbon. An expanding ribbon suggests increasing volatility and potentially a strengthening trend. On the other hand, a contracting ribbon could signal decreasing volatility, often associated with a forthcoming change in trend direction or a move into a range-bound market.
| Volatility Level | Ribbon Spread | Market Implication |
|---|---|---|
| High | Wide | Strong Trend, Higher Risk |
| Low | Narrow | Consolidation, Lower Risk |
To navigate volatile markets with the Moving Average Ribbon, it’s advisable to adjust the sensitivity of the moving averages. Shorter periods can be employed to react quickly to price changes, while longer periods may dampen the effect of volatility, providing a smoother trend line less prone to whipsaws.
Incorporating a volatility index, such as the VIX, or a volatility-based indicator, like the Average True Range (ATR), can provide additional context. These tools can help confirm whether the current market volatility aligns with the signals from the Moving Average Ribbon, allowing for more nuanced entries and exits.
By actively monitoring and adapting to the prevailing volatility, traders can fine-tune the Moving Average Ribbon’s responsiveness, enhancing its utility as a component of a comprehensive trading strategy.
5.2. Limitations of Moving Average Ribbon
Lagging Nature
The Moving Average Ribbon, by design, is a lagging indicator. It inherently relies on past price data to generate its lines, which means it provides a historical perspective and may not predict future price movements accurately. This lag can cause delays in signal generation, leading to late entries or exits in fast-moving markets.
Signal Clarity in Sideways Markets
The Moving Average Ribbon can produce ambiguous signals in sideways or ranging markets. The moving averages tend to converge and crisscross frequently, which can result in a series of false starts or misleading trend indications. This can lead to increased trading costs and reduced profitability due to whipsaw trades.
Over-reliance and Complacency
Traders may become over-reliant on the Moving Average Ribbon, assuming it is a fail-safe tool for market analysis. This overconfidence can lead to complacency, where traders neglect other important aspects of technical analysis, such as price action or volume. No single indicator should be used in isolation, and the ribbon is no exception.
Sensitivity to Market Conditions
Adjusting the Moving Average Ribbon’s sensitivity is a double-edged sword. Set the moving averages too short, and the ribbon will react to every minor price change, increasing the risk of false signals. Set them too long, and the ribbon might smooth out important market moves, causing delayed reactions to actual trend changes.
Impact of Volatility
Volatility spikes can have an adverse effect on the Moving Average Ribbon’s performance. High volatility can lead to a widened ribbon, which might suggest a strong trend when, in reality, it could be a temporary market overreaction. Conversely, low volatility can cause the ribbon to contract, potentially minimizing the significance of a genuine trend development.
| Limitation | Consequence |
|---|---|
| Lagging Indicator | Late entries/exits, missed opportunities |
| Sideways Market Signals | Ambiguous signals, increased false positives |
| Over-reliance | Neglect of other analysis tools, complacency |
| Sensitivity Adjustment | Risk of false signals or delayed trend recognition |
| Volatility Impact | Misinterpretation of strength or weakness of trends |
Understanding these limitations is crucial for traders to mitigate risks and apply the Moving Average Ribbon effectively within a broader trading strategy.
5.3. Importance of Backtesting
Backtesting: A Necessity for Strategy Validation
Backtesting is an integral part of developing and refining trading strategies. By applying the Moving Average Ribbon to historical data, traders can objectively evaluate the performance of this tool across different market conditions. This process allows for the optimization of ribbon parameters, such as the selection of moving average periods that best align with the asset’s price action and volatility.
The key benefit of backtesting lies in its ability to highlight the strengths and weaknesses of a strategy without risking actual capital. For instance, a trader can determine if the Moving Average Ribbon consistently provides early entry signals in trending markets or if it produces too many false positives during range-bound periods. By identifying these patterns, traders can set appropriate filters and adjust risk management techniques, such as the placement of stop-loss and take-profit orders, to improve the overall efficacy of their approach.
Moreover, backtesting facilitates stress testing under various market scenarios, including high volatility events and atypical market disruptions. Traders gain insights into how the strategy would have performed during past market crises, enabling them to incorporate preventive measures in their current trading plans.
While backtesting is not a guarantee of future performance due to ever-changing market dynamics, it serves as a critical step in strategy development. It helps traders build confidence in their methodology and provides a foundation for continuous improvement. Regular backtesting, combined with forward testing in a demo environment, ensures that a strategy remains relevant and robust against the backdrop of an evolving market landscape.
| Backtesting Aspect | Purpose | Outcome |
|---|---|---|
| Parameter Optimization | Fine-tune Moving Average Ribbon settings | Enhanced strategy alignment with market trends |
| Performance Evaluation | Assess historical strategy efficacy | Informed adjustments to trading approach |
| Risk Management | Test effectiveness of protective measures | Improved capital preservation tactics |
| Stress Testing | Simulate strategy resilience in crises | Preparedness for extreme market conditions |
By embracing backtesting as a cornerstone of strategy development, traders ensure that their use of the Moving Average Ribbon is not based on theoretical assumptions but on empirical evidence that can withstand the test of time.