1. What is TRIX?
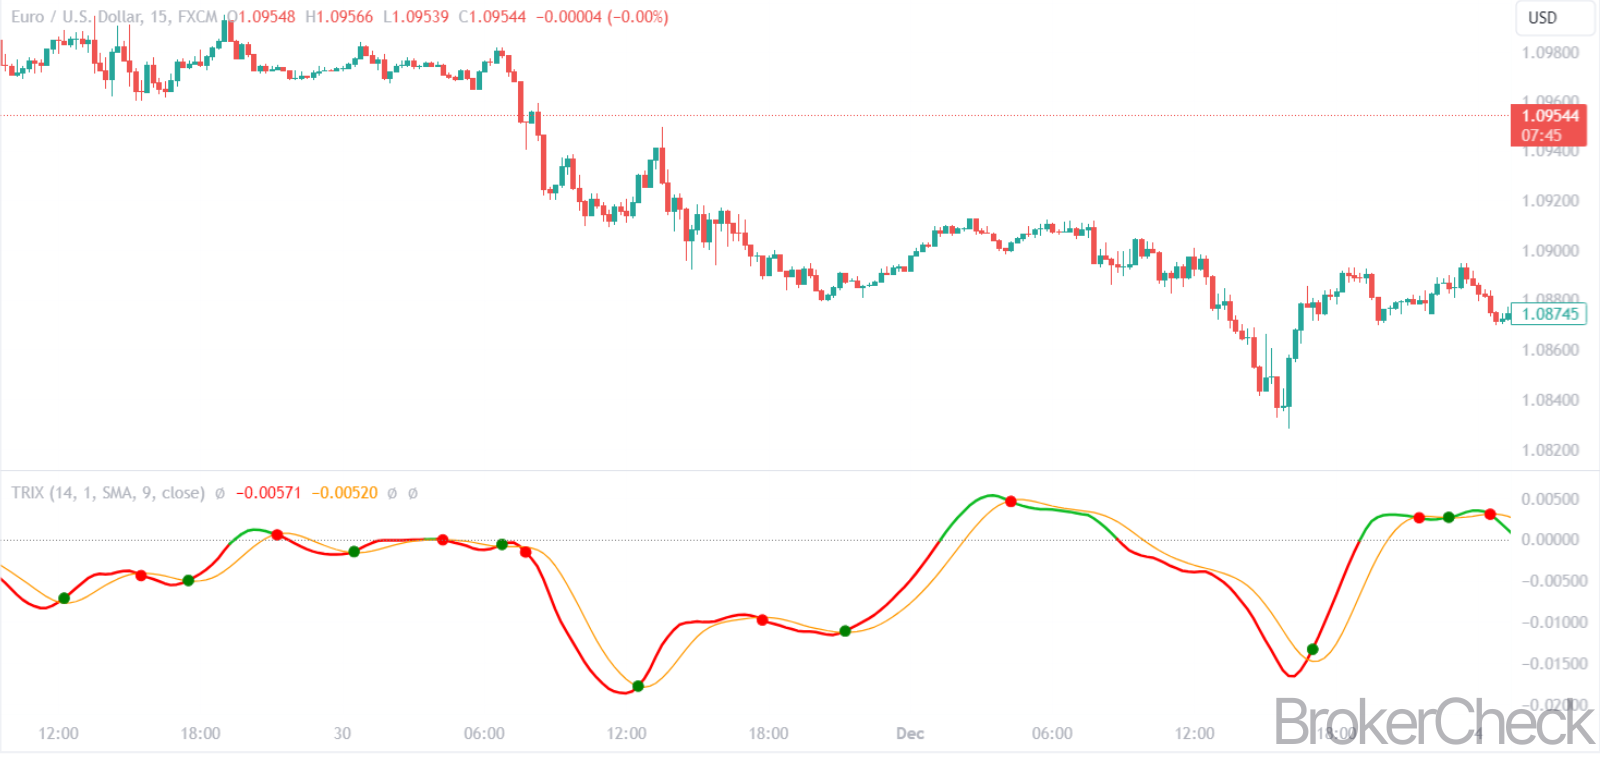
TRIX is a momentum oscillator that stands for Triple Exponential Average. It was developed by Jack Hutson in the early 1980s and is designed to filter out market noise that can mislead traders about the true direction of the market. TRIX is calculated by taking a triple-smoothed exponential moving average of the closing price and then calculating the rate of change percentage of that average.
The formula for TRIX is as follows:
TRIX = (EMA3_today – EMA3_yesterday) / EMA3_yesterday * 100
Where EMA3 is the triple exponential moving average.
The main line of the TRIX is typically plotted alongside a signal line, which is a moving average of the TRIX line itself. Crossovers between these two lines can indicate potential buy or sell signals.
TRIX can also be used to identify overbought and oversold conditions in the market. When the TRIX line is at extremely high or low levels, it may suggest that the asset is overextended and due for correction. Traders often watch for divergences between the TRIX and price as well, which can signal potential reversals.
2. How do You Set Up TRIX on Your Trading Platform?
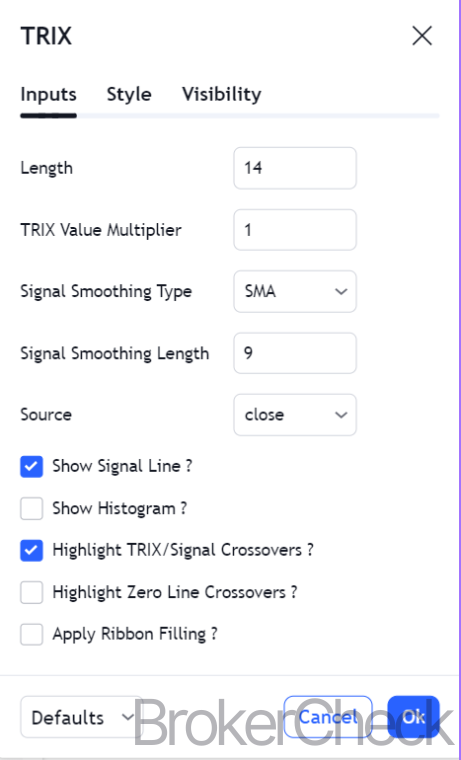
The following parameters can help you set up TRIX on your trading platform:
2.1. Selecting the Right Time Frame for TRIX
Selecting the appropriate time frame for the TRIX indicator is imperative to align with your trading objectives and the market dynamics of your asset.
- Short-term traders often use shorter time frames, such as 1-minute to 15-minute charts, to capture quick movements and exit positions within the same trading day.
- In contrast, swing traders may prefer hourly to 4-hour charts to hold positions for several days or weeks, seeking to profit from short to medium-term trends.
- Long-term investors might utilize daily to weekly charts, focusing on the broader trend and not reacting to intra-day price fluctuations.
The time frame selection impacts the sensitivity of the TRIX indicator to price changes. Shorter time frames result in a more sensitive TRIX line that reacts quickly to price movements. Conversely, longer time frames provide a smoother TRIX line, reducing false signals but potentially delaying entry and exit points.
To illustrate the effect of time frame selection, consider the following examples where the TRIX period is set to 15 and the signal line to 9:
| Time Frame | TRIX Sensitivity | Suitable For |
| 1-minute | High | Scalping |
| 15-minute | Moderate | Day Trading |
| 1-hour | Lower | Swing Trading |
| Daily | Lowest | Long-Term Investing |
2.2. Adjusting TRIX Parameters for Volatility
Adjusting the parameters of the TRIX indicator to match market volatility is a critical step in optimizing its performance. By tweaking the TRIX parameters, traders can make the indicator more responsive to volatile conditions or more stable during quieter market phases.
For highly volatile markets, reducing the TRIX period will make the indicator more sensitive to price changes. This allows traders to capture rapid movements and react quickly to market dynamics. However, it’s important to be cautious as a more sensitive TRIX can also produce more false signals. Conversely, in a less volatile market, increasing the TRIX period can help filter out noise and provide more reliable signals, albeit at a slower pace.
Here’s a guideline for adjusting the TRIX period according to volatility:
| Market Volatility | TRIX Period Adjustment | Impact |
| High | Decrease | Increases sensitivity, quicker signals |
| Low | Increase | Decreases sensitivity, smoother signals |
For the signal line, the same logic applies. A shorter signal line period will react faster, which is suitable for volatile markets, while a longer period will smooth out the signal line’s movements, which is better for less volatile conditions.
Consider the following adjustments for different market scenarios:
| Market Condition | TRIX Period | Signal Line Period |
| High Volatility | 12 | 7 |
| Moderate Volatility | 15 | 9 |
| Low Volatility | 18 | 12 |
2.3. Combining TRIX with Other Technical Indicators
The TRIX indicator’s effectiveness is significantly enhanced when paired with other technical analysis tools. Combining TRIX with Relative Strength Index (RSI), Moving Average Convergence Divergence (MACD), or Stochastic Oscillator can validate signals and reduce the likelihood of false entries or exits.
- For instance, RSI can help confirm TRIX signals by identifying overbought or oversold conditions.
- When integrating TRIX with MACD, traders look for confirmation of trend changes.
- The Stochastic Oscillator is useful for spotting short-term overbought or oversold conditions.
- Bollinger Bands can also complement TRIX by offering visual cues about the volatility and current price levels relative to historical norms.
Support and Resistance levels are another vital addition, providing context to TRIX signals. A TRIX line crossover near a key support or resistance level may suggest a strong move if the level is breached.
Here is a comparative table of how each indicator may complement TRIX:
| Technical Indicator | Function | Complements TRIX By |
| RSI | Identifies overbought/oversold | Confirming TRIX crossovers |
| MACD | Shows trend changes and momentum | Reinforcing trend signals |
| Stochastic | Signals overbought/oversold | Validating short-term extremes |
| Bollinger Bands | Indicates volatility and norm | Highlighting potential reversals |
| Support/Resistance | Defines price barriers | Contextualizing TRIX signals |
3. How to Use TRIX for Trend Analysis?
When employing TRIX for trend analysis, traders focus on a few key aspects: bullish and bearish signals, divergence, and crossovers. These elements assist in making informed decisions about market entry and exit points.
3.1. Identifying Bullish and Bearish Signals with TRIX
The TRIX indicator serves as a tool for identifying trend direction and momentum, with particular attention to bullish and bearish signals.
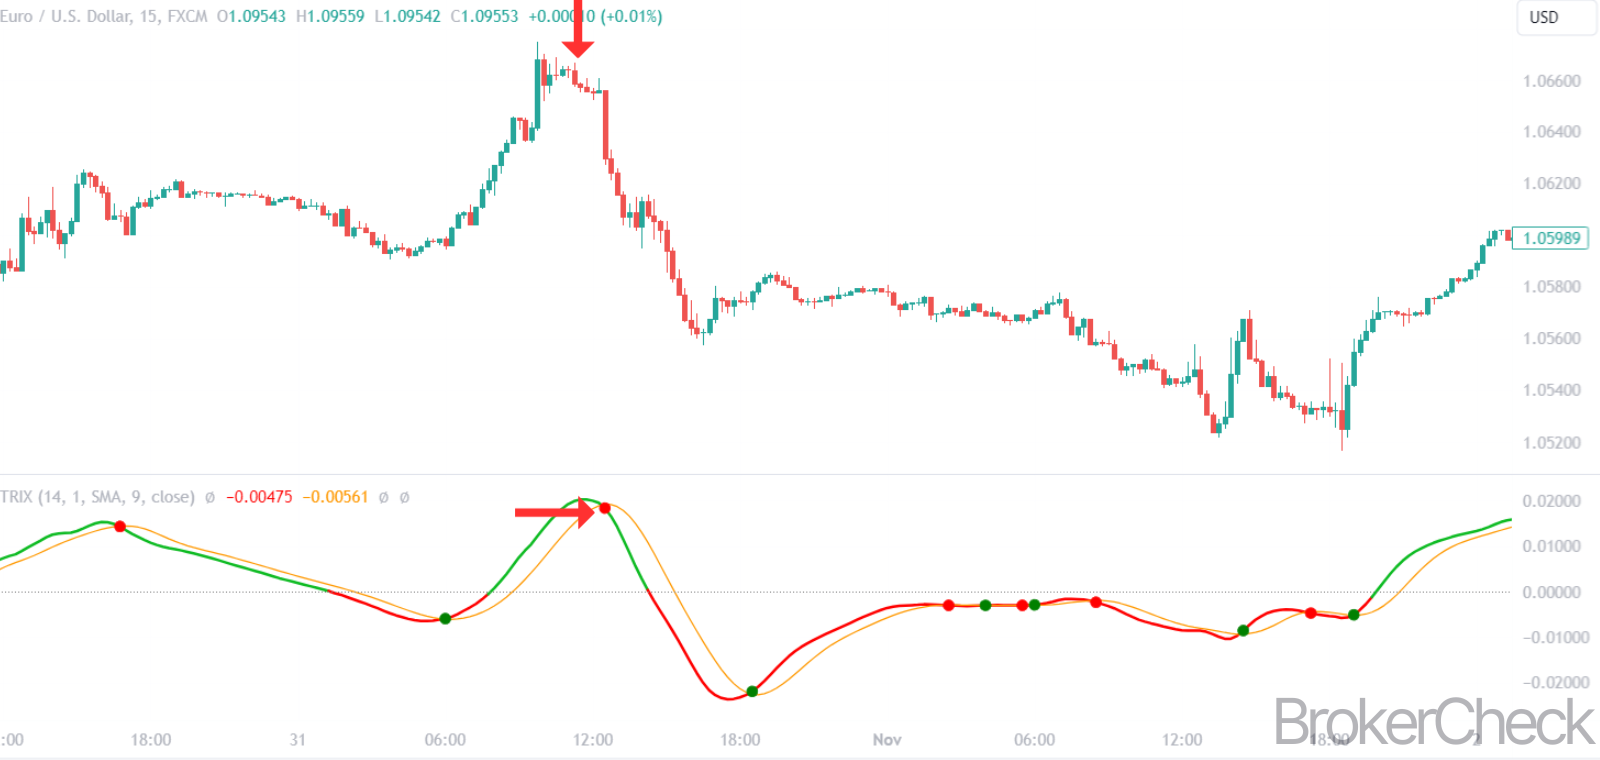
- Bullish signals are generated when the TRIX line crosses above the signal line or the zero line, indicating potential upward momentum and an opportunity to initiate a long position.
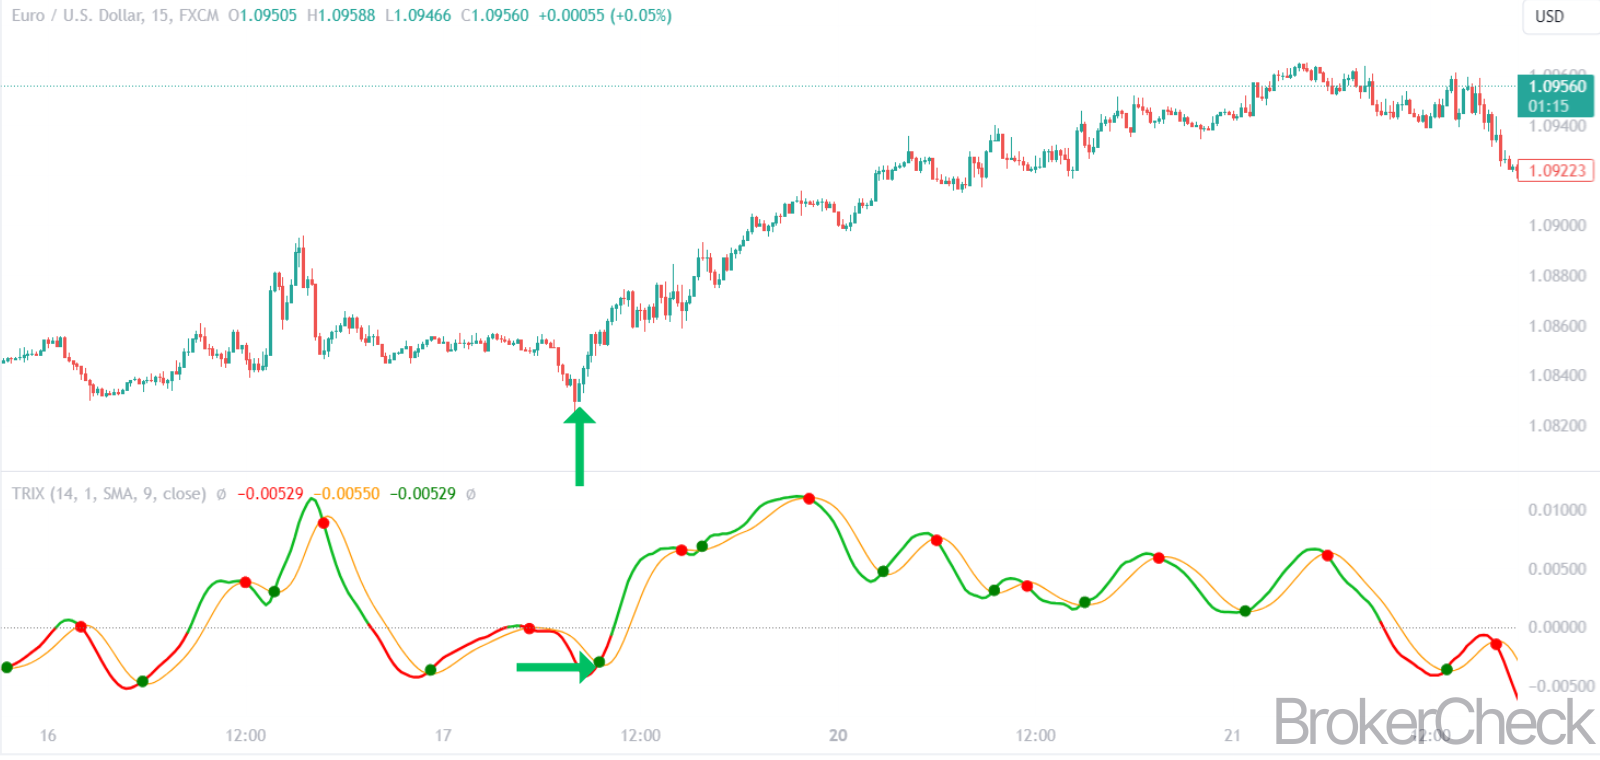
- Conversely, bearish signals are identified when the TRIX line crosses below the signal line or zero line, suggesting downward momentum and a signal to consider a short position or exit a long position.
Signal identification through TRIX is further refined by observing the slope of the TRIX line itself. An upward slope can reinforce bullish signals, while a downward slope can confirm bearish signals.
Zero line crossovers are another critical component, where the TRIX line crossing the zero line from below signals a strengthening in the positive trend, and crossing from above signals a strengthening in the negative trend.
| TRIX Line Activity | Signal Line Activity | Zero Line Crossover | Implication |
| Cross above | Cross above | From below | Strong Bullish Signal |
| Cross below | Cross below | From above | Strong Bearish Signal |
| Upward slope | Nearing crossover | N/A | Bullish Momentum |
| Downward slope | Nearing crossover | N/A | Bearish Momentum |
The reliability of TRIX signals can be enhanced by confirmation from volume data or additional technical indicators, ensuring that traders are not acting on false positives. For example, a bullish TRIX signal with increasing volume and a supportive candlestick pattern could provide a high-confidence entry point.
In practice, traders should be cautious of whipsaws—false signals that can occur in sideways or choppy markets. To mitigate this risk, some traders may employ a filter, such as waiting for the TRIX line to exceed a certain threshold before considering a signal valid or using a secondary indicator for confirmation.
3.2. Divergence Trading Using TRIX
Divergence trading with the TRIX indicator is a method used to spot discrepancies between the indicator’s movement and the price action of an asset. These discrepancies can often foretell a potential reversal in the current trend. Traders need to be vigilant for two types of divergences: bullish divergence and bearish divergence.
Bullish divergence occurs when the asset’s price creates a new low, but the TRIX forms a higher low, suggesting a decrease in downward momentum and a potential upward movement. In contrast, bearish divergence happens when the asset’s price achieves a new high while the TRIX records a lower high, indicating diminishing upward momentum and a possible downward turn.
Here’s a quick reference for identifying TRIX divergences:
| Price Action | TRIX Indicator | Type of Divergence |
| Lower Lows | Higher Lows | Bullish Divergence |
| Higher Highs | Lower Highs | Bearish Divergence |
These divergences can be substantial indicators for traders, providing an early warning of trend fatigue. However, divergences should not be used in isolation. They are best employed in conjunction with other technical analysis tools for confirmation. For example, a bullish divergence in TRIX might be confirmed by a reversal candlestick pattern or an oversold reading on the Relative Strength Index (RSI).
3.3. Using TRIX Cross-Overs as Entry or Exit Points
TRIX cross-overs serve as critical junctures for traders to make entry or exit decisions. These cross-overs occur when the TRIX line intersects with the signal line, often indicating a shift in momentum and a potential change in trend direction.
Entry points are typically identified when the TRIX line crosses above the signal line, suggesting an increasing momentum and a potential uptrend. Traders might consider this a cue to open a long position. Conversely, exit points are suggested when the TRIX line crosses below the signal line, indicating decreasing momentum and a potential downtrend, prompting a possible short position or the closure of a long position.
The effectiveness of these signals can vary based on the chosen time frame and market conditions. Therefore, it’s essential to align cross-over signals with the broader trend and to look for confirmation through other indicators or volume analysis.
Here’s a breakdown of TRIX cross-over signals:
| TRIX Line Crosses | Implication | Potential Action |
| Above signal line | Increasing momentum | The entry point for a long position |
| Below signal line | Decreasing momentum | Exit point for long or Entry for short position |
Traders should be aware that in volatile markets, TRIX cross-overs can happen more frequently, leading to potential whipsaws. To combat this, some traders may implement additional filters, such as requiring the cross-over to be maintained for a specific duration or exceeding a predefined threshold before acting on the signal.
4. What are the Best Strategies for Incorporating TRIX?
Incorporating TRIX into a trading strategy involves a multi-faceted approach. The following strategies can help you grasp this concept in a better way:
4.1. TRIX and Moving Average Convergence
TRIX and moving average convergence present a dynamic duo in technical analysis. Traders gain a nuanced view of market momentum and trend changes by pairing TRIX with its own moving average. The standard practice involves using an exponential moving average (EMA) of the TRIX line, typically over a nine-period timeframe. This EMA acts as a signal line; when the TRIX crosses above the EMA, it suggests a buying opportunity, while a cross below may signal a selling point.
Utilizing TRIX convergence with a moving average enables traders to filter out noise and focus on significant market moves. The EMA provides a smoothed representation of the TRIX oscillations; thus, when the TRIX line deviates substantially from its EMA, it can indicate a strong trend or a potential reversal.
Here is a simple representation of the trading signals generated from TRIX and moving average convergence:
| TRIX Line Position | EMA Position | Trading Signal |
| Above EMA | Rising | Buy Signal |
| Below EMA | Falling | Sell Signal |
TRIX cross-overs are a pivotal component of this strategy. A cross-over above the EMA is perceived as bullish, especially if accompanied by increasing trading volume or other confirming technical indicators. On the flip side, a cross-over below the EMA is seen as bearish, warranting further scrutiny and potential action if corroborated by additional bearish signals.
In terms of market conditions, the TRIX can be tailored to suit the prevailing environment. During periods of high volatility, shortening the TRIX period can make it more responsive to price changes, whereas lengthening the period during stable phases can help in avoiding false positives.
The table below outlines adjustments for TRIX settings based on market volatility:
| Market Volatility | TRIX Period Adjustment | Purpose |
| High | Shorter Period | Quick reaction to market changes |
| Low | Longer Period | Reduce noise and improve signal quality |
4.2. Pairing TRIX with Candlestick Patterns
Pairing the Triple Exponential Average (TRIX) with candlestick patterns provides traders with a powerful combination for pinpointing entry and exit points. This synergy capitalizes on TRIX’s ability to filter out market noise and identify trend strength, while candlestick patterns offer visual cues about market sentiment and potential price movements.
A bullish candlestick formation, such as a hammer or bullish engulfing pattern, occurring alongside a bullish TRIX signal—such as the TRIX line crossing above its signal line or the zero line—can reinforce the likelihood of an upward price movement. Conversely, bearish candlestick patterns like the shooting star or bearish engulfing, coupled with a bearish TRIX signal, can indicate a potential downtrend.
The following table demonstrates how traders might interpret the confluence of TRIX signals with candlestick patterns:
| TRIX Signal | Candlestick Pattern | Action Implication |
| Bullish | Bullish Pattern | Strong Buy Signal |
| Bearish | Bearish Pattern | Strong Sell Signal |
4.3. TRIX in Different Market Conditions
The Triple Exponential Average (TRIX) serves as a momentum oscillator that can adapt to different market conditions by filtering minor price movements and highlighting the underlying trend. Its utility varies across trending, range-bound, and volatile market scenarios.
In trending markets, TRIX’s sensitivity to price changes allows it to confirm the strength and persistence of a trend. Traders can capitalize on this by aligning their positions with TRIX crossovers and divergences that reinforce the direction of the prevailing trend.
In volatile markets, frequent crossovers may lead to whipsaws, prompting traders to adjust the TRIX period for better signal accuracy. A shorter period may be beneficial to react promptly to price changes, while a longer period might reduce false signals during less volatile periods.
Range-bound or sideways markets pose challenges for momentum oscillators like TRIX. False signals are more common as the lack of a clear trend can result in misleading crossover signals. Here, traders might combine TRIX with other technical tools, such as Bollinger Bands or Oscillators like Stochastics, to better gauge the market’s direction and strength.
Adjusting TRIX settings based on market conditions can optimize its performance:
| Market Condition | Adjustment | Rationale |
| Trending | Follow crossovers and divergences | Align with trend momentum |
| Volatile | Shorten TRIX period | Quicker response to rapid price movements |
| Sideways | Combine with other indicators | Mitigate false signals from a lack of trend |
5. What to Consider When Trading with TRIX?
When considering the application of TRIX in trading, the following parameters need to be evaluated carefully:
5.1. The Importance of Risk Management
Risk management stands as a cornerstone of successful trading, particularly when employing technical indicators like TRIX. The objective is to minimize potential losses while maximizing gains, a balance that requires strategic planning and disciplined execution. Effective risk management entails understanding market volatility, using stop-loss orders appropriately, and determining suitable position sizes.
Stop-loss orders are a trader’s first line of defense against sudden market movements that could result in substantial losses. By setting a stop-loss order at a level that aligns with technical support or resistance or a predetermined percentage away from the entry point, traders can limit their exposure.
Position sizing is equally critical. The size of a position should be calibrated according to the trader’s risk tolerance and the volatility of the market. It is prudent to risk only a fraction of the trading capital on any single trade to withstand a series of losses without significantly depleting one’s account.
Here’s a brief overview of risk management essentials:
- Stop-Loss Orders: Set at strategic levels to cap potential losses.
- Position Sizing: Adjust according to risk tolerance and market conditions.
- Capital Preservation: Prioritize the protection of trading capital to ensure longevity in the market.
The following table summarizes key risk management tactics:
| Risk Management Component | Purpose | Implementation Strategy |
| Stop-Loss Orders | Limit potential losses | Set at technical levels or percentage from entry |
| Position Sizing | Control the amount of capital at risk | Based on volatility and individual risk appetite |
| Leverage | Enhance potential returns | Use judiciously to manage amplified risks |
5.2. Limitations of TRIX in Sideways Markets
TRIX, or the Triple Exponential Average, is an oscillator used to identify overbought or oversold conditions in a market, as well as to gauge momentum. However, in sideways markets, where price movements are limited to a tight range without a clear trend, TRIX may face limitations:
- False Signals: TRIX may generate crossover signals that don’t correspond to significant price movements, leading to poor trading decisions.
- Lagging Indicator: As a momentum oscillator, TRIX can lag in sideways markets, providing delayed information that may no longer be relevant.
- Reduced Efficacy: Without a trend, the strength of TRIX diminishes as it relies on the direction and persistence of price movements to be effective.
Traders should be cautious when relying on TRIX in non-trending markets. Here are some considerations:
- Confirmation: Look for confirmation from other indicators or analysis methods to validate TRIX signals.
- Adjustment of Settings: Alter the indicator’s sensitivity by adjusting the calculation period to better suit range-bound conditions.
- Complementary Indicators: Combine TRIX with indicators that perform well in sideways markets, such as oscillators (RSI, Stochastics) or volume-based indicators.
| Consideration | Action Item |
| False Signals in Sideways Markets | Employ additional indicators for confirmation |
| Lagging Nature of TRIX | Adjust TRIX settings to reduce lag |
| Complementary Tools | Use oscillators or volume indicators alongside TRIX |
5.3. Adjusting Strategies to Suit Individual Trading Styles
Adapting trading strategies to individual styles is crucial for optimizing the use of technical indicators like TRIX. Traders vary in their approach to risk, reaction to market movements, and investment time horizons, necessitating a personalized approach to technical analysis.
Scalpers, for instance, who engage in rapid and frequent trades, may benefit from using a shorter TRIX period to capitalize on quick market movements. Conversely, swing traders looking for opportunities over several days or weeks might prefer a longer TRIX period to filter out the noise and focus on more significant trend shifts.
The table below exemplifies how TRIX settings could be adjusted according to trading styles:
| Trading Style | TRIX Period Adjustment | Rationale |
| Scalping | Shorter Period | Capture rapid price movements |
| Swing Trading | Longer Period | Filter out short-term volatility |
Here are key aspects to consider when customizing TRIX:
- Sensitivity: Balance the need for early signals against the risk of false alarms.
- Confirmation: Use additional indicators or tools to confirm TRIX signals.
- Market Analysis: Continuously analyze market conditions to ensure that the TRIX settings remain appropriate.
| Aspect | Customization Consideration |
| Sensitivity | Adjust TRIX to balance signal timeliness and accuracy |
| Confirmation | Employ other indicators for signal validation |
| Market Analysis | Regularly reassess market conditions for optimal TRIX usage |