1. Understanding Williams Fractals in Trading
Incorporating Williams Fractals into a trading strategy typically involves looking for the formation of fractal signals on price charts. Here’s how to identify a Williams Fractal:
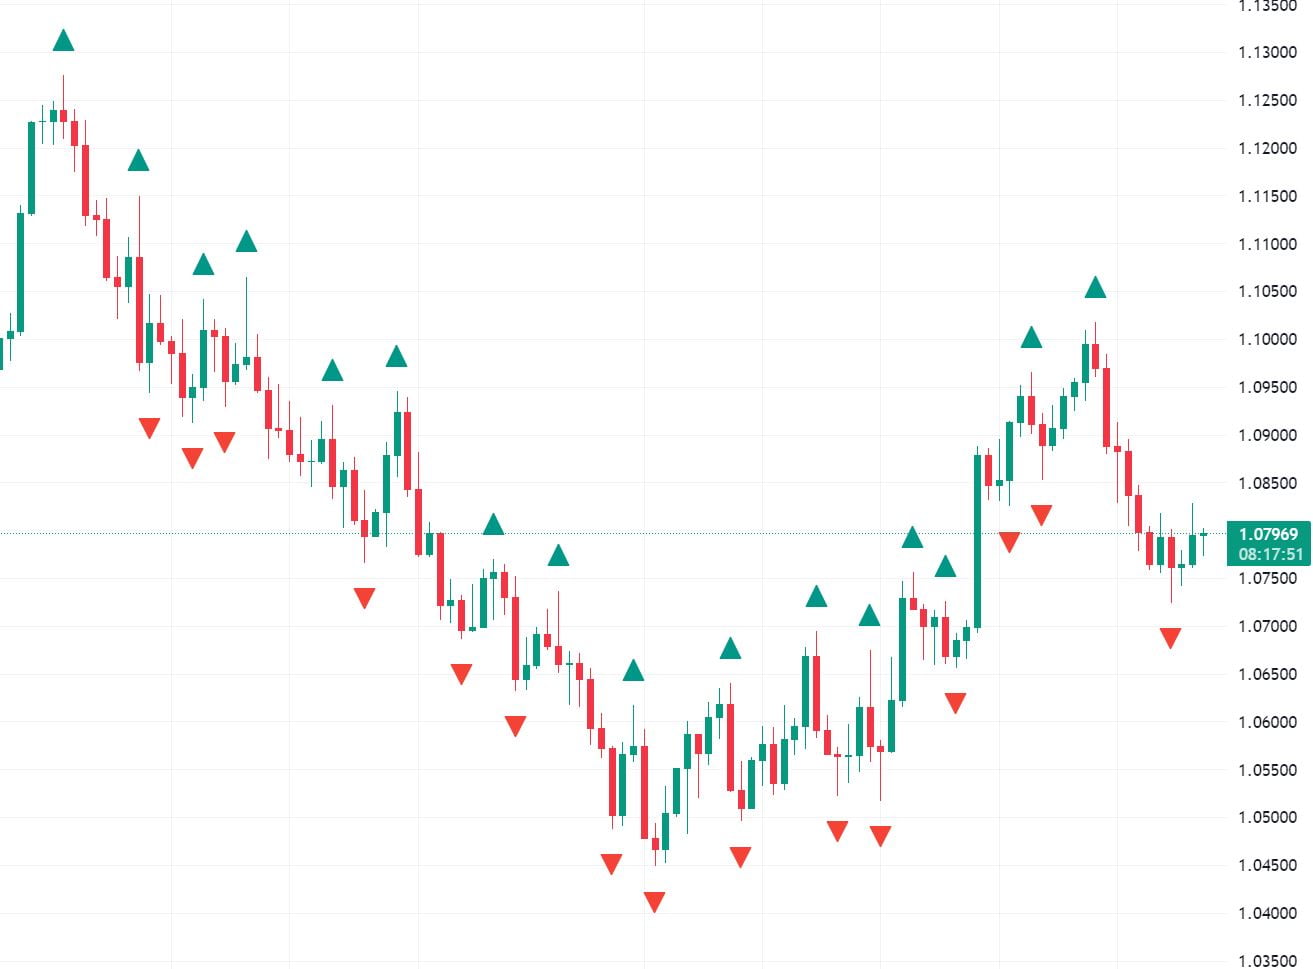
- Bullish Fractal: Occurs when there is a low point with two higher lows on each side.
- Bearish Fractal: Forms when there is a high point with two lower highs on each side.
Traders often wait for the fractal to be “locked in” or confirmed, which happens when two additional bars have formed after the highest high or lowest low. This confirmation helps to avoid potential false signals that can occur in the volatile market environment.

Technical Analysis with Williams Fractals
Practical Application of Williams Fractals:
- Entry Points: Traders might enter a long position after a bullish fractal signal is confirmed, or a short position following a bearish fractal.
- Stop-Loss Placement: Fractals can be used to place stop-loss orders. For instance, after entering a long position, a trader could place a stop-loss below the most recent fractal low.
- Support and Resistance: Fractals can act as natural support or resistance levels, which traders can use to identify breakout points.
Combining with Other Indicators:
| Indicator | Purpose of Combination |
|---|---|
| Moving Averages | To confirm the trend direction before trading on fractal signals. |
| Alligator Indicator | To filter fractal signals based on the market’s trend phase. |
| Average True Range (ATR) | To manage volatility and set appropriate stop-loss levels. |
| Fibonacci Retracement | To find confluence with fractal levels and refine entry points. |
Limitations and Considerations:
- Timing: Fractals can lag, as they require a pattern of five bars to form. Traders need to be aware of this to avoid late entries.
- False Signals: Not every fractal will indicate a reversal; some may occur during random price fluctuations.
- Market Context: It’s crucial to consider overall market conditions. Fractals may be more reliable during periods of trending markets than during sideways or choppy markets.
By understanding and applying Williams Fractals in conjunction with other technical analysis tools, traders can enhance their ability to make informed decisions in the pursuit of profitable trading opportunities. However, it’s important to remember that no indicator is foolproof, and proper risk management should always be a cornerstone of any trading strategy.
1.1. Definition and Origin of Williams Fractals
How Williams Fractals are Identified on Charts
Williams Fractals can be identified on trading charts when a specific pattern emerges. For a bullish fractal, the pattern requires that a single bar has two preceding and two following bars with lower highs. This is indicative of a potential upward price movement. Conversely, a bearish fractal is identified when a single bar has two preceding and two following bars with higher lows, signaling a potential downward price movement.
The typical structure of a Williams Fractal is as follows:
- Bullish Fractal: [Lower High] – [Lower High] – [Highest High] – [Lower High] – [Lower High]
- Bearish Fractal: [Higher Low] – [Higher Low] – [Lowest Low] – [Higher Low] – [Higher Low]
It is important to note that fractals can be part of more complex structures and often appear in clusters. These clusters can provide stronger signals as they suggest a more significant price level or zone that may act as support or resistance.
Practical Application in Trading Strategies
Traders use Williams Fractals in various ways:
- Identifying Reversal Points: Fractals can signal potential reversal points when they appear at key levels of support and resistance.
- Breakout Confirmation: A break beyond the high or low of a fractal can confirm a breakout, suggesting the continuation of the trend.
- Setting Stop-Loss Levels: Traders might place stop-loss orders just beyond the fractal’s high or low to manage risk.
- Trend Analysis: Multiple fractals in the same direction can indicate a strengthening trend.
Incorporating fractals into a trading strategy often involves using them in conjunction with other indicators, such as moving averages, Alligator indicator (also developed by Bill Williams), or momentum oscillators, to filter signals and reduce the likelihood of false breakouts.
Limitations and Considerations
While Williams Fractals can be a powerful tool, they are not without limitations:
- Lagging Nature: Fractals are lagging indicators since they require a pattern to be completed before providing a signal.
- False Signals: Like all technical analysis tools, fractals can produce false signals, especially in sideways or choppy market conditions.
- Subjectivity: Some degree of subjectivity is involved in interpreting fractal signals, as not all traders may agree on the significance of a particular pattern.
Traders should be aware of these limitations and consider using additional forms of analysis to confirm fractal signals. Risk management techniques should always be employed to protect against adverse market movements.
1.2. The Structure of a Fractal
Incorporating Williams Fractals into a trading strategy demands an understanding of their strengths and limitations. Here’s a quick breakdown of how traders might utilize fractals in their analysis:
| Usage | Description |
|---|---|
| Trend Identification | By observing a series of bullish or bearish fractals, traders can gauge the prevailing trend direction. |
| Breakout Confirmation | A fractal may serve as a confirmation point for a breakout, especially when aligned with other indicators like moving averages or volume. |
| Support and Resistance Levels | Fractals can highlight potential areas of support or resistance, providing targets for entry or exit points. |
| Stop-Loss Placement | The high or low of a fractal can act as a reference point for setting stop-loss orders to manage risk. |
Risk management is a cornerstone of successful trading, and fractals can play a role in this discipline. By identifying fractals, traders can set more informed stop-loss orders, potentially reducing the risk of significant losses.
In the realm of technical analysis, multiple indicator integration enhances the effectiveness of fractals. For example, a trader might combine fractals with:
- Moving Averages: To confirm the trend direction suggested by fractal patterns.
- Momentum Oscillators: Such as the RSI or Stochastic, to validate the strength of the market’s move.
- Volume Indicators: To confirm the presence of sufficient market participation at fractal turning points.
Effective use of fractals requires careful observation and a strategic approach to market entry and exit. Traders should be wary of relying solely on fractals, as no single indicator can provide all the answers in the dynamic and complex world of trading. Diligent analysis and a balanced use of complementary tools are essential for leveraging the insights fractals offer.
1.3. How Fractals Fit into Market Analysis
Fractals can be integrated with other technical analysis tools to enhance their effectiveness. For instance, combining fractals with moving averages or momentum indicators can provide a more robust trading system. When a fractal signal aligns with a moving average crossover or a momentum indicator reaching an extreme level, the probability of a reliable trading signal increases.
Key considerations when using fractals in market analysis:
- Confirmation: Wait for additional confirmation from other indicators or candlestick patterns to reduce the likelihood of false signals.
- Time frame: Fractals can be applied across various time frames, but it’s important to analyze multiple time frames to validate fractal signals.
- Risk management: Always use stop-loss orders to manage risk, as fractals do not guarantee market reversals and can lead to false breakouts.
Advantages of using fractals in trading:
- Simplicity: Fractals are easy to identify and apply, making them accessible to both novice and experienced traders.
- Versatility: Applicable in different market conditions and across various asset classes, including forex, stocks, and commodities.
- Structure: They provide a clear structure for analyzing price movements and can be used to set profit targets and stop-loss levels.
Limitations to consider:
- Lagging nature: Fractals are lagging indicators, as they require a complete pattern before providing a signal.
- False signals: Like all technical analysis tools, fractals can produce false signals, necessitating the use of additional confirmation techniques.
| Fractal Characteristics | Importance in Trading |
|---|---|
| Reversal Patterns | Identify potential turning points |
| Market Psychology | Understand trader behavior and sentiment |
| Trend Continuation | Confirm the persistence of a trend |
| Supply and Demand Dynamics | Gauge the strength of market movements |
By incorporating fractals into their market analysis, traders can develop a more nuanced understanding of market behavior. The patterns serve as a guide to the natural rhythm of market movements, offering a chance to align with the flow of the market for potentially profitable trades. However, it’s crucial to combine fractals with other analytical tools and sound risk management practices to enhance the quality of trading decisions.
2. Implementing Williams Fractals in Trading Strategies
Williams Fractals Trading Strategy
- Identify Fractal Patterns: Look for the characteristic five-bar pattern on the price chart. The central bar should be the highest or the lowest point, flanked by two lower highs or two higher lows.
- Wait for Confirmation: Ensure that two additional bars have closed after the fractal without invalidating it by surpassing the high or low of the central bar.
- Determine Market Trend: Use additional technical analysis tools to assess the overall market trend. This could be moving averages, trend lines, or the Alligator indicator.
- Combine with Other Indicators: Integrate momentum indicators like RSI or MACD for further confirmation of potential market reversals.
- Set Stop-Loss Orders: Place stop-losses just outside the fractal’s high or low to manage risk and protect against adverse market movements.
- Execute Trades: Enter long positions after a confirmed bullish fractal in an uptrend or short positions after a confirmed bearish fractal in a downtrend, with corroborative signals from other indicators.
Fractals and Moving Averages
| Trading Action | Bullish Fractal | Bearish Fractal |
|---|---|---|
| Price Above MA | Consider Long Position | Caution; Against Trend |
| Price Below MA | Caution; Against Trend | Consider Short Position |
Risk Management with Fractals
- Stop-Loss Placement: Just beyond the high or low of the fractal pattern.
- Position Sizing: Adjust based on the distance to the stop-loss to maintain a consistent risk level.
- Trade Adjustment: Move stop-loss to break-even or use trailing stops as the trade progresses favorably.
By incorporating Williams Fractals into their trading strategies, traders can leverage these patterns to spot potential reversals with the flexibility of application across different time frames and trading styles. Combining fractals with other technical analysis tools can provide a comprehensive approach to market entry and exit decisions, while careful risk management ensures that traders keep potential losses in check.
2.1. Identifying Trade Setups with Fractals
Incorporating multiple time frame analysis can further refine the effectiveness of fractal-based trade setups. By analyzing fractals on a longer-term chart to establish the overarching trend and then using a shorter-term chart for entry points, traders can synchronize their strategies with the market’s rhythm. This approach helps in filtering out the noise and focusing on fractals that are in sync with the dominant market direction.
Risk management is another critical aspect when trading with fractals. Since not all fractal signals will result in a successful trade, setting appropriate stop-loss orders is essential to protect against significant losses. A common practice is to place a stop loss just beyond the opposite end of the fractal pattern, providing a buffer against market volatility.
Moreover, integrating fractals with other technical tools, such as Fibonacci retracement levels, moving averages, or momentum oscillators, can offer a more comprehensive analysis. When a fractal aligns with other technical signals, the conviction for the trade increases.
| Fractal Type | Description | Entry Strategy | Alignment with Other Tools |
|---|---|---|---|
| Bullish | Low point with two higher lows | Buy above the high of the fractal | Stronger if above support or with uptrend |
| Bearish | High point with two lower highs | Sell below the low of the fractal | Stronger if below resistance or with downtrend |
Traders should also be aware of the limitations of fractals. In highly volatile markets, fractals may form too frequently, leading to confusion and potential overtrading. It’s advisable to apply fractals in conjunction with a clear trading plan and predefined rules to decide which fractals to trade and which to ignore.
Adapting to the market’s volatility and liquidity is also important. For instance, fractals might be more effective during times of high liquidity, such as when major market sessions overlap, since the patterns formed during these times may be more reflective of true market sentiment.
In conclusion, while fractals can be a powerful tool for identifying potential trade setups, they should be used as part of a broader trading strategy. By combining fractals with other technical analysis methods and sound risk management practices, traders can improve their chances of executing successful trades.
2.2. Combining Fractals with Other Technical Indicators
In the dynamic world of trading, diversification of analysis techniques is crucial. Bollinger Bands are a popular addition to the fractal trading strategy. When the bands are tight, it indicates low volatility, and a breakout fractal can signal the start of a new trend. Conversely, if a fractal forms near the edges of widened Bollinger Bands, it might indicate a potential reversal as prices are considered to be at extreme levels.
Chart patterns alongside fractals provide a visual confirmation of market structures. For example, a fractal that appears at the apex of a triangle pattern may offer a strong indication of the future price direction once the breakout occurs.
Fibonacci retracement levels can also be used with fractals to identify potential support and resistance levels. A fractal turning point that aligns with a key Fibonacci level may serve as a robust confirmation of where the market could potentially find a floor or ceiling.
Here’s a brief tabulation of how fractals can be combined with other technical indicators:
| Indicator Type | Purpose in Combination with Fractals | Example of Use |
|---|---|---|
| Moving Averages | Confirm trend direction | Fractal buy signal above a rising moving average |
| Momentum Indicators | Identify potential reversal points | Fractal at RSI overbought level |
| Alligator Indicator | Confirm trend presence and direction | Fractal breakout in the direction of the Alligator trend |
| Volume Indicators | Confirm breakout strength | High volume on fractal breakout |
| Bollinger Bands | Signal start of new trend or potential reversals at extreme levels | Fractal at the edge of widened Bollinger Bands |
| Chart Patterns | Visual confirmation of market structures | Fractal at the apex of a triangle pattern |
| Fibonacci Levels | Identify potential support and resistance levels | Fractal at a key Fibonacci retracement level |
Risk management is an integral part of trading with fractals. Traders should always use stop-loss orders to limit potential losses. A common practice is to place a stop-loss just beyond the opposite fractal from the entry point, ensuring a clear risk parameter is set.
Incorporating time frame analysis can further enhance the fractal trading strategy. Traders may look for fractal signals on a longer time frame to establish the overall trend, and then switch to a shorter time frame to fine-tune their entry and exit points.
By blending fractals with a range of technical analysis tools, traders can develop a multi-faceted trading strategy that is adaptive to various market conditions. This approach not only improves the likelihood of successful trades but also deepens a trader’s understanding of market dynamics.
2.3. Risk Management and Fractals
Understanding Williams Fractals
Williams Fractals are a five-bar reversal pattern introduced by Bill Williams. They are used to identify turning points in the market and are represented by an arrow above or below the middle candle in the pattern.
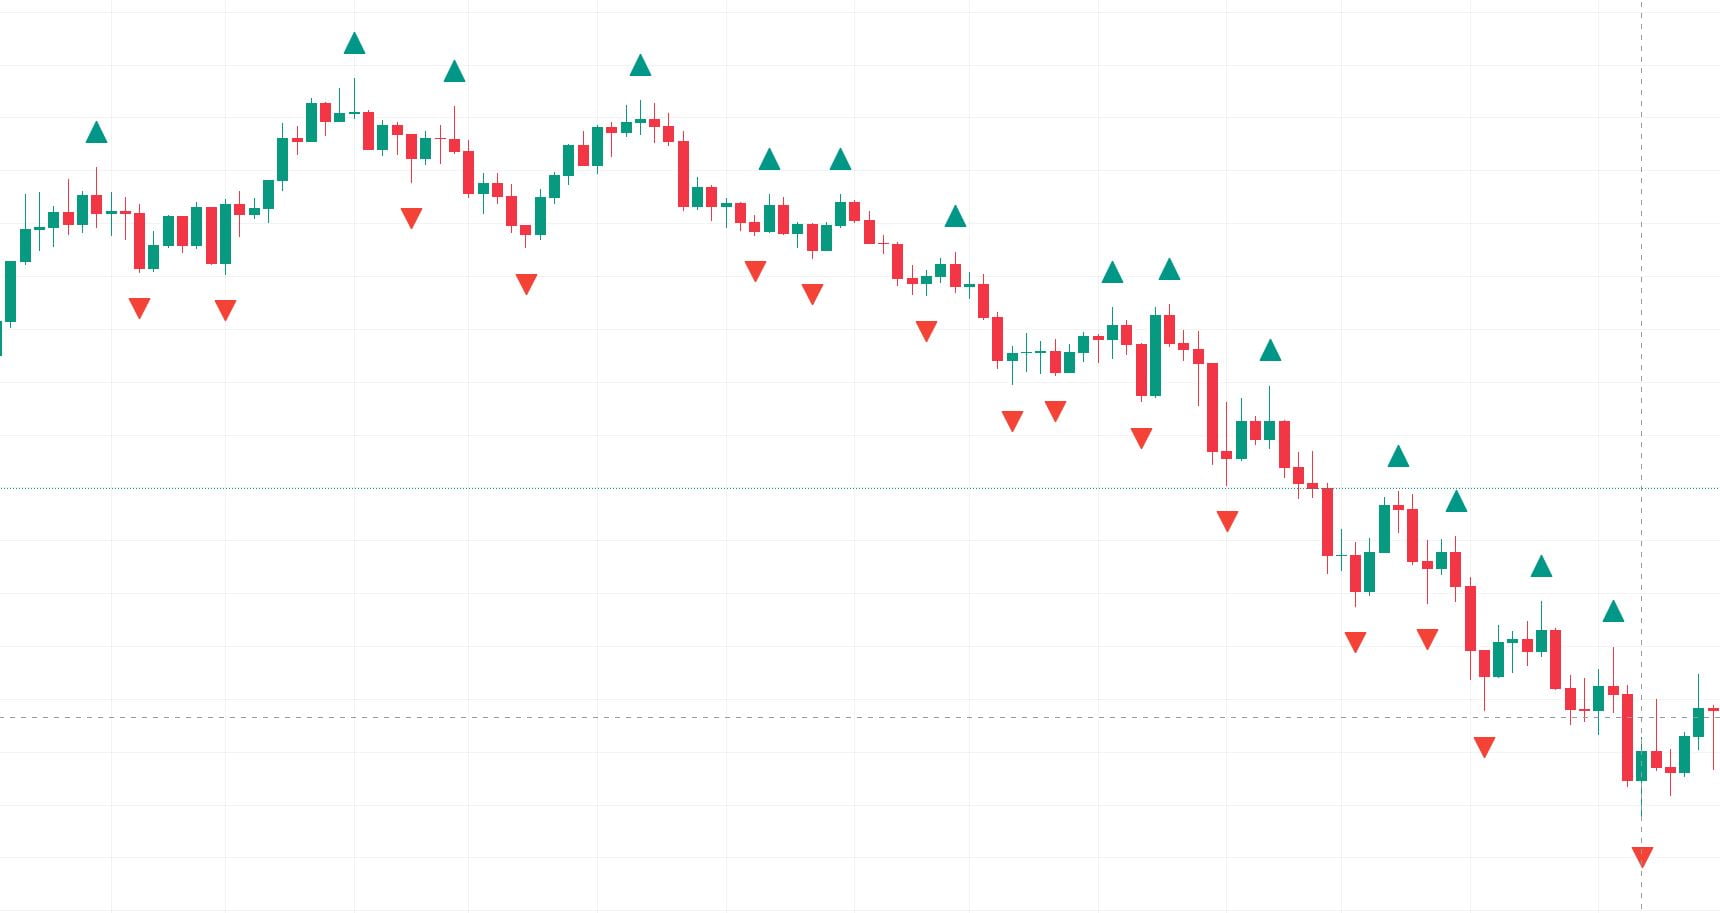
- Bullish Fractal: Occurs when there is a low point with two higher lows on each side.
- Bearish Fractal: Forms when there is a high point with two lower highs on each side.
Application in Risk Management
- Stop-Loss Placement: Fractals provide a natural level for placing stop-loss orders.
- For a long position, place a stop-loss below the low of a bullish fractal.
- For a short position, place a stop-loss above the high of a bearish fractal.
- Position Sizing: Calculate the risk per trade based on the distance to the fractal stop-loss.
- Determine the dollar amount to risk based on account size and risk tolerance.
- Adjust the trade size to ensure the loss does not exceed the predetermined risk level.
- Trailing Stops: Use fractals to adjust trailing stops.
- Move the stop-loss to the level of the latest fractal as the price moves favorably.
- This method secures profits while giving the trade room to breathe.
Integration with Other Tools
- Technical Analysis: Combine fractals with other indicators like moving averages, RSI, or Fibonacci levels for a robust analysis.
- Fundamental Analysis: Stay informed on news and economic events that could impact market volatility and price direction.
Fractals as Lagging Indicators
- Be aware of the delayed nature of fractals, as they require the completion of two additional candles to be confirmed.
- Do not depend exclusively on fractals; use them as part of a diversified trading strategy.
Practical Tips for Traders Using Fractals
- Regularly review and adjust stop-loss orders based on the latest fractal formations.
- Maintain discipline with position sizing to manage risk effectively.
- Be patient and wait for fractal confirmation before making trade adjustments.
- Keep an eye on the broader market context to avoid being misled by fractals during choppy or trending markets.
By incorporating fractals into a comprehensive risk management framework, traders can leverage these patterns to make more informed decisions and protect their capital.
2.4. Practical Examples of Fractal-Based Trades
Fractal-based trading requires patience and precision, as traders must wait for the fractal to fully form before making a move. Here’s a breakdown of potential fractal-based trades:
| Trade Type | Fractal Position | Complementary Indicator | Action |
|---|---|---|---|
| Breakout Trade | Above resistance | None | Go long |
| Breakout Trade | Below support | None | Go short |
| Trend Following | With moving average | Moving Average | Buy or sell depending on trend |
| Fibonacci Confluence | Near key Fibonacci level | Fibonacci Retracement | Buy or sell based on fractal direction |
| Oscillator Confirmation | With overbought/oversold signal | RSI/Stochastic | Buy or sell following oscillator signal |
When a breakout trade is considered, the following steps are typically taken:
- Identify a key level: Look for significant resistance or support levels on the chart.
- Wait for a fractal: A fractal should form near the identified level, indicating a potential price movement.
- Confirm breakout: Ensure the price breaks through the level, confirming the fractal’s prediction.
- Enter the trade: Once the breakout is confirmed, enter a long or short position accordingly.
- Set a stop-loss: Place a stop-loss order to manage risk in case the breakout fails.
For trend-following trades, the process involves:
- Determine the trend: Use a moving average to identify the current market trend.
- Spot a fractal: Find a fractal that aligns with the direction of the moving average.
- Confirm with the trend: Make sure the fractal supports the trend indicated by the moving average.
- Execute the trade: Enter a trade in the direction of the trend, using the fractal as confirmation.
- Implement risk control: Protect the position with a stop-loss order.
When combining fractals with Fibonacci retracement levels:
- Draw Fibonacci levels: Apply Fibonacci retracement levels to a chart during a trend.
- Locate a fractal: Look for fractals forming near significant Fibonacci levels like 61.8% or 38.2%.
- Assess reversal potential: A fractal near a key Fibonacci level may signal a strong reversal.
- Take a position: Enter a trade based on the fractal’s indication of market direction.
- Manage the risk: Use stop-loss orders to mitigate potential losses.
Incorporating oscillators involves:
- Select an oscillator: Choose an oscillator like the RSI or Stochastic.
- Monitor for extremes: Watch for overbought or oversold readings on the oscillator.
- Align fractal signals: Look for fractal formations that coincide with the oscillator’s signals.
- Refine entry/exit: Use the combined signals to enter or exit trades with greater confidence.
- Control the exposure: Set stop-loss orders to limit risk exposure.
Risk management remains a cornerstone of trading. Regardless of the strategy employed, traders should always protect their positions with stop-loss orders and be aware of market conditions that might affect the reliability of fractal signals. Combining fractals with other technical tools can create a more comprehensive trading strategy, but it’s essential to remember that no method guarantees success, and managing risk should always be a priority.