
1. What is the Advance Decline Line?
The Advance Decline Line (ADL) is a technical analysis tool used to illustrate market breadth. It represents the cumulative total of the differences between the number of advancing and declining issues on a stock exchange. On any given day, the ADL is calculated by subtracting the number of declining stocks from the number of advancing stocks and adding this result to the previous day’s ADL value.
Advancing stocks are those that close higher than their previous closing price, while declining stocks close lower. The ADL moves upwards when advances outnumber declines and trends downwards when there are more declining issues. This indicator is often used to confirm the strength of a market trend or to signal potential reversals when the ADL diverges from the market index.
Traders monitor the ADL for divergence, where the market may be reaching new highs or lows, but the ADL fails to follow suit. A divergence could indicate underlying strength or weakness in the market that isn’t reflected in the index’s price movements. For example, if an index continues to climb to new highs but the ADL begins to flatten or fall, it suggests that fewer stocks are participating in the rally, which could be a warning sign of a market top.
The ADL is a cornerstone of market breadth analysis, providing a deeper insight into the underlying dynamics of the market. It can be plotted on a chart alongside an index for visual comparison, helping traders to gauge the overall health of the market and make more informed trading decisions.
2. How is the Advance Decline Line Calculated?
The calculation of the Advance Decline Line (ADL) starts with the identification of advances and declines. Each trading day, the number of stocks ending higher than their previous close (advances) and those ending lower (declines) are tallied. The difference between these two figures is known as the daily net advances.
Daily Net Advances = Number of Advancing Stocks – Number of Declining Stocks
The cumulative total for the ADL is then derived by adding the daily net advances to the previous day’s ADL value. If the market is closed or no new data is available, the ADL remains unchanged from its last calculated value.
Here is a simplified representation of how the ADL might be calculated over three trading days:
| Day | Advancing Stocks | Declining Stocks | Daily Net Advances | Previous ADL | Current ADL |
|---|---|---|---|---|---|
| 1 | 500 | 300 | 200 | 0 | 200 |
| 2 | 450 | 350 | 100 | 200 | 300 |
| 3 | 400 | 400 | 0 | 300 | 300 |
On Day 1, the ADL starts at zero and 200 is the result of 500 advances minus 300 declines, leading to a new ADL of 200. On Day 2, the ADL increases by 100, the net advances for that day, resulting in a cumulative ADL of 300. On Day 3, there are no net advances as the number of advancing and declining stocks is equal, so the ADL remains at 300.
The cumulative nature of the ADL makes it a powerful tool for identifying long-term trends and potential reversals in market sentiment. It is essential to maintain accurate and consistent data for each trading day to ensure the reliability of the ADL.
2.1. Identifying Advances and Declines
The process of identifying advances and declines involves meticulous record-keeping and attention to detail. On any given trading day, each stock listed on an exchange must be classified as either an advance or a decline. Advances are stocks that have closed at a higher price than the previous day’s close, while declines are those that have closed lower.
To systematically track these movements, traders often rely on end-of-day data provided by stock exchanges or financial data services. This data includes the closing price of each stock, which is compared to its previous closing price to determine the day’s advances and declines.
A clear understanding of the distinction between advances and declines is crucial, as this forms the foundation for calculating the daily net advances. Here is an example of how advances and declines might be documented:
| Stock | Previous Close | Current Close | Status |
|---|---|---|---|
| A | $50 | $51 | Advance |
| B | $75 | $73 | Decline |
| C | $30 | $30 | Unchanged |
| D | $45 | $46 | Advance |
| E | $60 | $58 | Decline |
In this example, stocks A and D are advances, while stocks B and E are declines. Stock C remains unchanged and does not influence the daily net advances.
Accurate tracking of these movements is essential not only for the calculation of the ADL but also for other market breadth indicators that traders might use to assess market sentiment. The data must be error-free to avoid skewing the ADL and potentially misguiding investment decisions.
2.2. Calculating Daily Net Advances
Daily net advances are the cornerstone of calculating the Advance Decline Line (ADL), providing insight into the balance of buying and selling pressure across the market. This metric is derived by subtracting the number of declining stocks from the number of advancing stocks on a given trading day.
The formula for calculating daily net advances is straightforward:
Daily Net Advances = Number of Advancing Stocks – Number of Declining Stocks
Following the formula, if the market experiences more advancing stocks than declining ones, the daily net advances will be a positive number, indicating a bullish sentiment. Conversely, a predominance of declining stocks will result in a negative number, suggesting bearish sentiment.
The impact of daily net advances on the ADL is cumulative. Each trading day’s net advances are added to the previous day’s ADL value, which means that even small daily fluctuations can significantly affect the ADL over time.
For illustrative purposes, consider the following table showing the calculation of daily net advances over a three-day period:
| Day | Advancing Stocks | Declining Stocks | Daily Net Advances | Previous ADL | Current ADL |
|---|---|---|---|---|---|
| 1 | 520 | 280 | 240 | 0 | 240 |
| 2 | 430 | 370 | 60 | 240 | 300 |
| 3 | 390 | 410 | -20 | 300 | 280 |
On Day 1, the ADL starts at zero and gains 240 points due to more advances than declines. On Day 2, the ADL increases by 60 points, resulting in a cumulative ADL of 300. On Day 3, the ADL decreases by 20 points as the number of declining stocks exceeds the advancing ones, adjusting the cumulative ADL to 280.
The daily calculation of net advances is sensitive to market activity and can quickly reflect changes in sentiment. This sensitivity makes the ADL a valuable tool for traders looking for short-term market insights or confirmation of longer-term trends.
Consistency and accuracy in tracking the number of advancing and declining stocks are imperative to maintain the integrity of the ADL. This data, often obtained at market close, must be meticulously recorded to ensure the reliability of daily net advances as a measure of market breadth.
2.3. Cumulative Total for the Advance Decline Line
The cumulative total for the Advance Decline Line (ADL) serves as a running total that reflects the ongoing balance between advancing and declining stocks. This cumulative figure is what traders analyze to discern the health and potential direction of the stock market. A rising ADL suggests that a greater number of stocks are participating in an uptrend, which can be a sign of a robust market. Conversely, a falling ADL indicates a broader participation in a downtrend, potentially signaling a weakening market.
The calculation of the cumulative total is an ongoing process that never resets, unless a new data series is started. Each trading day’s net advances are added to the cumulative total from the previous day, which allows the ADL to reflect the long-term trend of market breadth:
Current ADL = Previous ADL + Daily Net Advances
For example, if the previous ADL was 5,000 and the current day’s net advances are 150, the new ADL would be:
Current ADL = 5,000 + 150 = 5,150
The ADL’s value can be positive or negative, depending on market conditions since inception. A positive cumulative total indicates that, over time, there have been more advancing stocks than declining ones. A negative total would indicate the opposite.
| Day | Daily Net Advances | Previous ADL | Current ADL |
|---|---|---|---|
| 1 | 150 | 5,000 | 5,150 |
| 2 | 200 | 5,150 | 5,350 |
| 3 | -100 | 5,350 | 5,250 |
In the above table, Day 2 sees a continuation of the upward trend with an additional 200 net advances, pushing the ADL to 5,350. On Day 3, the market shifts with 100 more declines than advances, causing the ADL to drop to 5,250.
The cumulative total is crucial because it can identify divergences when the market index is moving in one direction while the ADL moves in another. Such divergences may precede market reversals. Traders use the ADL to confirm the strength of trends indicated by market indices or to spot early warning signs of potential trend weakness.
It is important for traders to monitor the ADL alongside other indicators and market data to form a comprehensive view of market conditions. The ADL, when combined with price action and volume indicators, can provide a more complete picture of market sentiment and potential future movements.
3. How to Interpret the Advance Decline Line?
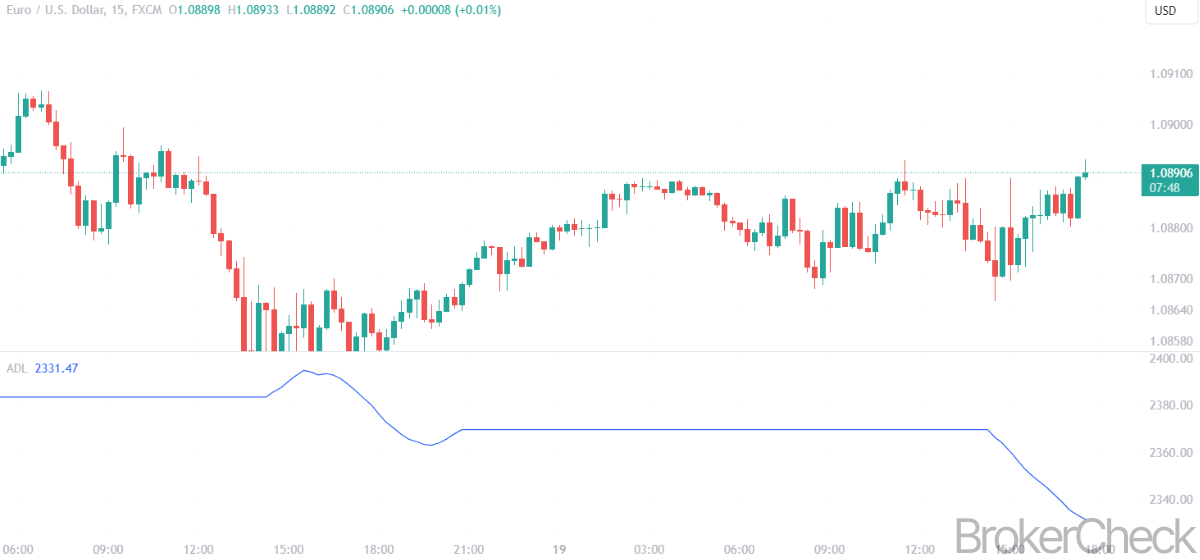
Interpreting the Advance Decline Line (ADL) involves looking for divergences, understanding trend strength, and analyzing its correlation with market indices. Divergences arise when the ADL moves in the opposite direction to a market index. A bullish divergence occurs when the ADL begins to rise while the index continues to fall, suggesting a potential upward trend reversal. Conversely, a bearish divergence happens when the ADL falls despite a rising index, warning of a possible downward reversal.
Bullish Divergence: ADL ↑ while Index ↓ Bearish Divergence: ADL ↓ while Index ↑
The ADL’s trajectory can gauge the strength of a trend. A strong uptrend in the market is often accompanied by a rising ADL, indicating broad participation among stocks. If the ADL flattens or declines while the market trend is up, it may signal that the uptrend is losing momentum.
Uptrend Confirmation: ADL and Index both ↑ Uptrend Weakness: ADL flattens or ↓ while Index ↑
Correlation with market indices is another critical aspect. The ADL should generally move in tandem with key indices like the S&P 500 or Dow Jones Industrial Average. A high correlation reinforces the prevailing market trend, while a decreasing correlation might indicate an underlying shift in market dynamics.
High Correlation: ADL and Index move together Decreasing Correlation: ADL and Index diverge
The table below illustrates how divergences and correlation might be observed:
| Scenario | Market Index Trend | ADL Trend | Interpretation |
|---|---|---|---|
| A | Upward | Upward | Confirmed uptrend |
| B | Downward | Downward | Confirmed downtrend |
| C | Upward | Flat | Possible uptrend weakness |
| D | Downward | Upward | Potential bullish divergence |
| E | Upward | Downward | Potential bearish divergence |
In scenarios A and B, the ADL confirms the market trend, while C suggests a weakening uptrend. Scenarios D and E indicate bullish and bearish divergences, respectively, which could signal impending trend reversals.
Traders examine these patterns in the context of other technical indicators and market news to validate their analysis. The ADL’s ability to reflect the participation level across stocks makes it a valuable tool for assessing the health of the market. However, it should be used in conjunction with other data points for a well-rounded trading strategy.
3.1. Bullish and Bearish Divergences
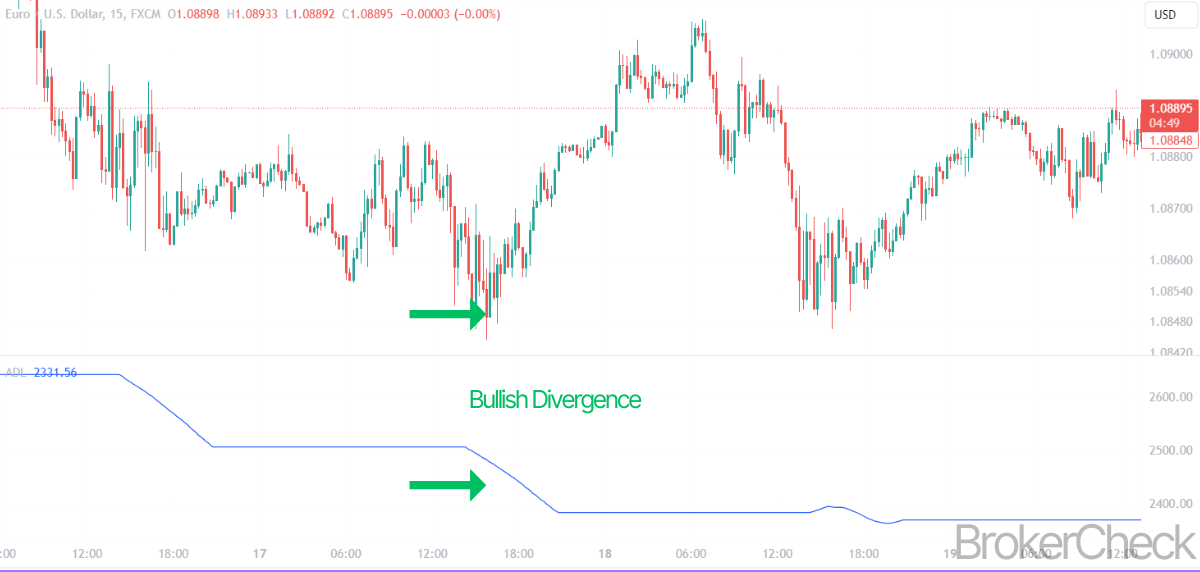
Bullish and bearish divergences between the Advance Decline Line (ADL) and market indices provide traders with signals about potential trend reversals. A bullish divergence occurs when the ADL starts to ascend during a period when the index is in decline. This suggests that despite the overall market downturn, a larger number of stocks are beginning to advance, which could indicate the market is gearing up for a rebound.
Bullish Divergence: ADL ↑ while Index ↓
In contrast, a bearish divergence is observed when the ADL begins to fall while the index is rising. This signals that fewer stocks are driving the index’s ascent, potentially foreshadowing a future downturn in the market as broader participation wanes.
Bearish Divergence: ADL ↓ while Index ↑
Divergences are critical as they can provide early warnings about the strength of the market trend. For traders, these signals are vital in decision-making processes for entries and exits. However, divergences should not be viewed in isolation. They are more reliable when confirmed by other technical indicators or significant shifts in market fundamentals.
The table below demonstrates how divergences might manifest over a sequence of trading days:
| Day | Market Index Movement | ADL Movement | Potential Signal |
|---|---|---|---|
| 1 | Increase | Decrease | Bearish Divergence |
| 2 | Decrease | Increase | Bullish Divergence |
| 3 | Increase | Increase | Trend Confirmation |
| 4 | Decrease | Decrease | Trend Confirmation |
| 5 | Increase | Flat | Uptrend Weakness |
Days 1 and 2 show classic bearish and bullish divergences, respectively. Days 3 and 4 exhibit trend confirmations where the ADL and market index move in the same direction. On Day 5, the flat ADL despite an increasing market index could suggest weakening upward momentum.
To harness the insights from bullish and bearish divergences effectively, traders integrate these observations into a broader analytical framework, considering factors such as trading volume, market sentiment, and economic indicators. The ADL’s divergence signals are then used to refine trading strategies, with a focus on mitigating risk and maximizing the potential for profit in changing market conditions.
3.2. Trends and Their Strength
When evaluating trends and their strength using the Advance Decline Line (ADL), traders scrutinize the direction and magnitude of the ADL’s movement over time. The ADL’s trend can either reinforce the strength of a market trend or highlight discrepancies between the number of advancing and declining stocks and the market’s overall performance.
Strong Trend Indicators:
- Consistent ADL Rise: Indicates broad market participation and a strong uptrend.
- Consistent ADL Decline: Suggests widespread selling and a strong downtrend.
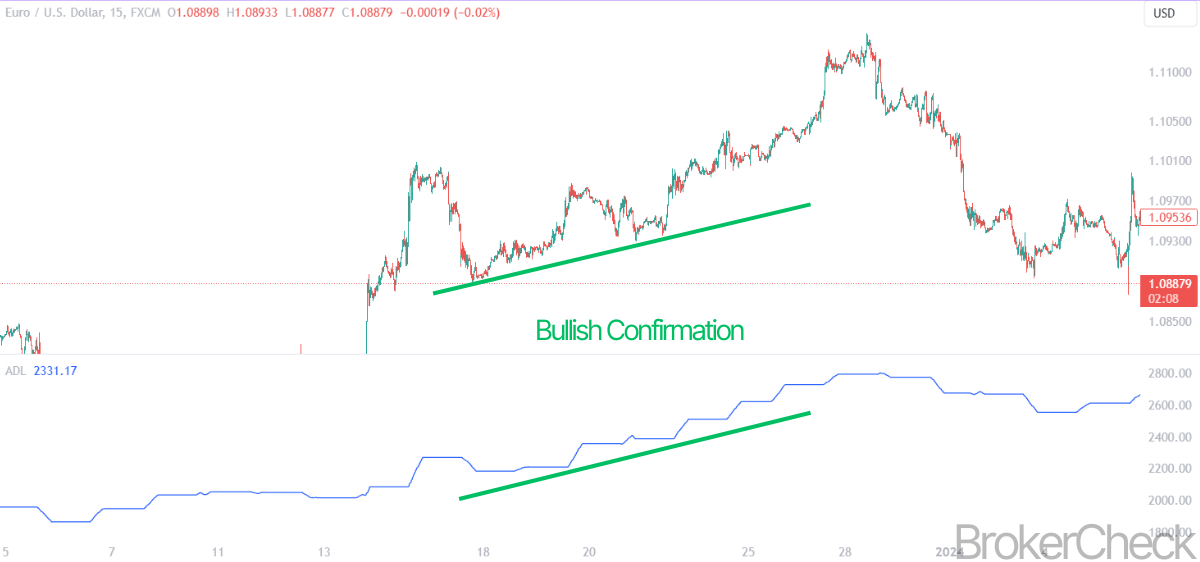
When the ADL consistently moves in the same direction as the market index, it reinforces the prevailing trend, suggesting that the momentum is backed by a broad base of stocks. Conversely, if the ADL starts to plateau or move in the opposite direction of the market index, it can be an early sign of a weakening trend.
Weak Trend Indicators:
- ADL Plateaus: May signal that a current uptrend is losing steam.
- ADL Diverges from Index: Indicates potential trend exhaustion or reversal.
The strength of a trend is also evident in the steepness of the ADL’s slope. A sharp incline or decline in the ADL suggests a strong trend with high conviction among market participants, while a gradual slope indicates a more tepid market sentiment.
Slope Considerations:
- Sharp ADL Slope: Reflects strong market conviction.
- Gradual ADL Slope: Points to weaker conviction and potential vulnerability to shifts in sentiment.
For a practical grasp of the ADL’s ability to measure trend strength, observe the following:
| Trend Type | ADL Movement | Market Index Movement | Strength Indication |
|---|---|---|---|
| Uptrend | Rising | Rising | Strong |
| Uptrend | Flat | Rising | Weakening |
| Downtrend | Falling | Falling | Strong |
| Downtrend | Flat | Falling | Weakening |
When the ADL and market index move in unison with a pronounced slope, the trend is considered strong. If the ADL flattens or trends in the opposite direction while the index continues its trajectory, the trend’s strength is in question.
Traders should monitor these ADL trends closely, as they can provide actionable insights. For example, a market index reaching new highs while the ADL flattens or declines could suggest that it’s time to tighten stop-loss orders or take profits in anticipation of a potential trend reversal.
3.3. Correlation with Market Indices
The correlation between the Advance Decline Line (ADL) and market indices like the S&P 500 or Dow Jones Industrial Average is a key metric for traders. A strong correlation implies that the ADL is moving in concert with the index, suggesting a healthy market where most stocks participate in the trend. A weak or negative correlation could signal that fewer stocks are contributing to the overall market movement, potentially indicating an unstable or deceptive market condition.
Correlation Strengths:
- Strong Positive Correlation: Both ADL and index move in the same direction.
- Weak or Negative Correlation: ADL and index move in opposite directions or lack synchronicity.
The correlation is quantifiable, often measured by the correlation coefficient, which ranges from -1 to 1. A coefficient close to 1 indicates a strong positive correlation, while a coefficient close to -1 signifies a strong negative correlation.
Correlation Coefficients:
- +1: Perfect positive correlation
- 0: No correlation
- -1: Perfect negative correlation
Traders analyze periods where the ADL deviates from its typical correlation with an index to identify potential market turning points or to confirm the strength of a current trend.
Correlation Observations:
| Market Condition | ADL Movement | Index Movement | Correlation Coefficient | Implication |
|---|---|---|---|---|
| Healthy Uptrend | Upward | Upward | Close to +1 | Broad participation, strong trend |
| Healthy Downtrend | Downward | Downward | Close to +1 | Broad selling pressure, strong trend |
| Weak or False Uptrend | Upward | Upward | Close to 0 or negative | Limited participation, trend vulnerability |
| Weak or False Downtrend | Downward | Downward | Close to 0 or negative | Limited selling pressure, trend vulnerability |
In practice, a divergence between the ADL and an index, especially if persistent, could indicate a shift in market dynamics that may not yet be reflected in the index’s performance. Such divergence may precede a trend reversal or slowdown, serving as an alert for traders to reassess their positions and strategies.
Traders use the ADL’s correlation with market indices as a complementary tool alongside other technical indicators to validate market trends and gauge the robustness of market movements. This multifaceted approach is crucial for making strategic trading decisions with a clearer understanding of market breadth and participant behavior.
4. What are the Limitations of the Advance Decline Line?
The Advance Decline Line (ADL), while a useful indicator of market breadth, comes with inherent limitations that traders must consider to avoid misinterpretation and potential losses.
Market Breadth Considerations: The ADL treats each stock equally, regardless of its market capitalization. This means a move in a small-cap stock has the same impact on the ADL as a move in a large-cap stock, which can skew the perception of market health. In markets dominated by a few large-cap stocks, the ADL might indicate a healthy market even when only the heavyweights are advancing, while the majority of smaller stocks decline.
Impact of Market Capitalization: Small-cap stocks, which are more numerous, can disproportionately affect the ADL. For instance, during a market rally led by large-cap stocks, the ADL might present a bearish divergence if small-cap stocks are not participating, potentially misleading traders about the market’s overall direction.
False Signals and Noise: The ADL can generate false signals during periods of high volatility or when the market is trending sideways. It can also be influenced by short-term noise rather than long-term trends, leading to confusion and misjudgment of market sentiment.
Key Limitations:
| Limitation | Description |
|---|---|
| Equal Weighting | All stocks have the same impact on the ADL, regardless of size. |
| Skewed by Market Cap | Large-cap movements may not be accurately reflected. |
| Susceptible to False Signals | Can mislead during volatile or sideways markets. |
| Influenced by Short-Term Noise | Short-term fluctuations may obscure long-term trends. |
Traders must remain aware that the ADL is just one piece of the puzzle. It should be used in conjunction with other tools and metrics, such as volume analysis and market capitalization-weighted indicators, to gain a more accurate picture of market conditions. This holistic approach can help mitigate the limitations of the ADL and refine trading strategies for better outcomes.
4.1. Market Breadth Considerations
Market breadth, represented by the Advance Decline Line (ADL), is a critical metric for understanding the undercurrents of market movements. However, the ADL’s methodology brings forth particular considerations that can influence its effectiveness as an analytical tool.
Market Breadth Skewness: The ADL’s equal weighting of stocks may cause distortions, particularly in a market where a few large-cap stocks drive index movements. A rising market index propelled by a handful of large-caps, while the broader market lags, may not be accurately reflected in an ADL that continues to rise due to the equal contribution of smaller stocks.
Misinterpretation Risks: Relying solely on the ADL can lead to misinterpretations of market strength or weakness. For instance, during a rally where the ADL is rising but driven mostly by small-cap stocks, the broader impact might be overstated if the large-cap stocks, which have a more significant influence on the market index, are not performing as well.
Data Overemphasis: Traders should be cautious not to overemphasize the data provided by the ADL without considering market capitalization nuances. This overemphasis could lead to overlooking the true market leaders or mistaking the general health of the market.
Market Breadth Interpretation:
| Market Condition | ADL Trend | Potential Interpretation | Consideration |
|---|---|---|---|
| Mixed Market | Upward | Healthy Market | May overstate health due to small-cap bias |
| Large-cap Rally | Upward | Confirmed Uptrend | Might not reflect lack of broad participation |
| Small-cap Decline | Downward | Broad Market Weakness | Large-caps could mask underlying weakness |
To navigate these considerations, traders should complement the ADL with market capitalization-weighted indices and other breadth indicators. This combination allows for a more nuanced view of the market, identifying whether movements are broad-based or concentrated among a few large players.
Complementary Indicators:
- Price-Weighted Indices: To account for the influence of large-cap stocks.
- Volume Analysis: For additional confirmation of market participation.
- Sector Analysis: To differentiate between broad market trends and sector-specific movements.
Incorporating these additional layers of analysis enables traders to construct a more comprehensive and accurate view of market dynamics, leading to better-informed trading decisions. The ADL remains a valuable tool, but its insights must be contextualized within the broader market framework to avoid missteps based on its inherent limitations.
4.2. Impact of Market Capitalization
Market capitalization, the total value of a company’s outstanding shares, plays a significant role in understanding the Advance Decline Line’s (ADL) impact. The ADL, by its nature, does not differentiate between companies of different sizes, treating each advancing or declining stock equally. This can lead to a skewed perception of market health, particularly in environments where market movements are dominated by a few large-cap stocks.
Key Impacts of Market Capitalization on the ADL:
- Equal Influence: Small-cap movements can disproportionately affect the ADL.
- Large-cap Dominance: The ADL may not reflect the true market direction during large-cap led rallies or sell-offs.
- Breadth Misrepresentation: A healthy ADL in a market driven by large-caps might mask underlying weakness in small to mid-cap stocks.
Considerations for Traders:
| Aspect | Impact on ADL |
|---|---|
| Small-Cap Bias | Can lead to overestimation of market strength |
| Large-Cap Movements | Might be underrepresented in the ADL |
| Market Breadth Accuracy | ADL can misrepresent true market participation |
Traders should be aware that the ADL’s insensitivity to market capitalization necessitates a careful analysis of market conditions. A robust market trend indicated by the ADL must be corroborated by the performance of market capitalization-weighted indices. This is especially crucial during periods when large-cap stocks significantly outperform or underperform the broader market.
Strategic Use of Market Capitalization Data:
- Diversification Analysis: Traders can compare the ADL with capitalization-weighted indices to gauge the breadth of market participation.
- Sector and Size Segmentation: By analyzing the ADL in the context of different market segments, traders can identify whether certain sectors or market caps are leading or lagging.
Trading Decisions Based on Market Cap Insights:
- Position Sizing: Traders might adjust their positions based on the participation level of different market caps in a trend.
- Risk Assessment: Discrepancies between the ADL and cap-weighted indices can signal potential risks and inform stop-loss strategies.
4.3. False Signals and Noise
False signals and noise are inherent challenges when interpreting the Advance Decline Line (ADL). Traders must discern between genuine market trends and misleading indicators that could result in erroneous trading decisions.
False Signals: False signals occur when the ADL suggests a market trend that does not materialize. For instance, a bearish divergence in the ADL may not always precede a market downturn if the divergence is caused by temporary factors unrelated to the broader market sentiment.
Noise: Market noise refers to random fluctuations that can affect the ADL. Such noise may arise from short-term events that do not impact the long-term market trend but can cause temporary distortions in the ADL readings.
Identifying False Signals and Noise:
| Type | Characteristics | Impact on ADL |
|---|---|---|
| False Signals | Suggests nonexistent trends | Misleads on market direction |
| Noise | Short-term, random fluctuations | Causes temporary distortions |
Traders employ various methods to filter out false signals and noise:
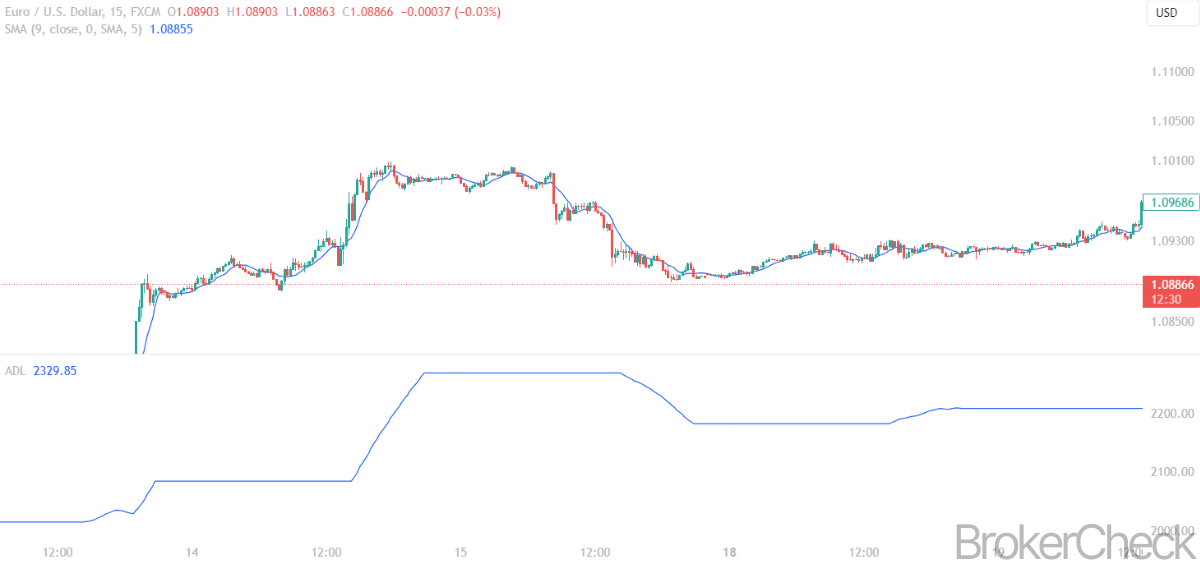
- Moving Averages: Applying a moving average to the ADL can smooth out short-term fluctuations and highlight more sustained trends.
- Confirmation with Other Indicators: Using additional technical indicators to confirm ADL signals can reduce the likelihood of acting on false information.
- Fundamental Analysis Corroboration: Aligning technical signals with fundamental market changes can provide a more reliable basis for trading decisions.
Mitigating the Impact of False Signals and Noise:
- Patience: Waiting for additional confirmation before acting on ADL signals can prevent premature trades.
- Diversification: Spreading risk across different assets can shield against the impact of false signals on a single position.
- Risk Management: Employing stop-loss orders and position sizing based on the confidence level of ADL signals can control potential losses.
Traders acknowledge that the ADL, while insightful, is not infallible. It is essential to use it as part of a comprehensive trading strategy that accounts for the possibility of false signals and noise, ensuring a disciplined approach to market analysis.
5. How to Incorporate the Advance Decline Line in Trading Strategies?
Incorporating the Advance Decline Line (ADL) into trading strategies involves a multifaceted approach that leverages the indicator’s strengths while compensating for its weaknesses. Traders can apply the ADL in several contexts to enhance their market analysis and decision-making process.
Combining with Other Indicators: The ADL should be used in conjunction with other technical indicators to confirm trends and signals. For example, combining the ADL with moving averages can help smooth out short-term volatility and provide a clearer view of the market’s direction. Volume-based indicators, such as the On-Balance Volume (OBV), can complement the ADL by confirming the breadth of participation in a trend.
Timing Entries and Exits: The ADL can be instrumental in timing market entry and exit points. A rising ADL in conjunction with a rising market index may indicate a strong trend, suggesting a viable entry point. Conversely, divergences between the ADL and market indices can signal potential reversals, prompting traders to consider exit strategies or tighten stop-loss orders.
Risk Management Techniques: Traders can use the ADL to manage risk by identifying underlying market strength or weakness not immediately apparent from price action alone. By assessing the breadth of market movements, traders can adjust position sizes or apply hedging strategies to mitigate risk.
ADL Application in Trading:
- Confirmation: Use the ADL to confirm the strength and breadth of market trends.
- Divergence Analysis: Watch for divergences between the ADL and market indices for early signs of trend reversals.
- Risk Adjustment: Adjust risk levels based on the depth of market participation as indicated by the ADL.
In practice, traders should monitor the ADL for consistency with other market indicators and be prepared to adjust their strategies based on the insights it provides. While the ADL is a powerful tool for gauging market breadth, it is most effective when used as part of a diversified analytical framework.
5.1. Combining with Other Indicators
Combining the Advance Decline Line (ADL) with other indicators enriches trading strategies and provides a multi-dimensional view of market conditions. Traders often incorporate momentum oscillators, trend-following tools, and volume indicators to validate ADL signals and enhance the reliability of their analyses.
Momentum Oscillators: These include the Relative Strength Index (RSI) and the Stochastic Oscillator, which help identify overbought or oversold conditions. When the ADL shows a divergence and the RSI or Stochastic indicates overbought or oversold levels, it may reinforce the likelihood of a trend reversal.
Trend-Following Tools: Moving averages are key trend-following indicators used alongside the ADL. A moving average applied to the ADL can smooth out fluctuations and highlight the underlying trend. The convergence or divergence of the ADL with a moving average can signal trend strength or weakness.
Volume Indicators: The On-Balance Volume (OBV) and Volume-Price Trend (VPT) indicators measure trading volume in relation to price movements. When the ADL is rising and volume indicators confirm an increase in volume, it suggests a robust trend with broad market participation.
Indicator Synergy:
| Indicator Type | Purpose | Synergy with ADL |
|---|---|---|
| Momentum Oscillators | Identify market extremes | Reinforce ADL divergences |
| Trend-Following Tools | Confirm trend direction | Smooth out ADL trend lines |
| Volume Indicators | Validate trend strength | Confirm breadth of participation |
By integrating the ADL with these complementary tools, traders can discern genuine market trends from false signals, enhancing the efficacy of their decision-making. The combined use of indicators also aids in pinpointing optimal entry and exit points, ensuring that traders are aligned with the prevailing market sentiment.
Strategic Combination of Indicators:
- Convergence/Divergence: Look for confirmation between the ADL and other indicators to validate market moves.
- Volume Confirmation: Cross-check ADL trends with volume indicators to ensure that price movements are supported by trading activity.
- Momentum Confirmation: Use momentum oscillators to understand market sentiment and potential reversal points in conjunction with ADL analysis.
Traders must remember that no single indicator is foolproof. A holistic approach, where the ADL is part of an ensemble of analytical tools, is essential for navigating complex market environments and executing trades with confidence.
5.2. Timing Entries and Exits
Timing entries and exits with precision is a cornerstone of successful trading, and the Advance Decline Line (ADL) can play a pivotal role in this endeavor. By analyzing the ADL, traders gain insights into the participation level of stocks in a market trend, which can inform both entry and exit strategies.
When considering an entry point, a trader might look for an ADL that is trending upwards alongside a rising market index. This alignment suggests a broad-based support for the uptrend, potentially validating a long position. However, a rising ADL in the face of a stagnant or falling market index could signal a weakening trend and warrant caution.
Exit strategies can similarly benefit from ADL analysis. A declining ADL may serve as an early warning sign of diminishing market breadth, prompting traders to secure profits or tighten stop-loss orders. Additionally, a bearish divergence—where the market index continues to climb while the ADL starts to decline—could foreshadow an impending trend reversal, signaling a potential exit.
Timing Entry and Exit Using ADL:
| Market Condition | ADL Trend | Action Point |
|---|---|---|
| Confirming Uptrend | Rising | Potential Entry |
| Weakening Uptrend | Falling | Consider Exit |
| Bearish Divergence | Declining | Possible Exit |
Traders should also be vigilant for false positives—situations where the ADL suggests a strong trend that may not materialize. This necessitates a layered approach where the ADL is not the sole determinant of trading decisions but is corroborated by other technical indicators and market analysis.
To mitigate the risks of mis-timing based on the ADL, traders often employ risk management techniques. These may include setting stop-loss orders at strategic levels to limit potential losses or adjusting position sizes to reflect the strength of the ADL signal.
Risk Management with ADL:
- Stop-Loss Orders: Set based on ADL trend reversals to minimize losses.
- Position Sizing: Adjust according to the conviction provided by ADL signals.
5.3. Risk Management Techniques
Risk management in trading involves a set of strategies designed to minimize potential losses while maximizing potential gains. The Advance Decline Line (ADL), as a market breadth indicator, plays a vital role in identifying underlying market strength or weakness, which can be crucial for risk management. Here are several risk management techniques using the ADL:
Position Sizing: Traders can use the ADL to gauge the strength of market movements and adjust their position sizes accordingly. A strong ADL trend may justify larger positions, while a weak or divergent ADL trend might signal the need for smaller positions to mitigate risk.
Stop-Loss Orders: The ADL can inform the placement of stop-loss orders. For example, if the ADL begins to diverge negatively from the market index, a trader might place a stop-loss order to exit a position before the potential reversal materializes, thus protecting capital.
Hedging: In the presence of an uncertain ADL trend, traders may employ hedging strategies, such as options contracts, to protect their portfolio against adverse price movements. If the ADL suggests a weakening trend, a trader might purchase put options as a form of insurance.
Diversification: A rising ADL indicates broad market participation, which may reduce the need for diversification. However, when the ADL signals narrow market participation, traders may seek to diversify their holdings to reduce the risk associated with a potential downturn in a few stocks or sectors.
Risk-Reward Ratios: Traders can use the ADL to assess the market’s breadth, which can impact the risk-reward ratio of a trade. A favorable ADL reading might indicate a higher potential reward compared to the risk, leading to more aggressive trading strategies.
Risk Management Techniques Using ADL:
| Technique | Description | Application |
|---|---|---|
| Position Sizing | Adjust position based on ADL strength | Increase size with strong ADL trend |
| Stop-Loss Orders | Set orders based on ADL reversals | Exit before potential reversals |
| Hedging | Use derivatives to offset potential losses | Purchase put options during ADL weakness |
| Diversification | Spread risk across assets | Diversify holdings when ADL participation is narrow |
| Risk-Reward Ratios | Evaluate potential gains against potential losses | More aggressive strategies with favorable ADL |
By integrating the ADL into these risk management techniques, traders can make more informed decisions that align with the current market environment. The ADL serves as a guide to the underlying health of the market, allowing traders to adjust their strategies to either capitalize on strong trends or protect against potential downturns.