1. Overview of Bollinger Bands Width
1.1 Introduction to Bollinger Bands
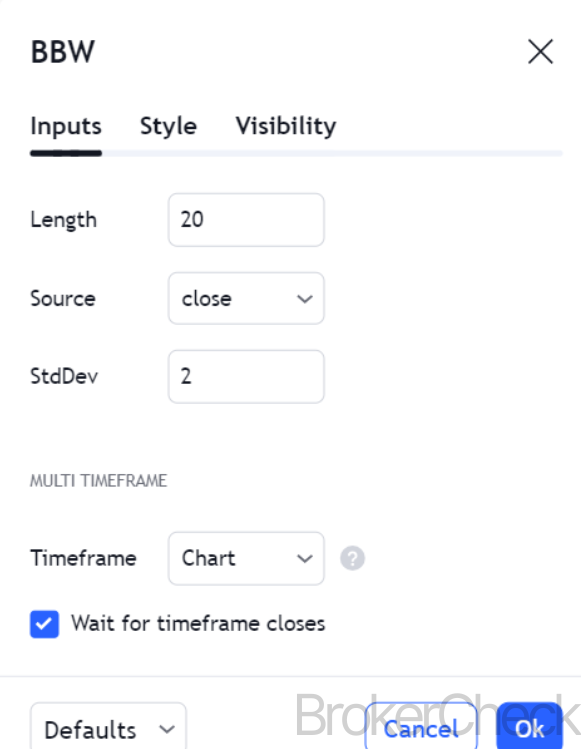
Bollinger Bands are a popular technical analysis tool developed by John Bollinger in the 1980s. This tool is used primarily to measure market volatility and identify overbought or oversold conditions in the trading of financial instruments. Bollinger Bands consist of three lines: the middle line is a simple moving average (SMA), typically over 20 periods, and the upper and lower bands are standard deviations above and below this moving average.
1.2 Definition and Purpose of Bollinger Bands Width
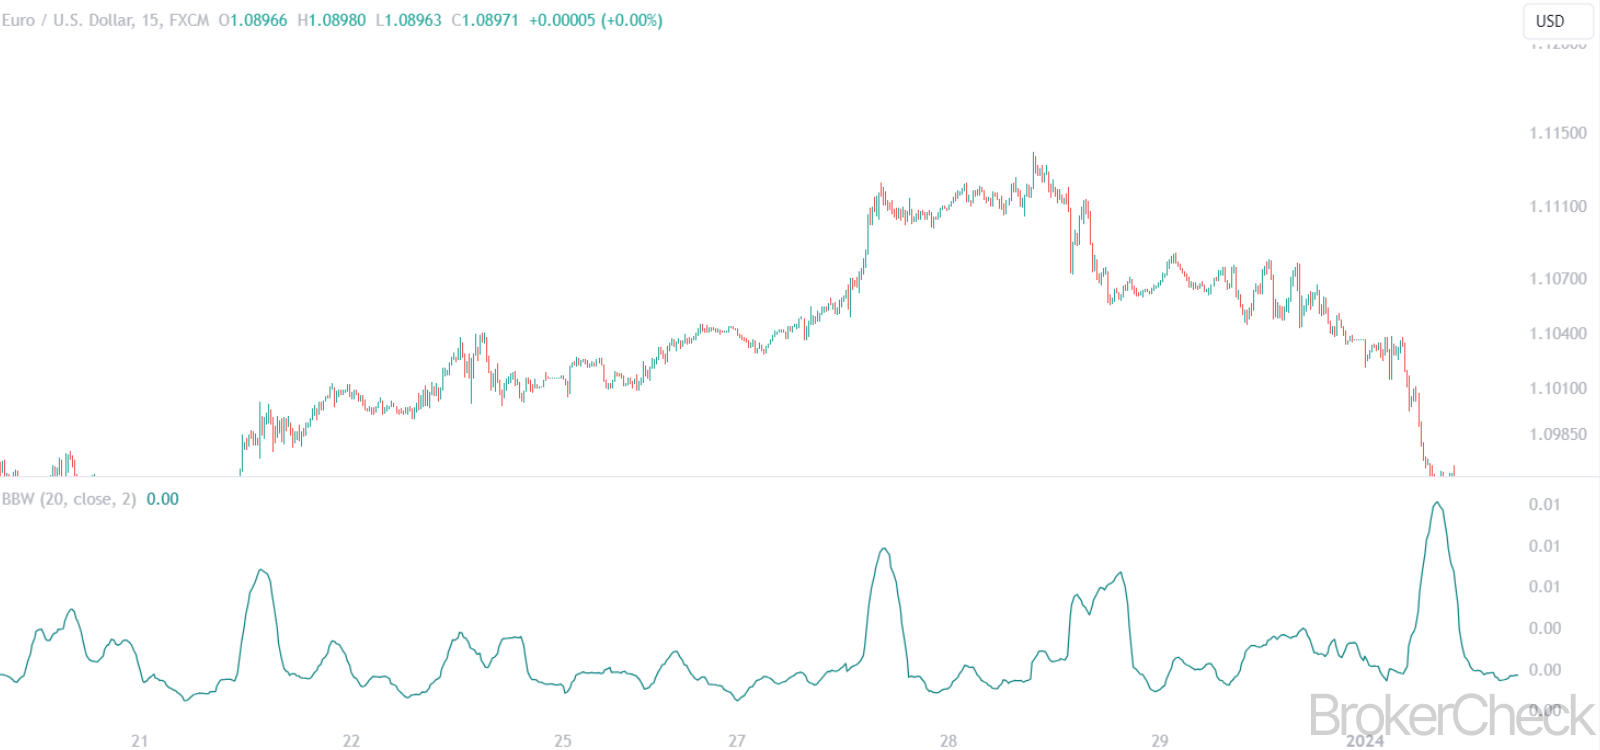
Bollinger Bands Width (BBW) is a derived indicator that quantifies the distance, or width, between the upper and lower Bollinger Bands. The BBW is crucial for traders as it provides a numerical value to the concept of market volatility. A wider band indicates higher market volatility, while a narrower band signifies lower volatility. The Bollinger Bands Width helps traders in several ways:
- Identifying Volatility Shifts: A significant change in the width of the bands can signal a change in market volatility, often preceding significant price movements.
- Trend Analysis: Periods of low volatility, indicated by narrow bands, often occur during consolidations in a market trend, potentially leading to a breakout.
- Market Extremes Identification: In some market conditions, extremely wide or narrow bands can indicate overextended price movements, which may reverse or consolidate.
| Aspect | Description |
|---|---|
| Origin | Developed by John Bollinger in the 1980s. |
| Components | Upper and Lower Bands (standard deviations), Middle Line (SMA). |
| BBW Definition | Measures the distance between the upper and lower Bollinger Bands. |
| Purpose | Indicates market volatility, helps in trend analysis and identifying market extremes. |
| Usage | Identifying volatility shifts, analyzing market trends, signaling potential price movements. |
2. Calculation Process of Bollinger Bands Width
2.1 Formula Explanation
Bollinger Bands Width (BBW) is calculated using a relatively straightforward formula. The width is determined by subtracting the value of the lower Bollinger Band from the upper Bollinger Band. The formula is as follows:
BBW=Upper Bollinger Band−Lower Bollinger Band
Where:
- The Upper Bollinger Band is calculated as: Middle Band+(Standard Deviation×2).
- The Lower Bollinger Band is calculated as: Middle Band−(Standard Deviation×2).
- The Middle Band is typically a 20-period Simple Moving Average (SMA).
- Standard Deviation is calculated based on the same 20 periods used for the SMA.
2.2 Step-by-Step Calculation
To illustrate the calculation of Bollinger Bands Width, let’s consider a step-by-step example:
Calculate the Middle Band (SMA):
- Add up the closing prices for the last 20 periods.
- Divide this sum by 20.
2. Calculate the Standard Deviation:
- Find the difference between each period’s closing price and the Middle Band.
- Square these differences.
- Sum these squared differences.
- Divide this sum by the number of periods (20 in this case).
- Take the square root of this result.
3. Calculate the Upper and Lower Bands:
- Upper Band: Add (Standard Deviation × 2) to the Middle Band.
- Lower Band: Subtract (Standard Deviation × 2) from the Middle Band.
3. Determine the Bollinger Bands Width:
- Subtract the Lower Band value from the Upper Band value.
This calculation process highlights the dynamic nature of Bollinger Bands Width, as it fluctuates with changes in price volatility. The standard deviation component ensures that the bands expand when the market is volatile and contract during less volatile periods.
| Step | Process |
|---|---|
| 1 | Calculate the Middle Band (20-period SMA). |
| 2 | Calculate the Standard Deviation based on the same 20 periods. |
| 3 | Determine the Upper and Lower Bands (Middle Band ± Standard Deviation × 2). |
| 4 | Calculate the BBW (Upper Band – Lower Band). |
3. Optimal Values for Setup in Different Timeframes
3.1 Short-term Trading
For short-term trading, such as day trading or scalping, traders typically use Bollinger Bands Width with a shorter moving average period and a lower standard deviation multiplier. This setup allows the bands to react more quickly to price changes, which is crucial in a fast-paced trading environment.
Optimal Setup:
- Moving Average Period: 10-15 periods.
- Standard Deviation Multiplier: 1 to 1.5.
- Interpretation: Narrower bands indicate low short-term volatility, suggesting consolidation or a pending price breakout. Wider bands indicate higher volatility, often associated with strong price movements.
3.2 Medium-term Trading
Medium-term traders, including swing traders, often prefer a balance between sensitivity and lag in their indicators. A standard setup for Bollinger Bands Width works well in this timeframe.
Optimal Setup:
- Moving Average Period: 20 periods (standard).
- Standard Deviation Multiplier: 2 (standard).
- Interpretation: The standard settings provide a balanced view of medium-term market volatility. Sudden increases in band width can signal the start of new trends or the strengthening of existing ones.
3.3 Long-term Trading
For long-term trading, such as position trading, a longer moving average period and a higher standard deviation multiplier are often used. This setup reduces the noise and smoothens the indicator, making it more suitable for identifying long-term trends and volatility shifts.
Optimal Setup:
- Moving Average Period: 50-100 periods.
- Standard Deviation Multiplier: 2.5 to 3.
- Interpretation: In this setup, a gradual increase in band width may indicate a steady increase in long-term market volatility, while a decrease suggests a stabilizing or less volatile market.
| Timeframe | Moving Average Period | Standard Deviation Multiplier | Interpretation |
|---|---|---|---|
| Short-term Trading | 10-15 periods | 1 to 1.5 | Quick reaction to market changes, useful for identifying short-term volatility and potential breakouts. |
| Medium-term Trading | 20 periods (standard) | 2 (standard) | Balanced sensitivity, suitable for swing trading and general trend analysis. |
| Long-term Trading | 50-100 periods | 2.5 to 3 | Smoothens out short-term fluctuations, ideal for long-term trend and volatility analysis. |
4. Interpretation of Bollinger Bands Width
4.1 Understanding Bollinger Bands Width
The Bollinger Bands Width (BBW) is a technical analysis tool derived from the Bollinger Bands, which itself is a volatility indicator. BBW specifically measures the difference between the upper and lower Bollinger Bands. This metric is crucial for traders because it provides insight into market volatility. A wider band indicates high volatility, while a narrower band suggests low volatility.
4.2 Reading the Signals
- High BBW Values: When the BBW is high, it indicates that there is significant distance between the upper and lower Bollinger Bands. This scenario often occurs during periods of high market volatility, such as around major news events or economic releases. Traders interpret high BBW values as a potential precursor to market consolidation or a reversal, as markets cannot sustain high levels of volatility indefinitely.
- Low BBW Values: Conversely, a low BBW value signifies that the market is in a period of low volatility, with the upper and lower bands close together. This condition is often associated with the consolidation phase of the market, where price movements are limited. Traders might view this as a period of accumulation or distribution before a significant price movement.
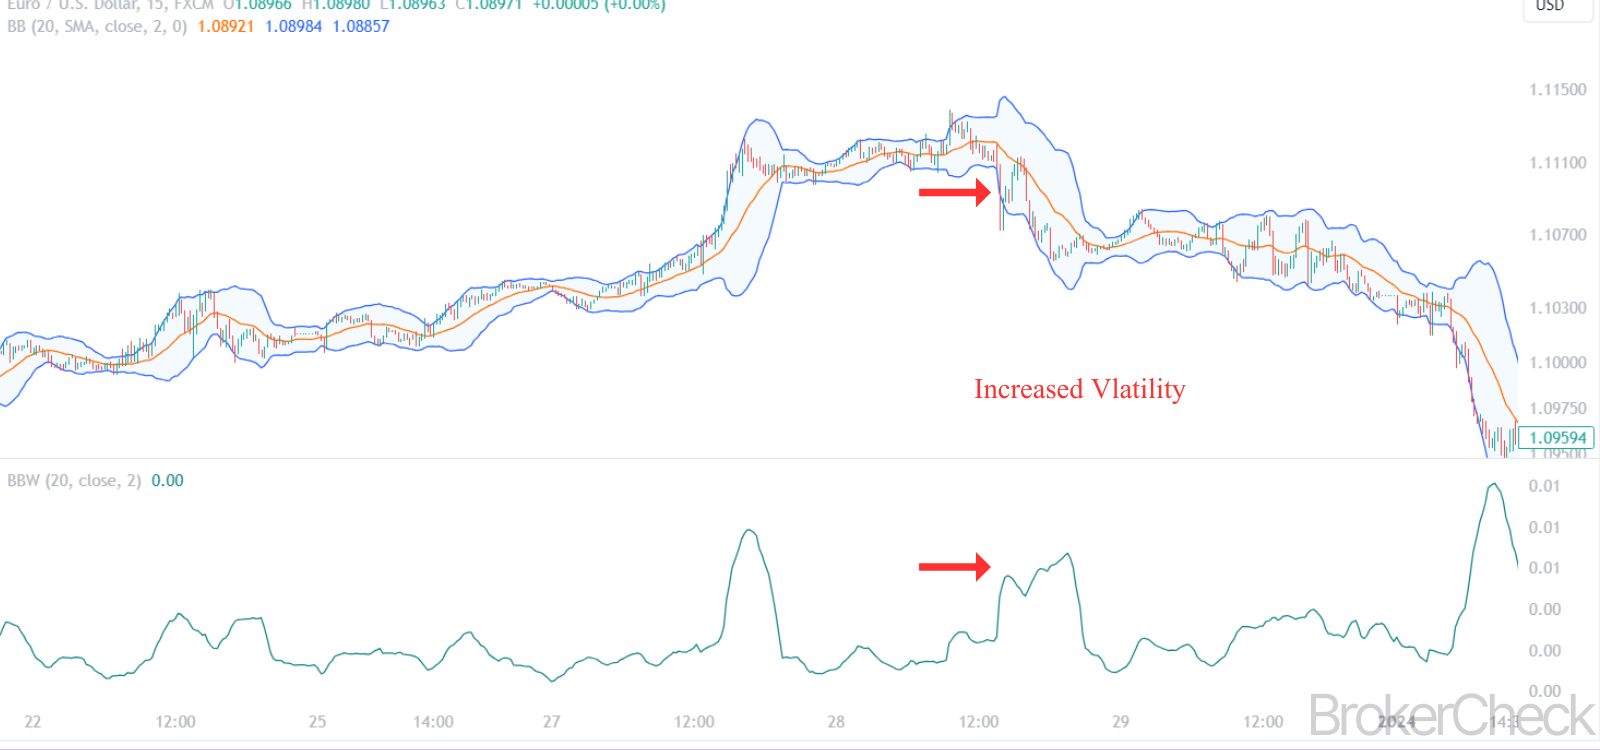
- Increasing BBW: An increasing BBW value can signal that volatility is rising. Traders often watch for this change as a precursor to potential breakouts. A gradual increase might indicate a steady increase in market interest and participation.
- Decreasing BBW: A decreasing BBW, on the other hand, suggests a decline in market volatility. This scenario might occur after a significant price move as the market begins to settle.
4.3 Volatility Cycles
Understanding volatility cycles is key to interpreting BBW effectively. Markets often go through periods of high volatility (expansion) followed by low volatility (contraction). The BBW helps in identifying these phases. Skilled traders use this information to adjust their trading strategies accordingly, such as using range-bound strategies during low volatility and breakout strategies during high volatility periods.
4.4 Contextual Importance
The interpretation of BBW should always be done in the context of the prevailing market conditions and in conjunction with other indicators. For instance, during a strong uptrend or downtrend, an expanding BBW might simply affirm the strength of the trend, rather than suggesting a reversal.
4.5 Example Scenario
Imagine a scenario where the BBW is at a historically low level. This situation could indicate that the market is overly compressed and might be due for a breakout. If the BBW starts to expand rapidly after this period, it could be a signal for a significant price movement in either direction.
| BBW Condition | Market Implication | Potential Trader Action |
|---|---|---|
| High BBW | High volatility, possible market reversal or consolidation | Monitor for potential reversal signals, consider protective measures like stop-loss orders |
| Low BBW | Low volatility, market consolidation | Look for accumulation or distribution, prepare for breakout |
| Increasing BBW | Rising volatility, possible start of a trend or breakout | Watch for breakout signals, adjust strategies to capture potential trends |
| Decreasing BBW | Declining volatility, settling market after a move | Possible range-bound trading, reduce expectations of large price movements |
5. Combining Bollinger Bands Width with Other Indicators
5.1 Synergy with Other Technical Tools
While Bollinger Bands Width (BBW) is a powerful indicator on its own, its effectiveness can be significantly enhanced when used in combination with other technical analysis tools. This multi-indicator approach provides a more holistic view of the market, aiding in more accurate and nuanced trading decisions.
5.2 Combining with Moving Averages
- Simple Moving Average (SMA): A common strategy is to use BBW alongside a Simple Moving Average. For example, a trader might look for a narrowing BBW (indicating low volatility) that coincides with the price consolidating around a key SMA level. This can often precede a breakout.
- Exponential Moving Average (EMA): The use of EMA with BBW can help in identifying the strength of a trend. For instance, if the BBW is expanding and the price is consistently above a short-term EMA, it may suggest a strong uptrend.
5.3 Incorporating Momentum Indicators
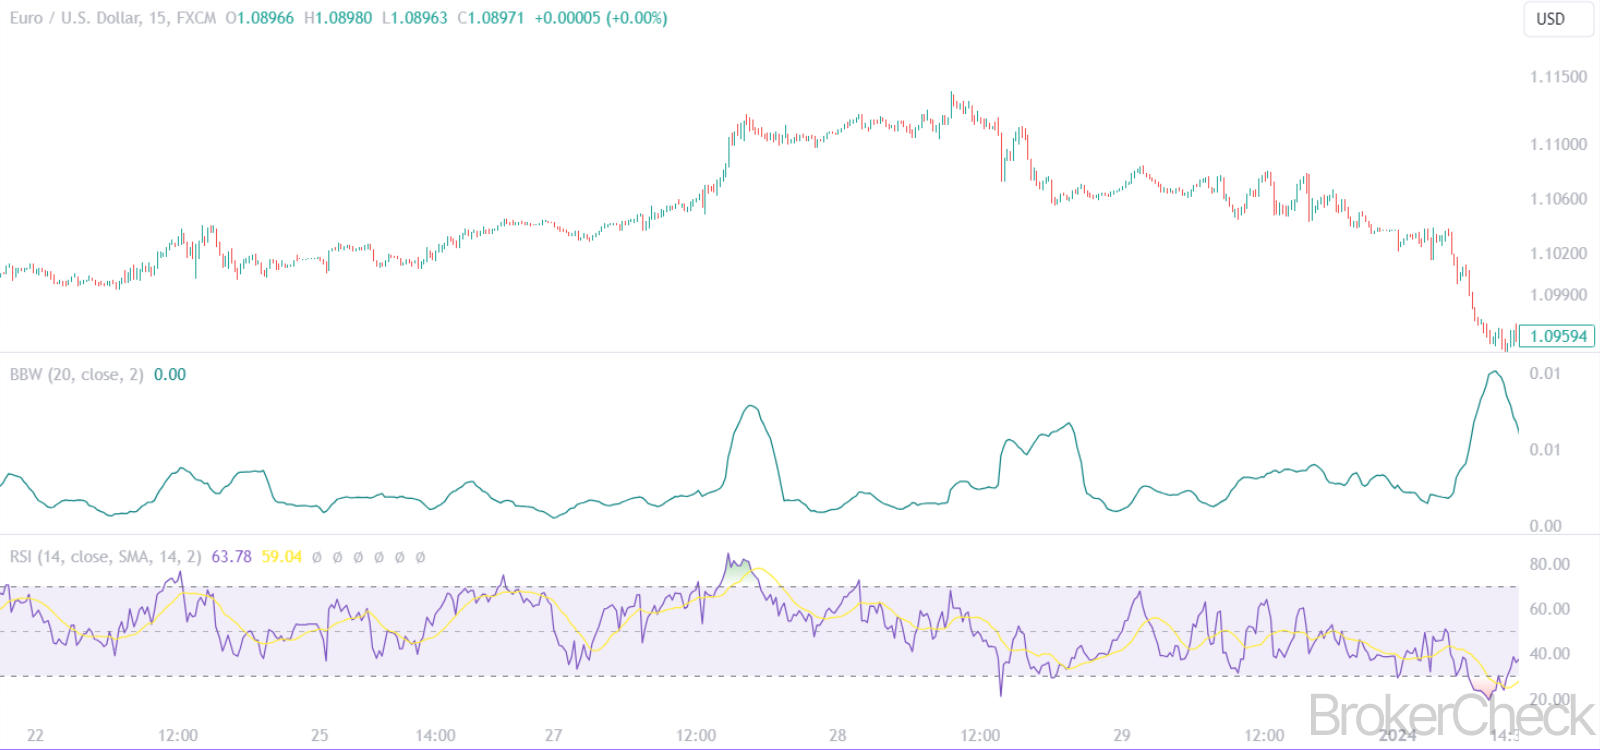
- Relative Strength Index (RSI): The RSI can be used to confirm signals suggested by the BBW. For instance, if the BBW is expanding and the RSI shows overbought conditions, it could indicate a potential reversal in an uptrend.
- Moving Average Convergence Divergence (MACD): MACD, being a trend-following momentum indicator, can complement BBW by confirming the start of new trends or the continuation of existing ones. When MACD and BBW signals align, the probability of a successful trade can increase.
5.4 Volume Indicators
Volume plays a crucial role in validating the signals provided by BBW. An increase in volume accompanying an expanding BBW can confirm the strength of a breakout. Conversely, a breakout with low volume may not sustain, indicating a false signal.
5.5 Oscillators for Range-Bound Markets
In low volatility periods indicated by a narrow BBW, oscillators like the Stochastic Oscillator or the Commodity Channel Index (CCI) can be particularly effective. These tools help identify overbought or oversold conditions within a range, providing trade opportunities in a sideways market.
5.6 Example Trading Strategy
Consider a scenario where the BBW is beginning to expand after a period of contraction, indicating potential increased volatility. A trader could use RSI to check for overbought or oversold conditions. Simultaneously, looking at the MACD for confirmation of a trend change can provide a more robust signal. This multi-indicator approach reduces the likelihood of false signals.
| Indicator Combination | Purpose | Usage with BBW |
|---|---|---|
| BBW + SMA/EMA | Trend Confirmation | Identify potential breakouts around key moving average levels |
| BBW + RSI | Momentum Confirmation | Use RSI to confirm overbought/oversold conditions during volatility changes |
| BBW + MACD | Trend and Momentum Confirmation | Confirm the beginning or continuation of trends |
| BBW + Volume Indicators | Strength of Move | Confirm breakout strength with volume analysis |
| BBW + Oscillators (e.g., Stochastic, CCI) | Trading in Ranges | Identify trade entries and exits in range-bound markets |
6. Risk Management with Bollinger Bands Width
6.1 The Role of BBW in Risk Management
Risk management is a critical aspect of trading, and the Bollinger Bands Width (BBW) can play a significant role in it. Although BBW is primarily a volatility indicator, understanding its implications helps traders manage risk more effectively by adjusting their strategies according to the prevailing market conditions.
6.2 Setting Stop-Loss and Take-Profit
- Stop-Loss Orders: When using BBW, stop-loss orders can be strategically placed. For instance, in a high volatility environment indicated by a wide BBW, wider stop-loss margins might be necessary to avoid being stopped out prematurely.
- Take-Profit Orders: Conversely, in low volatility scenarios (narrow BBW), traders might set closer take-profit targets, anticipating smaller price movements.
6.3 Position Sizing
Position sizing can be adjusted based on the BBW readings. During periods of high volatility, it might be prudent to reduce position sizes to mitigate risk, while in times of low volatility, traders might be more comfortable with larger positions.
6.4 Adapting Trading Strategies
- High Volatility (Wide BBW): In such periods, breakout strategies might be more effective. However, the risk of false breakouts also increases, so traders should use additional confirmation signals (like volume spikes or momentum indicator confirmations).
- Low Volatility (Narrow BBW): In these phases, range-bound strategies are often more suitable. Traders could look for oscillating patterns within the bands and trade between support and resistance levels.
6.5 Using Trailing Stops
Trailing stops can be particularly useful with BBW. As the bands widen and the market becomes more volatile, trailing stops can help lock in profits while allowing room for the trade to breathe.
6.6 Balancing Risk and Reward
An essential aspect of using BBW for risk management is balancing risk and reward. This involves understanding the potential volatility and adjusting the risk-reward ratio accordingly. For instance, in a high volatility environment, seeking a higher reward to compensate for the increased risk can be a rational approach.
6.7 Example Scenario
Suppose a trader enters a long position during a period of increasing volatility (expanding BBW). They might place a stop-loss order below the lower Bollinger Band and set a trailing stop to protect profits if the price continues to rise. The trader also adjusts the position size to account for the increased risk due to higher volatility.
| BBW Condition | Risk Management Strategy | Implementation |
|---|---|---|
| High BBW (Wide Bands) | Wider Stop-Loss Margins, Reduced Position Size | Adjust stop-loss to accommodate volatility, manage trade size to control risk |
| Low BBW (Narrow Bands) | Closer Take-Profit Targets, Larger Position Size | Set take-profit within a smaller range, increase position size if volatility is low |
| Changing BBW (Expanding or Contracting) | Use of Trailing Stops | Implement trailing stops to secure profits while allowing for market movement |
| Balancing Risk and Reward | Adjust Risk-Reward Ratio | Seek higher reward in high volatility and vice versa |
7. Advantages and Limitations of Bollinger Bands Width
7.1 Advantages of Bollinger Bands Width
- Indication of Market Volatility: BBW is an excellent tool for gauging market volatility. Its ability to measure the distance between the upper and lower Bollinger Bands helps traders understand the volatility landscape, which is crucial for strategy selection.
- Identification of Market Phases: BBW aids in identifying different market phases, such as high volatility (trending or breakout markets) and low volatility (range-bound or consolidating markets).
- Flexibility Across Timeframes: BBW can be applied to various timeframes, making it versatile for different trading styles, from day trading to swing and position trading.
- Compatibility with Other Indicators: BBW works well in conjunction with other technical indicators, enhancing its effectiveness in forming a comprehensive trading strategy.
- Utility in Risk Management: By providing insights into market volatility, BBW assists traders in implementing effective risk management strategies, such as adjusting stop-loss orders and position sizes.
7.2 Limitations of Bollinger Bands Width
- Lagging Nature: As with many technical indicators, BBW is lagging. It relies on past price data, meaning it may not always predict future market movements accurately.
- Risk of False Signals: During highly volatile market conditions, BBW may expand, suggesting a breakout or strong trend, which could turn out to be false signals.
- Context-Dependent Interpretation: The interpretation of BBW signals can vary depending on market context and other indicators. It requires a nuanced understanding and should not be used in isolation for decision-making.
- No Directional Bias: BBW does not provide information about the direction of the market movement. It only indicates the extent of volatility.
- Subject to Market Noise: In shorter timeframes, BBW may be more susceptible to market noise, leading to misleading indications of volatility changes.
| Aspect | Advantages | Limitations |
|---|---|---|
| Market Volatility | Excellent for gauging volatility levels | Lagging, may not predict future movements |
| Market Phases | Identifies high and low volatility phases | Can give false signals during extreme volatility |
| Timeframe Flexibility | Useful across various timeframes | Interpretation varies by timeframe; more noise in shorter ones |
| Compatibility | Works well with other indicators | Requires context-specific interpretation |
| Risk Management | Aids in setting stop-loss and position sizing | Does not indicate market direction |