
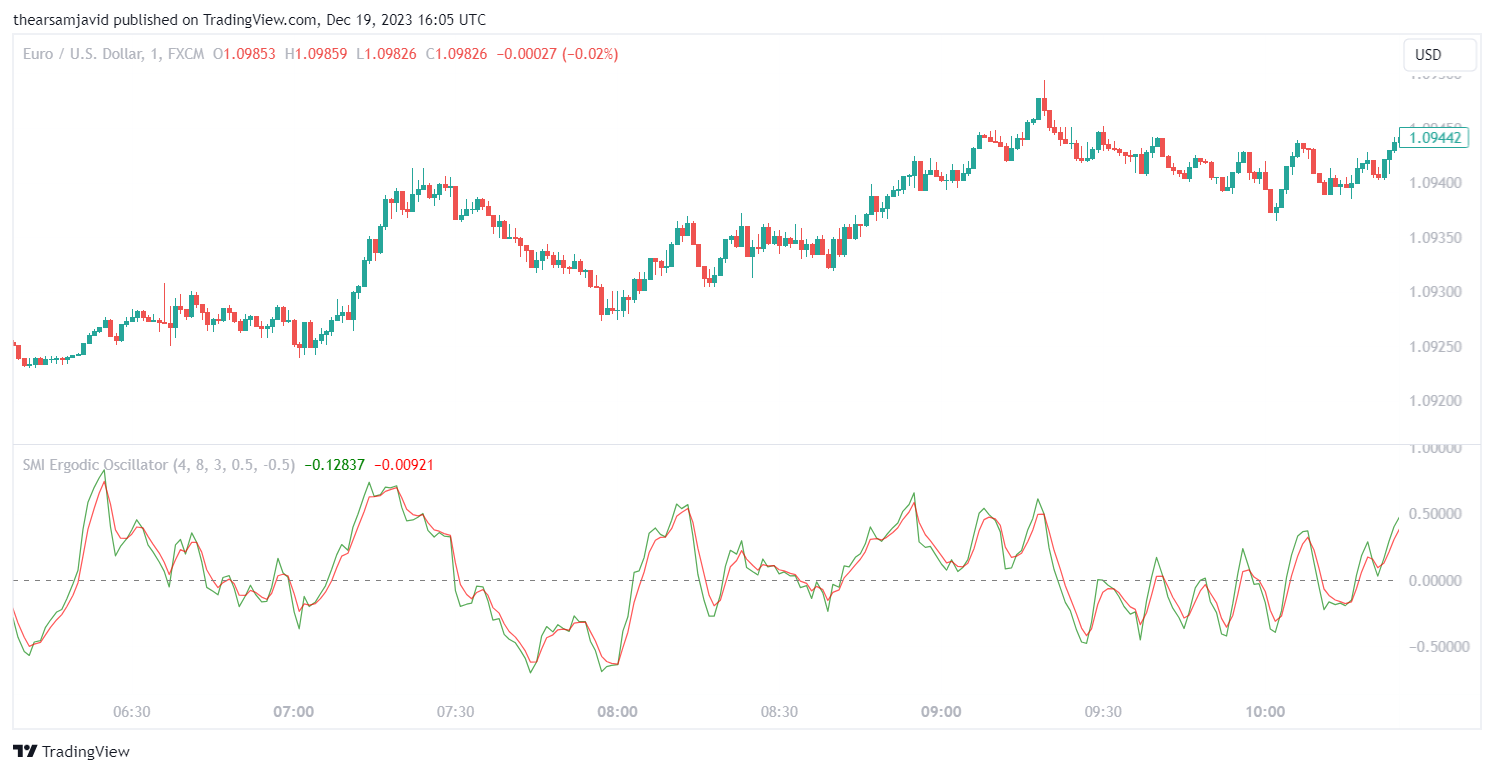
1. What is the SMI Ergodic Oscillator?
The SMI Ergodic Oscillator is a technical analysis tool used by traders to identify trend direction and strength. It operates on the premise of comparing an asset’s closing price to its price range over a given period. The oscillator is a refinement of the True Strength Index (TSI), designed to reduce volatility and increase sensitivity to market changes.
One of the unique aspects of the SMI Ergodic Oscillator is its focus on the cyclical nature of markets. Unlike other oscillators that may only signal overbought or oversold conditions, the SMI Ergodic aims to capture the rhythm of the market, providing insights into both the velocity and magnitude of price movements.
Traders favor the SMI Ergodic Oscillator for its versatility and ease of interpretation. It can be applied to any market or time frame, making it a flexible option for day traders, swing traders, and long-term investors alike. The oscillator is particularly useful in trending markets, helping to highlight potential entry and exit points through its clear signals.
2. How to Set Up the SMI Ergodic Oscillator in Your Trading Platform?
To set up the SMI Ergodic Oscillator on your trading platform, begin by locating the indicator in your platform’s library. This process may vary slightly depending on the software you use but generally involves a search within the indicator or analysis section. Once found, you can add it to your chart with a simple click or drag-and-drop action.
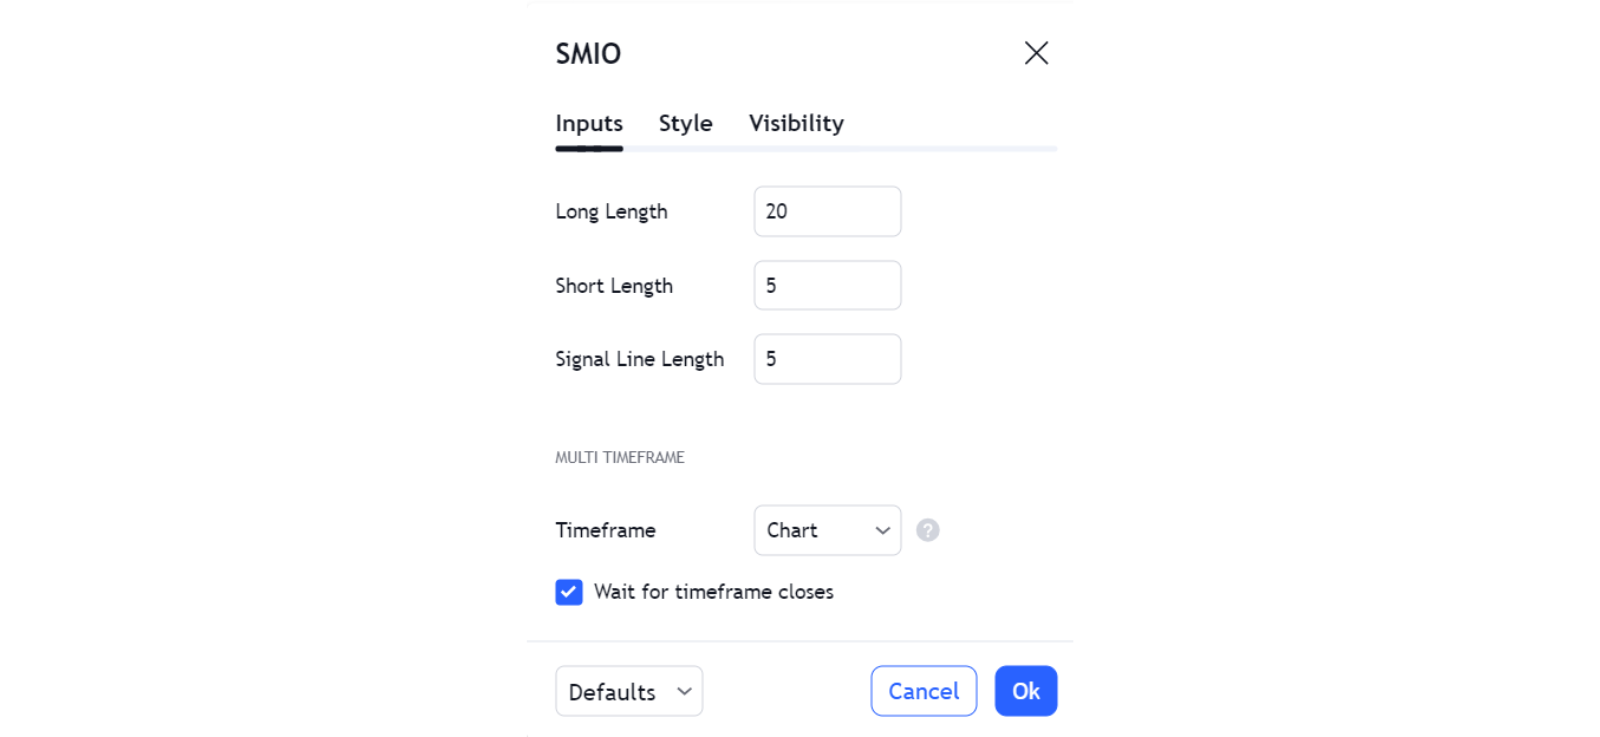
Upon adding the SMI Ergodic Oscillator, a settings window typically appears. This is where you can customize the parameters. The default settings are often sufficient for a standard analysis, but they can be adjusted to suit your specific trading strategy and the asset being traded. The two main parameters to consider adjusting are the time periods for the SMI Ergodic line and the Signal line.
Most platforms will allow you to change the visual aspects of the indicator, such as the colors and line thickness, enhancing readability against the price chart. It’s also possible to set up alerts based on the crossover of the SMI Ergodic and Signal lines, notifying you of potential trading opportunities.
For platforms that support it, you might also consider saving your configuration as a template. This allows you to quickly apply your customized SMI Ergodic Oscillator settings to any chart, streamlining your analysis process across different markets and timeframes.
| Step | Action |
|---|---|
| 1. Locate | Find the SMI Ergodic Oscillator in the indicator library. |
| 2. Add | Click or drag and drop the SMI Ergodic to your chart. |
| 3. Customize | Adjust the time periods and visual settings as needed. |
| 4. Set Alerts | Enable alerts for the SMI Ergodic and Signal line crossovers. |
| 5. Save Template | Preserve your settings for future use. |
By following these steps, you’ll have the SMI Ergodic Oscillator ready to inform your trading decisions, with the ability to quickly interpret market conditions and identify potential trend changes.
2.1. Selecting the Right Charting Software
Compatibility with SMI Ergodic Oscillator
When choosing charting software for trading, it’s critical to ensure that it supports the SMI Ergodic Oscillator. The software should allow for comprehensive customization of indicators, including the ability to adjust time periods and visual settings. This flexibility is essential for tailoring the tool to your specific trading strategy.
Availability of Alert Features
The capacity for setting up alerts for specific indicator conditions, such as the crossover of the SMI Ergodic and Signal lines, is a non-negotiable feature. Real-time alerts can significantly enhance your trading by providing timely notifications of potential trading opportunities, which is why the chosen platform must offer robust alert functionalities.
Template Saving Functionality
Efficiency in trading is paramount, and the ability to save templates of your indicator configurations can save time and ensure consistency when analyzing different securities. The charting software should allow you to preserve your settings, making it easy to apply them to any chart with a few clicks.
User Interface and Usability
A user-friendly interface that doesn’t compromise on advanced features is key. Traders should look for software that strikes a balance between sophistication and usability, ensuring that both novice and experienced traders can navigate the platform effectively.
Software Reputation and Support
Finally, consider the reputation of the charting software and the quality of customer support. A platform with a strong community and dedicated support can provide valuable assistance and resources for troubleshooting, updates, and tips on maximizing the use of the SMI Ergodic Oscillator.
2.2. Adjusting the SMI Ergodic Oscillator Settings
Customization of Indicator Parameters
The SMI Ergodic Oscillator’s effectiveness hinges on its customization capabilities. Traders should be able to adjust the oscillator’s settings to align with their specific trading strategies and market conditions. The two main parameters to focus on are the time period and the signal line smoothing.
For the time period, traders typically set a default value, but the ability to modify this allows for responsiveness to different market volatilities. A shorter period may be beneficial for day traders looking for quick signals, while a longer period could suit swing traders needing more significant trend confirmation.
Signal line smoothing is another adjustable element that can impact the sensitivity of the oscillator. A higher smoothing value will generate fewer signals, potentially reducing noise and false positives. Conversely, a lower value increases sensitivity, which may be useful in fast-moving markets to catch early trend changes.
| Parameter | Purpose | Typical Range |
|---|---|---|
| Time Period | Adjust responsiveness to market volatility | Short-term: 5-20 Long-term: 20-40 |
| Signal Line Smoothing | Control signal sensitivity | Low: 2-5 High: 5-10 |
Advanced users may delve into fine-tuning other settings such as the oscillator’s calculation method or applying different weighting to the data. These adjustments can further tailor the SMI Ergodic Oscillator to individual preferences and trading objectives.
Traders must backtest any changes to the oscillator settings, ensuring that the modified parameters provide a reliable edge in their trading approach. Most charting software will enable this testing within their platforms, allowing for an iterative process to find the optimal configuration.
2.3. Integrating with Other Technical Indicators
Combining SMI Ergodic Oscillator with Moving Averages
Integrating the SMI Ergodic Oscillator with Moving Averages can enhance trend confirmation. A common strategy is to use a 50-period Moving Average as a trend filter, buying when the SMI crosses above zero while the price is above the Moving Average, and selling when the opposite is true.
Utilizing SMI Ergodic Oscillator with Bollinger Bands
Bollinger Bands provide a dynamic perspective on volatility and price levels. When the SMI Ergodic Oscillator shows overbought or oversold conditions, traders look to the Bollinger Bands for potential entry or exit points, entering trades as price touches or crosses the bands in alignment with the SMI signals.
Synergy with Volume-Based Indicators
Volume-based indicators like the On-Balance-Volume (OBV) can be paired with the SMI Ergodic Oscillator to confirm the strength of a trend. An increasing OBV along with a positive SMI reading suggests strong buying pressure, while divergences between the two can signal potential reversals.
Enhancing Signals with Fibonacci Retracement Levels
Incorporating Fibonacci Retracement Levels can pinpoint potential support and resistance zones. Traders may look for SMI Ergodic Oscillator signals that coincide with a price approaching or retracting from key Fibonacci levels to validate the strength of a trend or a reversal.
| Technical Indicator | SMI Ergodic Oscillator Interaction |
|---|---|
| Moving Averages | Acts as a trend filter; SMI signals are considered more reliable when in the direction of the trend |
| Bollinger Bands | Provides context for SMI signals concerning volatility and price levels |
| Volume-Based Indicators | Confirms trend strength or potential reversals when analyzed alongside SMI signals |
| Fibonacci Retracement | Offers precise entry and exit points when SMI signals occur near key Fibonacci levels |
By integrating the SMI Ergodic Oscillator with these technical indicators, traders can construct a more robust and comprehensive trading system. It’s essential to observe how these indicators interact and complement the SMI signals to improve decision-making processes.
3. How to Use the SMI Ergodic Oscillator for Trade Entry and Exit?
Trade Entry Signals with SMI Ergodic Oscillator
To identify entry points using the SMI Ergodic Oscillator, traders should look for a crossover of the SMI lines. A bullish entry signal is typically generated when the SMI line crosses above the signal line, especially if this occurs above the zero line, indicating upward momentum. Conversely, a bearish entry signal occurs when the SMI line crosses below the signal line below the zero line, suggesting downward momentum.
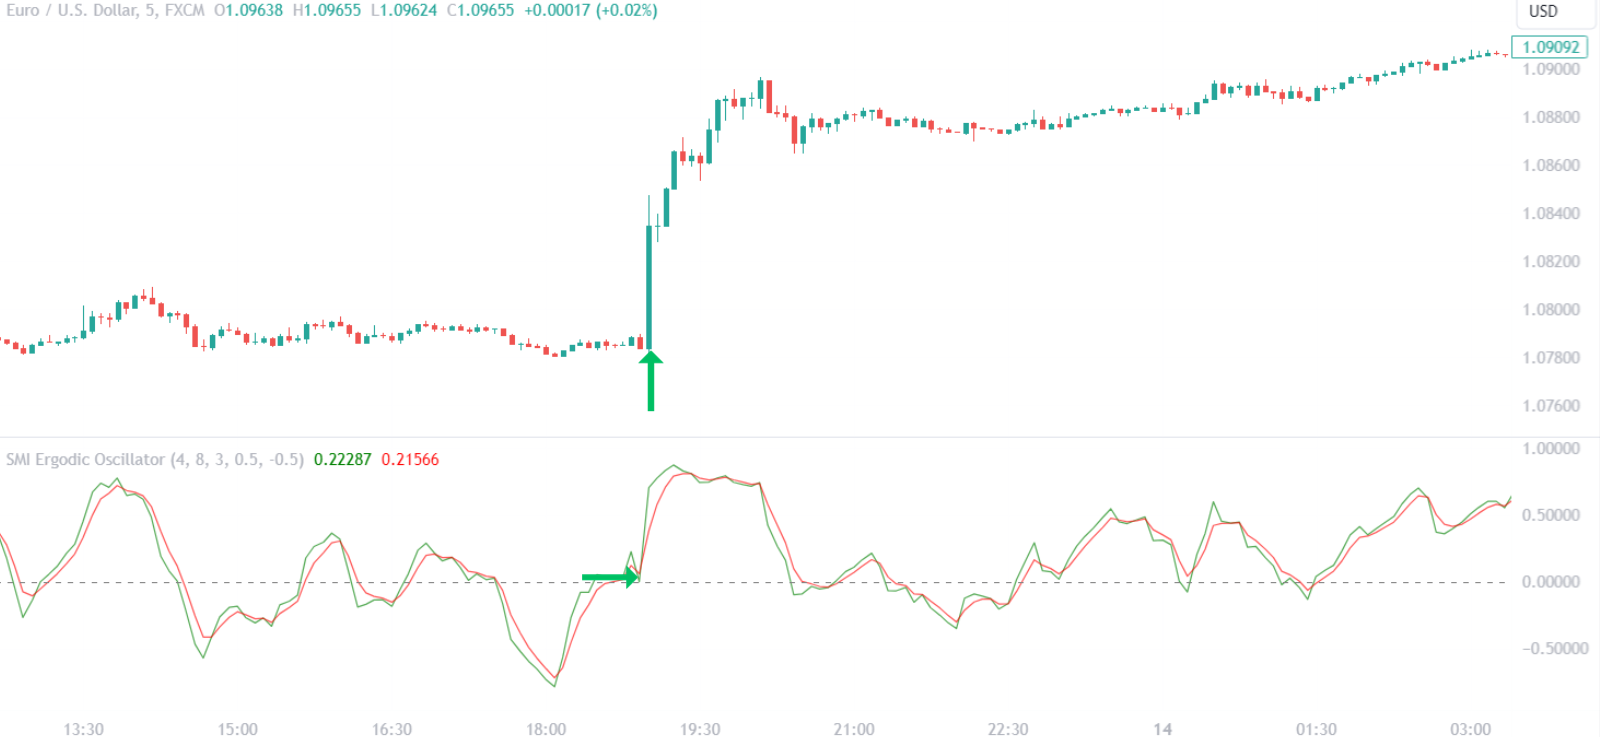
When showing high volume on a bullish crossover, volume-based indicators can confirm the strength of the entry signal. Similarly, a bearish crossover with high volume might indicate strong selling pressure. It is prudent to enter trades when the SMI crossover aligns with the general trend as indicated by moving averages.
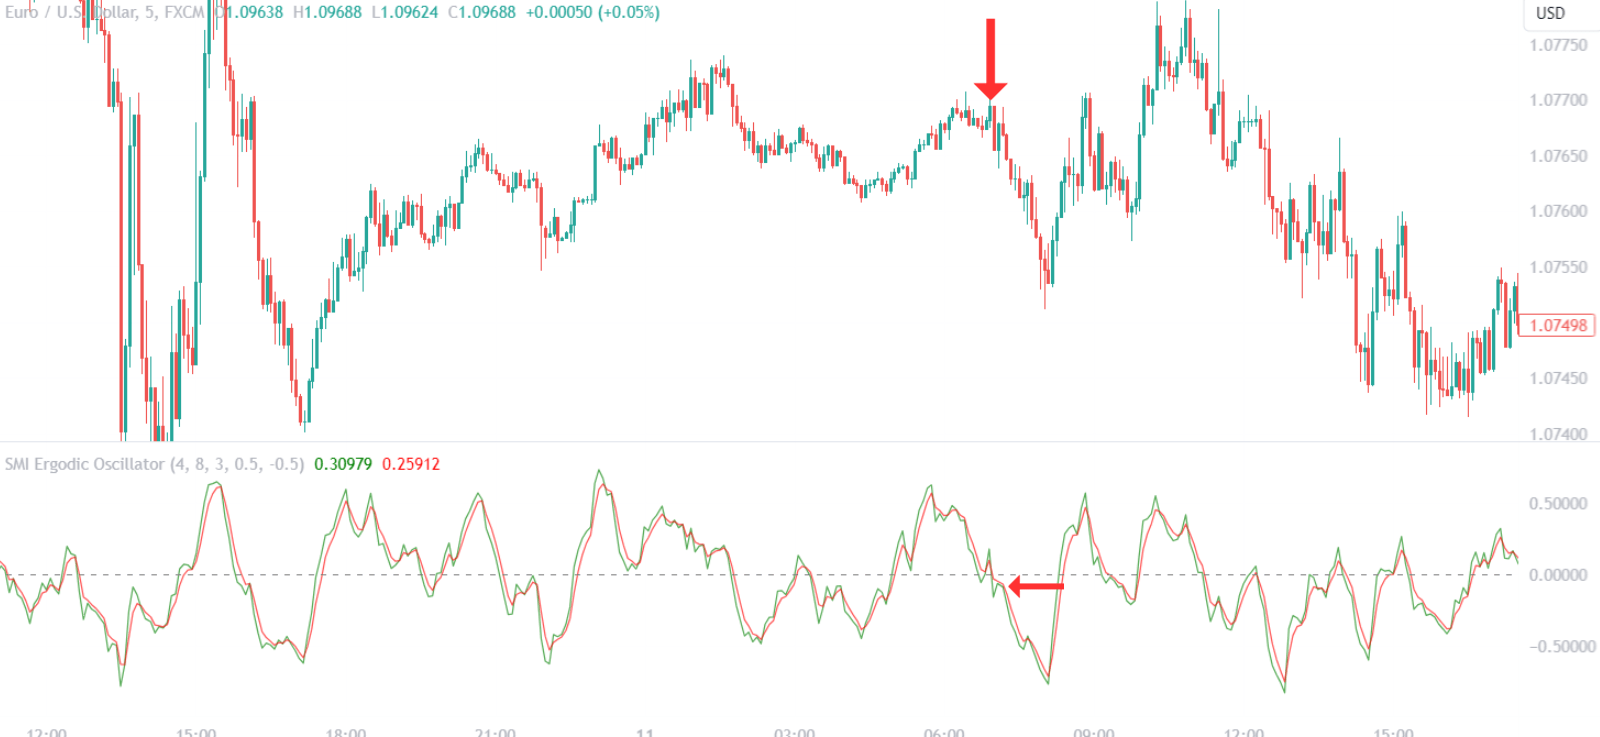
Trade Exit Signals with SMI Ergodic Oscillator
For exits, traders should monitor for the opposite crossover event or when the SMI lines reach extreme levels, which could indicate an overbought or oversold condition. An exit signal is stronger when the price touches or breaches the Bollinger Bands, suggesting a potential reversal or significant price movement.
Additionally, if the price interacts with key Fibonacci retracement levels near the time of an SMI crossover, this can offer a precise exit point. For instance, if the price struggles to break through a Fibonacci resistance level and the SMI starts to turn, it might be an opportune moment to close a long position.
| SMI Condition | Trade Action | Complementary Indicator | Indicator Confirmation |
|---|---|---|---|
| Bullish Crossover | Enter Long | Moving Averages | Crossover in the direction of the trend |
| Bearish Crossover | Enter Short | Volume-Based Indicators | High volume on crossover |
| Opposite Crossover | Exit Position | Bollinger Bands | Price touching or breaching the bands |
| Extreme SMI Levels | Exit Position | Fibonacci Retracement | Price interaction with key Fibonacci levels |
By adhering to these guidelines, traders can utilize the SMI Ergodic Oscillator to refine both entry and exit points, enhancing the precision of their trading strategies.
3.1. Identifying Overbought and Oversold Conditions
Overbought and Oversold Conditions with the SMI
Traders leverage the Stochastic Momentum Index (SMI) to gauge overbought and oversold conditions in the market, pivotal for making informed decisions. The SMI, a more refined version of the classic stochastic oscillator, indicates overbought conditions when it exceeds a certain high threshold, commonly set at +40, signaling potential price pullbacks. Conversely, when the SMI falls below a certain low threshold, typically -40, the market is considered oversold, suggesting a potential price rebound.
Identification of these market states is critical for traders seeking to capitalize on reversals. When the SMI reaches extreme levels, it often precedes a reversion to the mean, offering strategic entry or exit points. Traders should, however, seek confirmation from other indicators to validate these conditions. For instance, a high volume accompanying an SMI reading in the overbought territory can reinforce the likelihood of a forthcoming downtrend.
| SMI Level | Market Condition | Expected Price Action |
|---|---|---|
| Above +40 | Overbought | Potential pullback |
| Below -40 | Oversold | Potential rebound |

In practice, the SMI’s sensitivity can be adjusted by altering the time period or the moving average type used in its calculation. This flexibility allows traders to tailor the indicator to different markets and timeframes, enhancing its utility in identifying overbought and oversold conditions. Traders must backtest and optimize these settings to align with their specific trading strategy and risk tolerance.
3.2. Interpreting Signal Line Crossovers
Interpreting Signal Line Crossovers
Signal line crossovers are a core component of trading with the Stochastic Momentum Index (SMI). These crossovers occur when the SMI crosses its signal line, an event that is typically represented by a moving average of the SMI values. Traders pay close attention to these crossovers as they can indicate momentum shifts in the price of an asset.
A bullish crossover happens when the SMI crosses above its signal line, suggesting an increasing momentum and potentially signaling an entry point for traders. Conversely, a bearish crossover takes place when the SMI crosses below its signal line, hinting at decreasing momentum and possibly indicating an exit point or a short-selling opportunity.
| SMI Crossover Type | Market Implication | Suggested Action |
|---|---|---|
| Bullish | Rising Momentum | Consider Buying |
| Bearish | Falling Momentum | Consider Selling |
The effectiveness of these signals can be enhanced by considering the position of the SMI relative to its overbought and oversold thresholds. For instance, a bullish crossover in oversold territory is often more significant than one that occurs in neutral territory. Similarly, a bearish crossover in overbought territory may carry more weight than one in a neutral zone.
Traders should also be aware of false signals. It is not uncommon for the SMI to produce crossovers that do not result in the expected price movement. To mitigate this risk, traders often employ additional filters, such as volume analysis or other technical indicators, to validate the crossover signals before acting on them.
3.3. Combining Price Action with SMI Ergodic Signals
Enhancing SMI Ergodic Signals with Price Action Analysis
Integrating price action with SMI ergodic signals can significantly improve the precision of trading decisions. Price action involves the study of past market movement to anticipate future price direction. When used in conjunction with the SMI, traders can discern the strength of a trend and identify potential reversals more accurately.
One method to combine these approaches is by observing candlestick patterns at the time of an SMI crossover. For example, a bullish engulfing pattern coinciding with a bullish SMI crossover in oversold territory can be a strong buy signal. Conversely, a bearish SMI crossover in overbought territory accompanied by a shooting star pattern might suggest a compelling short opportunity.
Support and resistance levels also play a crucial role when used alongside SMI signals. A bullish crossover above a key support level can confirm the likelihood of an upward trend continuation. On the flip side, a bearish crossover below a significant resistance level may validate a potential downtrend.
Incorporating trend lines and price channels can further bolster the effectiveness of SMI signals. A bullish crossover that occurs simultaneously with a breakout above a descending trend line indicates a possible trend reversal to the upside. In contrast, a bearish crossover at the upper boundary of a price channel can signal a reversal to the downside.
Traders may also consider the historical price context. An SMI crossover that aligns with a price level that has historically acted as a pivot point adds credence to the signal. This historical price context can often serve as a confirmation for the SMI-generated signal, providing traders with an added layer of confidence in their decision-making process.
4. What are the Best Strategies for Incorporating the SMI Ergodic Oscillator?
Diversification of Time Frames
When integrating the SMI Ergodic Oscillator into trading strategies, diversifying across multiple time frames can be highly effective. Utilizing a longer time frame to establish the overall trend direction and a shorter time frame to pinpoint entry and exit points can create a dynamic trading system. For instance, a trader might use a daily chart to identify the general trend and a 1-hour chart to execute trades based on the SMI’s crossovers and divergences.
Pairing with Volume Indicators
Volume indicators such as the On-Balance-Volume (OBV) or the Volume-Weighted Average Price (VWAP) can complement the SMI by confirming the strength behind price movements. An SMI bullish signal accompanied by increasing volume suggests strong buying pressure, making it a more reliable entry point. Conversely, a bearish signal with high volume can indicate substantial selling pressure, potentially validating a short position.
Integration with Candlestick Patterns
Incorporating candlestick patterns can refine the precision of SMI signals. Patterns like the bullish engulfing or the bearish shooting star, when occurring in conjunction with an SMI crossover, can provide actionable insights. The combination of these technical analysis tools enhances the probability of identifying significant market moves.
Risk Management Techniques
Effective risk management is paramount, and the SMI can aid in setting stop-loss orders. A stop-loss can be placed just below a recent swing low for a long position or above a swing high for a short position, in alignment with an SMI signal. This approach helps to minimize potential losses while allowing for the flexibility needed to capture profitable moves.
| SMI Strategy Component | Purpose |
|---|---|
| Diversification of Time Frames | Establish trend direction and refine entry/exit points |
| Pairing with Volume Indicators | Confirm strength behind SMI signals |
| Integration with Candlestick Patterns | Enhance signal precision |
| Risk Management Techniques | Minimize losses and protect profits |
By employing these strategies, traders can effectively harness the potential of the SMI Ergodic Oscillator to make informed and strategic trading decisions.
4.1. Trend Following Techniques
Trend Following Techniques with the SMI Ergodic Oscillator
Incorporating the Stochastic Momentum Index (SMI) into trend-following techniques can be a powerful approach for traders. The SMI is particularly adept at identifying the direction and strength of a trend. When the SMI crosses above its signal line, it suggests an emerging uptrend, which can be a signal for traders to consider a long position. Conversely, a cross below the signal line may indicate a downtrend, prompting a potential short position.
To refine trend-following strategies, traders can monitor the SMI’s divergence from price action. A bullish divergence occurs when the price records a lower low, but the SMI forms a higher low, indicating weakening downward momentum and a possible upward trend reversal. On the flip side, a bearish divergence where the price hits a higher high while the SMI shows a lower high can signal an impending downward trend reversal.
Multiple time frame analysis enhances trend following by providing a more comprehensive view of the market. Traders might use a longer time frame to determine the overall trend direction and a shorter time frame to pinpoint optimal entry and exit points. For example, a trader could use a daily chart to assess the general trend and a 4-hour chart to make precise trades in harmony with this trend.
| Trend Following Component | Description |
|---|---|
| SMI Crossover | Indicates potential trend initiation |
| SMI Divergence | Suggests weakening momentum and possible reversal |
| Multiple Time Frame Analysis | Confirms trend direction and refines trading decisions |
By applying these trend-following techniques with the SMI, traders can align themselves with the market’s momentum, striving to ensure that they are on the right side of significant market moves. It’s essential to combine these methods with robust risk management to mitigate exposure to market volatility.
4.2. Counter-Trend Trading Approaches
Counter-Trend Trading Strategies
Counter-trend trading approaches contrast with trend following by seeking opportunities where the price is likely to reverse from its current path. Traders employing this strategy look for potential peaks and troughs in market price movements, often identified by overbought or oversold conditions. These can be detected using oscillators such as the Relative Strength Index (RSI) or Stochastic Oscillator, which provide signals that a current trend may be losing momentum and a reversal is imminent.
Fading the trend is a common counter-trend method where traders will enter a position in anticipation of a trend reversal. This could involve going short when the market appears overbought or going long when it seems oversold. It’s crucial to note that this strategy carries higher risk because it involves predicting changes in market direction against the prevailing trend.
| Counter-Trend Indicator | Purpose |
|---|---|
| RSI Overbought/Oversold | Identify potential reversals |
| Stochastic Crossover | Signal a change in momentum |
| Price Action Patterns | Confirm reversal reliability |
Traders may also use price action patterns, such as head and shoulders or double tops and bottoms, to corroborate the signals provided by oscillators. These patterns, when combined with volume analysis, can enhance the reliability of a potential reversal signal.
Incorporating multiple time frame analyses into counter-trend trading can be beneficial. For instance, if a trader identifies a potential reversal signal on a short-term chart, they might look to a longer-term chart to gain context and ensure that the signal does not merely represent a temporary pullback within a larger trend.
While counter-trend trading can offer significant profit opportunities if reversals are accurately anticipated, it demands a rigorous approach to risk management. Setting tight stop losses and having a clear exit strategy are critical to protect against large losses if the anticipated reversal does not materialize.
4.3. Risk Management and Position Sizing
Risk Management and Position Sizing
Effective risk management is the cornerstone of sustainable trading. Position sizing is a critical aspect of risk management, dictating the amount of capital allocated to a single trade relative to the trader’s total portfolio. A common rule of thumb is to risk no more than 1-2% of the total account balance on any single trade. This strategy helps traders stay in the game even after a series of losses, preventing a single trade from significantly damaging their account.
The use of stop-loss orders is an essential tool for position sizing. A stop-loss is set at a predetermined level and automatically closes a position if the market moves against the trader, thus capping the potential loss. The stop-loss should be placed at a level that is logically determined by the market structure, such as below a recent swing low in the case of a long position, and should align with the trader’s risk tolerance.
Leverage needs to be handled with caution. While it can amplify gains, it also increases the risk of substantial losses. Traders must understand the implications of leverage on position sizing and adjust their trade size accordingly to maintain control over their risk exposure.
To systematically manage risk, traders can use a risk-reward ratio, which compares the potential risk of a trade to its potential reward. A favorable risk-reward ratio, such as 1:3, means that for every dollar risked, three dollars are expected in return. This approach ensures that over time, profitable trades will outweigh the losses, even if the number of losing trades is greater than the winning ones.
| Risk Management Component | Description |
|---|---|
| Position Sizing | Allocating a percentage of total capital to a single trade to control risk. |
| Stop-Loss Orders | Setting a predetermined level at which a trade is closed to prevent larger losses. |
| Leverage | Using borrowed funds to increase trade size, which can both increase gains and amplify losses. |
| Risk-Reward Ratio | Comparing potential risk to potential reward to ensure profitability over time. |
By adhering to these principles of risk management and position sizing, traders can maintain their capital base and stay active in the markets, even during periods of drawdown.