
1. Understanding the Commodity Channel Index (CCI)
The Commodity Channel Index (CCI) is a versatile indicator that you can use to identify a new trend or warn of extreme conditions. Donald Lambert originally developed CCI to spot cyclical trends in commodities, but the market being cyclical, the concept can be universally applied. The CCI measures the current price level relative to an average price level over a given period of time with the assumption that commodities (or stocks or bonds) will move in cycles, with highs and lows coming at periodic intervals.
CCI is relatively high when prices are far above their average and relatively low when prices are far below their average. Thus, using a deviation measurement, CCI can be used to identify overbought and oversold levels. The CCI typically oscillates above and below a zero line. Normal oscillations will occur within the range of +100 and -100. Readings above +100 can imply an overbought condition, while readings below -100 can imply an oversold condition. However, one should be careful because a security can continue moving higher after the CCI indicator becomes overbought. Likewise, securities can continue falling after the indicator becomes oversold.
Understanding the CCI calculation can help you as a trader to understand why certain price levels are anticipated to be resistant or supportive. The CCI calculation produces positive and negative values that are plotted around a Zero-line. Positive values signify that prices are above their average, which is a show of strength. Negative values, on the other hand, indicate prices are below their average, a show of weakness. The CCI, in essence, is a momentum oscillator used by traders to determine overbought and oversold levels, and it can help traders to identify possible reversal points in the market.
1.1. Definition and Purpose of CCI
The Commodity Channel Index (CCI) is a versatile technical analysis tool that traders use to gauge the strength and direction of a market trend. Developed by Donald Lambert in the late 1970s, the CCI was initially designed to identify cyclical changes in commodities. However, its effectiveness in various market conditions has made it a popular choice for traders in stocks, forex, and other financial markets as well.
The primary purpose of the CCI is to measure the deviation of a commodity’s price from its statistical average. High CCI values indicate that prices are unusually high compared to their average, suggesting a possible overbought condition. Conversely, low CCI values suggest prices are significantly lower than their average, indicating a potential oversold state.
In essence, the CCI helps traders identify potential points of reversal, enabling them to make informed decisions about when to enter or exit a trade. However, like any other technical analysis tool, the CCI should not be used in isolation. It is most effective when combined with other indicators and analysis techniques, providing a comprehensive view of market conditions.
1.2. How the CCI is Calculated
Diving headfirst into the crux of the matter, the Commodity Channel Index (CCI) is a versatile indicator that measures the variation of a security’s price from its statistical mean. High values show that prices are unusually high compared to their average price, and low values show that prices are unusually low.
To calculate the CCI, you start by determining the Typical Price (TP). This is done by adding the high, low, and closing prices for each period, and then dividing by three. The formula is TP = (High + Low + Close)/3.
The next step involves calculating the Simple Moving Average (SMA) of the TP. This is done by adding up the TPs for the past N periods and then dividing by N. The formula is SMA = SUM(TP, N)/N.
The third step is to calculate the Mean Deviation. This is done by subtracting the SMA from each TP, taking the absolute values, summing them up, and then dividing by N. The formula is MD = SUM(|TP – SMA|, N)/N.
Finally, the CCI is calculated by subtracting the SMA from the TP, dividing the result by the MD, and then multiplying by 0.015. The formula is CCI = (TP – SMA)/(0.015 * MD).
Remember, the constant 0.015 is used to ensure that approximately 70 to 80 percent of CCI values fall within the -100 to +100 range. This is a crucial aspect as it helps traders identify periods where a security’s price is overbought or oversold, providing valuable insight to make informed trading decisions.
2. Strategies for Using the CCI Successfully
Understanding the nuances of the Commodity Channel Index (CCI) is crucial for its successful application. Initially designed for commodity trading, the CCI has proven its versatility across various market types, from Forex to stocks. One key strategy is to utilize the CCI in identifying overbought and oversold conditions. When the CCI value exceeds +100, it may indicate an overbought condition, suggesting a potential price reversal. Conversely, a CCI value below -100 could signal an oversold condition, hinting at a potential upward price movement.
Another effective strategy is to employ the CCI for trend confirmation. In an uptrend, traders can look for CCI values above zero as a confirmation of positive momentum. Similarly, in a downtrend, CCI values below zero can confirm negative momentum. Remember, the CCI is a momentum-based indicator, and its values can help traders gauge the strength of a trend.
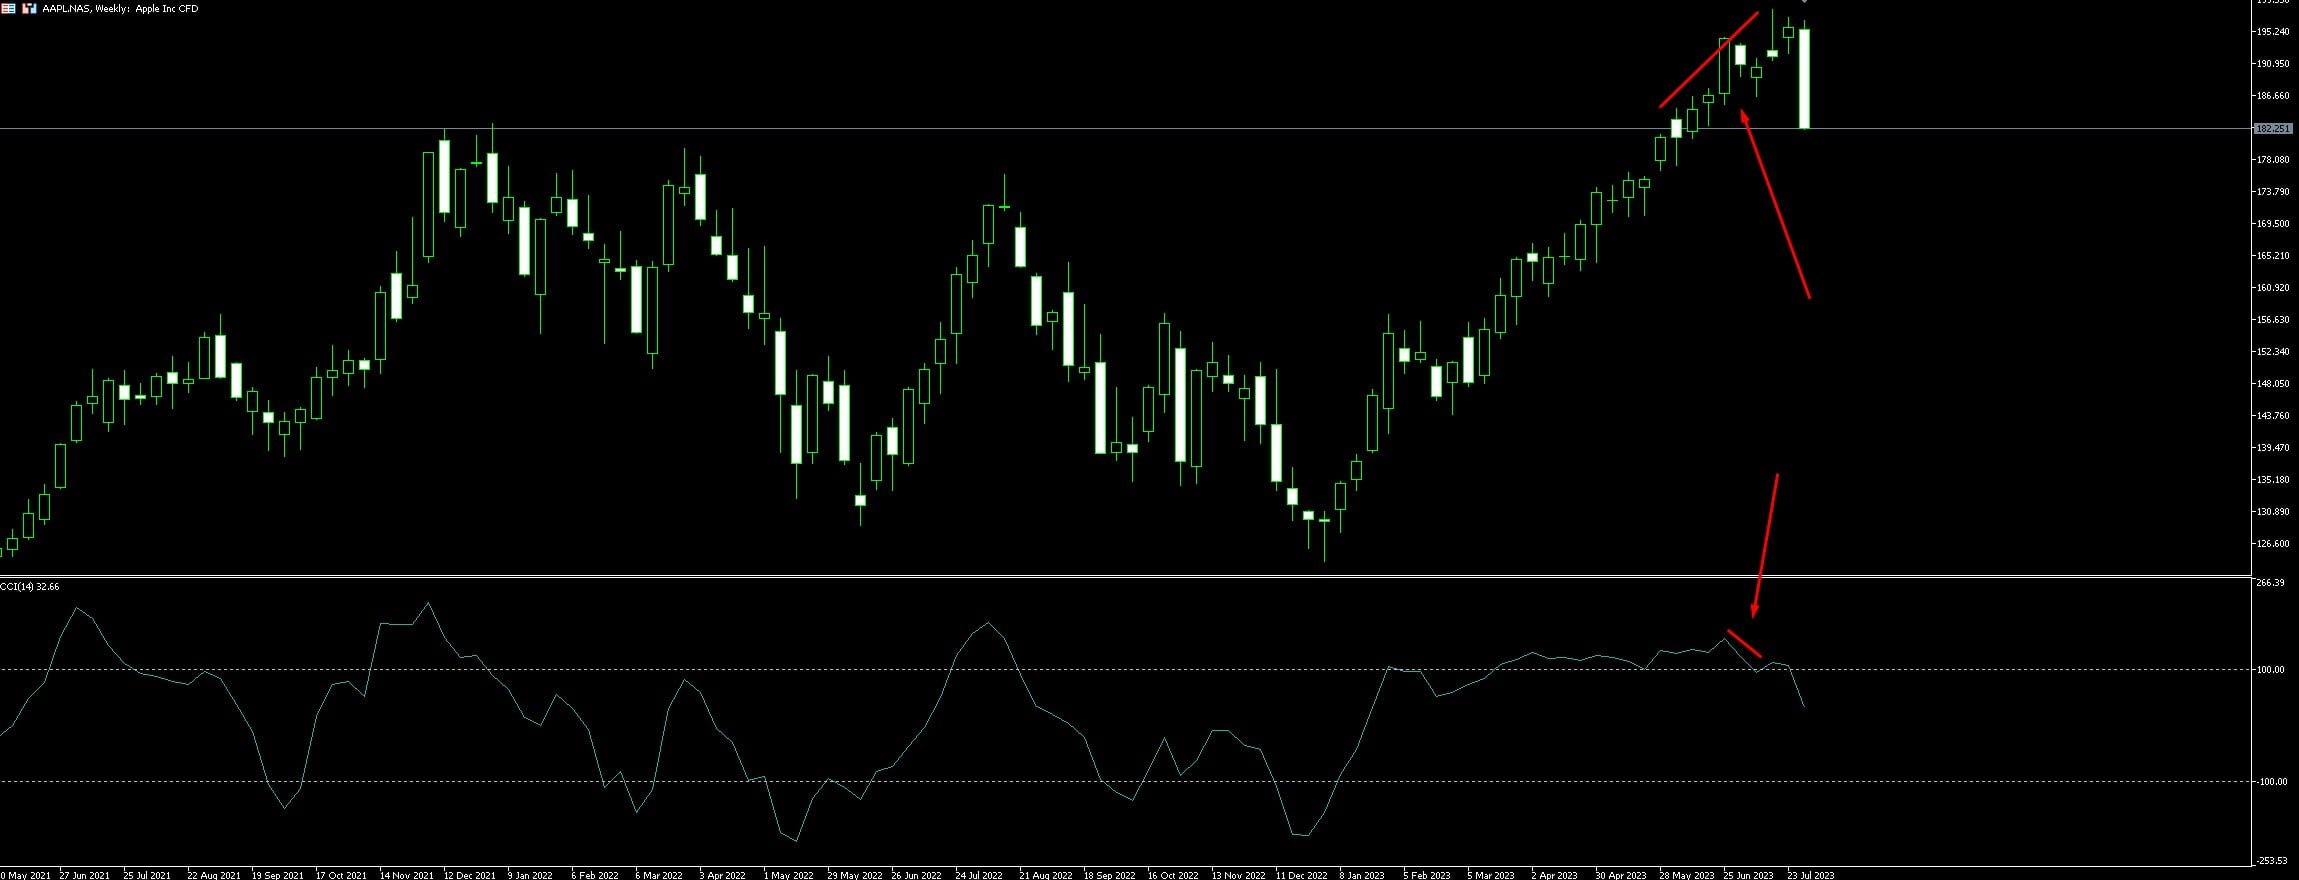
Divergence trading with CCI is another significant strategy. When the price chart shows a new high, but the CCI fails to reach a new high, it indicates a bearish divergence, signaling a potential price drop. Conversely, when the price chart shows a new low, but the CCI fails to reach a new low, it indicates a bullish divergence, hinting at a possible price rise.
Lastly, combining the CCI with other technical indicators can enhance your trading strategy. For instance, using the CCI alongside moving averages can provide more accurate signals for entry and exit points.
In essence, successful use of the CCI involves understanding its principles, applying it in different market conditions, and integrating it with other technical analysis tools. It’s not a standalone tool, but when used correctly, the CCI can be an invaluable addition to any trader’s toolkit.
2.1. Identifying Overbought and Oversold Levels
In the world of trading, knowing when a commodity is overbought or oversold is a key to unlocking potential profits. The Commodity Channel Index (CCI) is a versatile tool that can help you identify these pivotal moments.
The CCI calculates the current price level relative to an average price level over a given period of time. The resultant value helps traders determine the overbought and oversold levels. A high CCI, typically above 100, indicates that the commodity is likely overbought, and there could be a price reversal in the near future. On the other hand, a low CCI, typically below -100, suggests that the commodity is oversold, and a price bounce might be imminent.
But why is this important? Well, understanding these levels can help you make more informed trading decisions. When a commodity is overbought, it may be a good time to sell, as the price could soon drop. Conversely, when a commodity is oversold, it might be an opportune time to buy, as the price may rise in the near future.
However, it’s important to remember that the CCI is just one tool in a trader’s arsenal. While it can provide valuable insights, it should not be used in isolation. Always consider other market indicators and factors before making a trading decision.
Remember, trading involves risk, and it’s crucial to have a well-thought-out strategy. Understanding the CCI and how to identify overbought and oversold levels is a key component of this strategy. So, whether you’re a seasoned trader or just starting out, mastering the CCI can help you navigate the often tumultuous waters of the trading world.
2.2. Using CCI to Identify Divergences
Divergences are an essential element of trading that can provide valuable insight into potential market reversals. One of the most effective ways to identify these divergences is through the use of the Commodity Channel Index (CCI). This powerful tool, developed by Donald Lambert, measures the variation of a security’s price from its statistical mean, providing traders with a visual representation of price patterns and trends.
Divergences occur when the price of a security and the CCI indicator move in opposite directions. For instance, if the price is making higher highs while the CCI is making lower highs, this is known as a bearish divergence. Conversely, if the price is making lower lows while the CCI is making higher lows, this is referred to as a bullish divergence. These divergences can signal potential reversals, with bearish divergences indicating a potential downtrend, and bullish divergences suggesting an upcoming uptrend.
Identifying divergences using the CCI is a relatively straightforward process. You simply need to observe the price chart and the CCI indicator simultaneously, looking for instances where they diverge. However, it’s crucial to remember that while divergences can be a powerful signal, they should not be used in isolation. Always confirm your findings with other indicators and analysis techniques to ensure the most accurate trading decisions.
Using the CCI to identify divergences can be a game-changer for traders. By providing an early warning of potential price reversals, it allows traders to position themselves advantageously, maximizing their potential profits and minimizing their risk. So, whether you’re a seasoned trader or just starting out, understanding and leveraging divergences with the CCI can significantly enhance your trading strategy.
2.3. Using CCI for Breakout Trading
Breakout trading is a strategy often employed by traders to identify potential opportunities in the market, and the Commodity Channel Index (CCI) can be an invaluable tool in this endeavor. The CCI is a momentum-based oscillator that gauges the speed and direction of a market’s price movement. When the CCI crosses above a predefined positive level, it signifies a potential breakout to the upside, indicating a buy signal. Conversely, when the CCI crosses below a predefined negative level, it suggests a possible breakout to the downside, signaling a sell opportunity.
To maximize the effectiveness of using CCI for breakout trading, it’s crucial to understand the concept of ‘overbought’ and ‘oversold’ conditions. Typically, a CCI reading above +100 is considered overbought – a situation where the price has gained significantly and could be due for a pullback or reversal. On the other hand, a CCI reading below -100 is viewed as oversold, suggesting the price has fallen sharply and could be poised for a bounce or reversal.
Timing is a critical aspect of breakout trading with the CCI. Traders should wait for the CCI to cross above +100 or below -100 before initiating a trade. Acting too early may result in entering a trade before the breakout occurs, potentially leading to losses. Also, traders should keep an eye on the market’s volatility. High volatility can cause the CCI to fluctuate rapidly, which might result in false breakout signals.
Incorporating other technical analysis tools can enhance the accuracy of the CCI in breakout trading. For instance, trend lines, support and resistance levels, and moving averages can provide additional confirmation of breakout signals generated by the CCI.
While the CCI is a powerful tool for breakout trading, it’s essential to remember that no indicator is infallible. Always use stop-loss orders to manage your risk, and never risk more than you can afford to lose. Trading is a game of probabilities, not certainties, and the successful trader is the one who knows how to manage those probabilities in their favor.
3. Tips and Precautions When Using CCI
Mastering the Commodity Channel Index (CCI) is a key skill for any trader looking to gain an edge in the markets. The CCI is a versatile tool that can help identify new trading opportunities, but it’s important to use it correctly to avoid costly mistakes.
Firstly, never use the CCI in isolation. While the CCI can provide valuable insights, it should always be used in conjunction with other technical analysis tools. This can help confirm signals and reduce the risk of false positives. For instance, you might use the CCI alongside moving averages or resistance and support levels to confirm your trading signals.
Secondly, be wary of overbought and oversold conditions. While the CCI can help identify these conditions, they don’t always lead to immediate price reversals. Markets can remain overbought or oversold for extended periods, and trading on these signals alone can lead to losses. It’s crucial to wait for confirmation from the price action before entering a trade.
Thirdly, understand the concept of divergence. Divergence occurs when the price action and the CCI are moving in opposite directions. This can be a powerful signal that the current trend is weakening and a reversal may be imminent. However, divergence is a more advanced concept and should be used with caution by new traders.
Lastly, always use stop losses and take profits. The CCI can help identify potential entry and exit points, but it’s up to you to manage your risk. Always set a stop loss to limit your potential losses, and a take profit to secure your gains when the price reaches your target.
By following these tips and precautions, you can use the CCI effectively and increase your chances of trading success. Remember, the key to successful trading is not just about finding the right signals, but also managing your risk and staying disciplined.
3.1. Importance of Combining CCI with Other Indicators
In the realm of trading, the Commodity Channel Index (CCI) has been a valuable tool for many investors. However, while it is a powerful instrument on its own, its true potential is unlocked when combined with other indicators. Pairing the CCI with other technical analysis tools can provide a more comprehensive view of market conditions, helping traders to make more informed decisions.
Using the CCI in conjunction with other indicators can help to confirm or deny potential trading signals. For instance, if the CCI indicates an overbought condition, but another indicator such as the Relative Strength Index (RSI) does not, it may be wise to hold off on selling. On the other hand, if both the CCI and RSI indicate an overbought condition, it could be a strong signal to sell.
Combining the CCI with trend indicators like Moving Average Convergence Divergence (MACD) or Bollinger Bands can also be highly beneficial. These tools can help to identify the overall trend of the market, which can then be used to inform CCI-based trading decisions. For example, if the market is in a strong uptrend and the CCI indicates an oversold condition, it could be an excellent opportunity to buy.
The CCI and volume indicators make another powerful combination. Volume indicators can provide insight into the strength of a particular price move. If the CCI indicates a new trend and the volume supports it, this could be a strong signal to enter a trade.
In essence, while the CCI is a potent tool in its own right, its effectiveness is significantly enhanced when combined with other indicators. This multi-indicator approach can provide a more holistic view of the market, leading to more accurate trading decisions and, ultimately, greater success in the trading world.
3.2. Understanding the Limitations of CCI
While the Commodity Channel Index (CCI) is a versatile and powerful tool in a trader’s arsenal, it’s crucial to be aware of its limitations. Firstly, the CCI is a momentum oscillator, and like all oscillators, it can generate false signals during periods of consolidation or in sideways markets. This can lead to premature or incorrect trading decisions.
Secondly, the CCI is not a standalone tool. It should be used in conjunction with other technical indicators or chart patterns to confirm signals and increase the probability of successful trades. For instance, a positive divergence on the CCI can be confirmed with a bullish engulfing pattern on the price chart.
Thirdly, the default period setting of the CCI (typically 14 periods) may not be suitable for all trading styles or market conditions. Day traders might need to adjust the period setting to a lower value for more sensitivity, while swing traders might prefer a higher value for less sensitivity.
Lastly, the CCI is not designed to determine price levels. It does not provide information on whether an asset is overpriced or underpriced, but rather indicates whether it is overbought or oversold. Therefore, traders should not use the CCI as a sole determinant for making buy or sell decisions.
Understanding these limitations can help traders use the CCI more effectively and avoid common pitfalls. As with any trading tool, practice and experience are key to mastering the CCI and using it successfully.