1. Overview of the Relative Volume At Time Indicator
The Relative Volume At Time (RVAT) indicator is a crucial tool for traders and investors, offering insights that go beyond basic volume analysis. At its core, RVAT helps users understand the trading activity of a stock, commodity, or any other tradable instrument, compared to its typical activity at a specific time of day. This comparison provides a deeper understanding of market sentiment and potential price movements, making it invaluable for making informed trading decisions.

1.1 What is Relative Volume At Time?
The Relative Volume At Time indicator measures how current volume compares to historical volume for the same time of day. This is particularly useful in identifying periods of unusual trading activity. For instance, if the RVAT is significantly higher than normal, it may suggest strong interest in the asset, possibly due to news events, significant market changes, or other factors.
1.2 Importance in Trading
Understanding volume is crucial because it confirms the strength of a trend or signals about its weakness. Volume is the gas in the tank of the trading machine. Without volume, prices move less predictably and less dramatically. RVAT refines this by adding the dimension of time, allowing traders to assess whether the current volume is normal or exceptional for that particular moment in the trading session.
1.3 Benefits for Traders
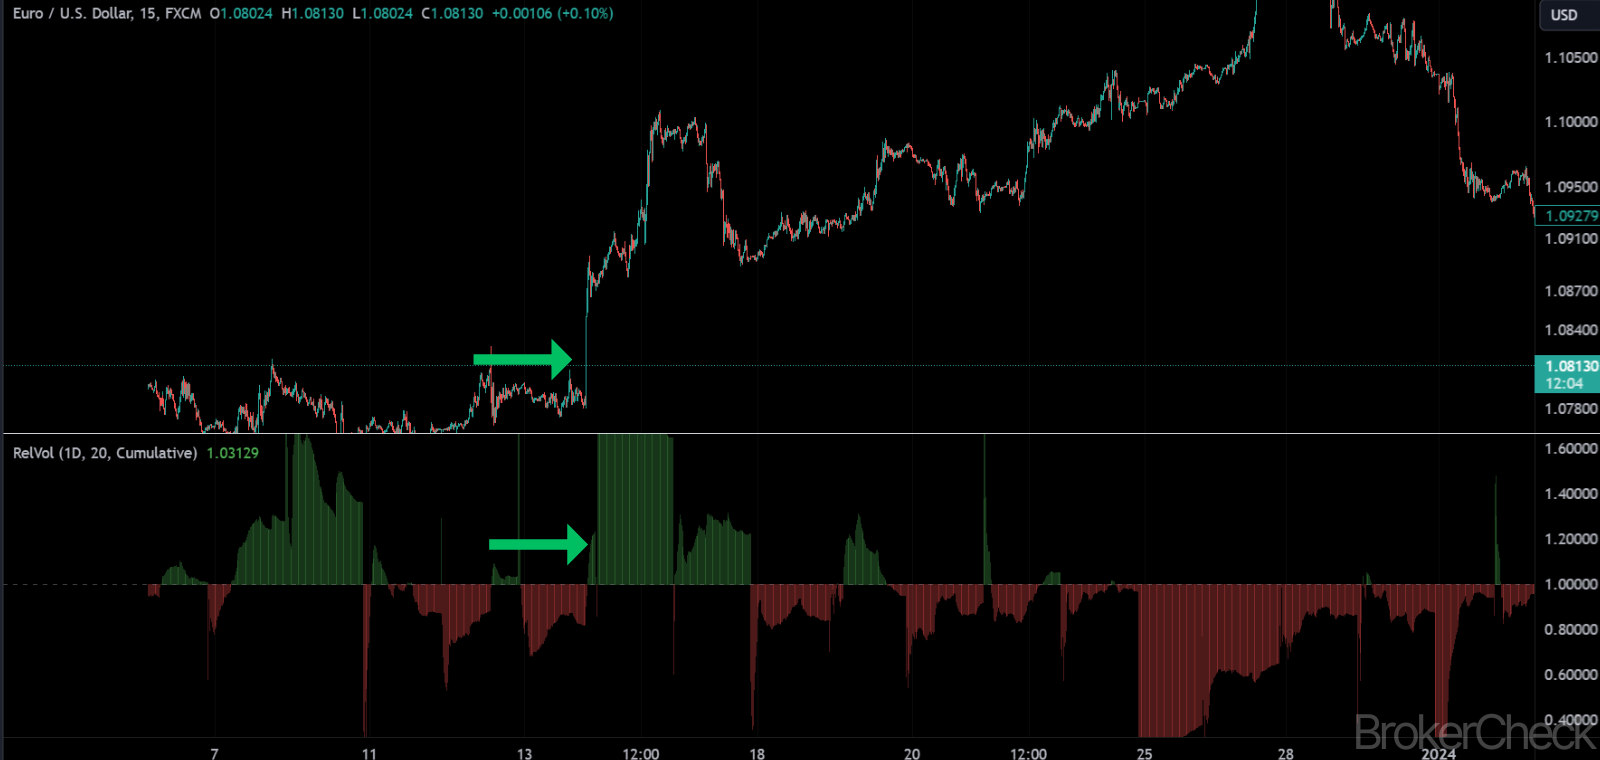
- Identifies Breakouts: High relative volume at a particular time may indicate a breakout, as it shows stronger interest than usual.
- Enhances Market Timing: By understanding when an asset typically experiences higher or lower volume, traders can better time their entry and exit points.
- Improves Risk Management: Knowing periods of high volume can help in setting more accurate stop-loss orders, as these periods may see more significant price movements.
1.4 How It Differs from Other Volume Indicators
While traditional volume indicators provide a cumulative view of trading activity, RVAT offers a nuanced perspective by comparing current activity to historical norms at specific times. This time-based comparison is what sets RVAT apart, providing unique insights that are not readily apparent through other volume measures.
| Feature | Description |
|---|---|
| Indicator Type | Volume Analysis |
| Purpose | Compares current trading volume to historical average at the same time of day |
| Benefits | Identifies unusual trading activity, enhances market timing, and aids in risk management |
| Best Used For | Spotting breakouts, timing trades, setting stop-loss orders |
| Suitable For | Stocks, commodities, and other tradable instruments |
2. Calculation Process of the Relative Volume At Time Indicator
Understanding the calculation process of the Relative Volume At Time (RVAT) indicator is crucial for traders who wish to leverage its insights effectively. This section breaks down the methodology in a step-by-step manner, making it accessible to beginners while providing enough depth for advanced traders to appreciate the nuances of this powerful tool.
2.1 Step-by-Step Calculation
The RVAT calculation involves comparing the current trading volume of an asset with its historical average volume at the same specific time. Here’s how it’s done:
- Select the Timeframe: Decide on the timeframe for which you want to calculate RVAT (e.g., 10-minute intervals, hourly, etc.). This timeframe should align with your trading strategy and the periods during which you observe significant market activity.
- Gather Historical Volume Data: Collect volume data for the selected timeframe over a significant historical period. This could be the past 10 days, 30 days, or more, depending on the consistency and availability of data.
- Calculate Average Historical Volume: For each specific timeframe (e.g., 9:30-9:40 AM), calculate the average volume by summing up the volumes of the historical period and dividing by the number of periods considered.
- Measure Current Volume: Record the current trading volume for the asset during the same specific timeframe.
- Calculate RVAT: Divide the current volume by the average historical volume for that timeframe to get the RVAT.
2.2 Formula
The RVAT can be represented by the following formula:
RVAT = Current Volume / Average Historical Volume
2.3 Example Calculation
Let’s consider an example to illustrate this calculation:
- Timeframe: 9:30-9:40 AM
- Historical Period: Past 30 days
- Current Volume (Today): 500,000 shares
- Average Historical Volume (Past 30 Days): 300,000 shares
Using the formula:
RVAT = 500,000 / 300,000 = 1.67
This means the current volume is 1.67 times the average historical volume for this specific time, indicating higher than usual trading activity.
2.4 Interpretation
A higher RVAT value (significantly greater than 1) indicates that the current volume is higher than the historical average, suggesting increased interest or activity in the asset. Conversely, a lower RVAT value (close to or less than 1) suggests lower than average trading activity, which might indicate a lack of interest or a consolidation phase.
| Step | Description |
|---|---|
| 1 | Select the specific timeframe for analysis |
| 2 | Gather historical volume data for that timeframe |
| 3 | Calculate the average historical volume for the timeframe |
| 4 | Measure the current volume for the same timeframe |
| 5 | Divide current volume by average historical volume to calculate RVAT |
3. Optimal Values for Setup in Different Timeframes
Selecting the optimal values for the Relative Volume At Time (RVAT) setup across various timeframes is pivotal in maximizing the effectiveness of this indicator. Different markets and trading strategies may require adjustments to the timeframe and historical period analyzed to align with specific trading goals. This section will guide traders through setting up RVAT for optimal use, considering different trading styles and market conditions.
3.1 Short-Term Trading (Day Trading)
For day traders, who capitalize on small price movements within a single trading day, focusing on shorter timeframes for RVAT calculations is essential.
- Timeframe for Analysis: 5 to 15-minute intervals are optimal for day trading, as they provide insight into short-term volume spikes and trends.
- Historical Period: A 10 to 20-day period is generally sufficient for calculating the average historical volume, offering a balance between recent market activity and avoiding outliers.
3.2 Medium-Term Trading (Swing Trading)
Swing traders, who hold positions for several days to weeks, aiming to profit from price “swings,” require a broader perspective.
- Timeframe for Analysis: 30-minute to 1-hour intervals can offer the necessary insight into medium-term volume trends.
- Historical Period: Considering a 30 to 60-day period for the average historical volume calculation can provide a more stable and reliable benchmark, capturing a broader range of market sentiment.
3.3 Long-Term Trading (Position Trading)
For position traders, who maintain trades for several weeks to months, the focus shifts towards capturing significant volume trends that align with long-term market movements.
- Timeframe for Analysis: Daily intervals are most suitable, as they reflect the broader market sentiment and longer-term trading activity.
- Historical Period: A 90 to 180-day period is recommended to calculate the average historical volume, ensuring that the analysis incorporates various market phases and seasonal trends.
3.4 Adjusting for Market Volatility
Market conditions and volatility can significantly affect the optimal setup of RVAT. In highly volatile markets, traders may need to adjust the historical period to a shorter timeframe to account for recent changes in trading activity. Conversely, in stable markets, a longer historical period may provide more accurate and reliable benchmarks.

| Trading Style | Timeframe for Analysis | Historical Period |
|---|---|---|
| Day Trading | 5 to 15-minute intervals | 10 to 20 days |
| Swing Trading | 30-minute to 1-hour intervals | 30 to 60 days |
| Position Trading | Daily intervals | 90 to 180 days |
4. Interpretation and Application of the Relative Volume At Time Indicator
Interpreting and applying the Relative Volume At Time (RVAT) indicator effectively is crucial for traders looking to integrate this tool into their market analysis and decision-making processes. This section delves into how to read RVAT values and apply this insight to trading strategies, enhancing both entry and exit points as well as overall market understanding.
4.1 Interpreting RVAT Values
The RVAT indicator provides a numerical value that compares current trading volume to the historical average volume at a specific time. Here’s how to interpret these values:
- RVAT > 1: Indicates that the current volume is higher than the historical average for that time, suggesting increased interest or activity in the asset. This is often seen during breakouts or significant market moves.
- RVAT < 1: Signifies that the current volume is lower than the historical average, indicating decreased interest or consolidation periods.
- RVAT ≈ 1: Implies that the current volume is close to the historical average, suggesting normal trading activity with no significant changes in market sentiment.
4.2 Application in Trading Strategies
4.2.1 Identifying Breakouts
- High RVAT Values: A significantly high RVAT value can signal a potential breakout, as it indicates unusual trading activity. Traders might consider this an opportunity to enter a position in the direction of the volume surge.
4.2.2 Confirming Trend Strength
- Consistently High RVAT: During a trend, consistently high RVAT values suggest strong participation and could confirm the trend’s sustainability. Conversely, declining RVAT values in a trend might indicate weakening momentum.
4.2.3 Timing Entries and Exits
- Entry Points: Traders can use periods of high RVAT values as potential entry points, assuming increased volume indicates strong market interest.
- Exit Points: Low RVAT values, especially if they persist or occur after a period of high values, may serve as indicators for potential exits, signaling decreasing interest or a reversal.
| RVAT Value | Interpretation | Application |
|---|---|---|
| > 1 | Higher than average volume | Potential breakout or trend continuation |
| < 1 | Lower than average volume | Potential consolidation or reversal |
| ≈ 1 | Close to average volume | Normal market activity |
5. Combination with Other Indicators
Integrating the Relative Volume At Time (RVAT) indicator with other technical analysis tools can significantly enhance trading strategies. This section explores how RVAT can be combined with various indicators to provide a more comprehensive view of the market, aiding in decision-making processes for both entry and exit points.
5.1 Combining RVAT with Moving Averages
Moving averages are a staple in technical analysis, smoothing out price data to identify the direction of the trend. Combining RVAT with moving averages can help traders:
- Identify Trend Confirmations: A high RVAT during a trend indicated by moving averages (50 MA Crosses Above 200 MA) can serve as a strong confirmation, suggesting the trend is backed by significant volume.
- Spot Reversals: An increasing RVAT in the opposite direction of the current trend, near moving average lines, may signal a potential trend reversal.
5.2 RVAT and Relative Strength Index (RSI)
The Relative Strength Index (RSI) is a momentum oscillator that measures the speed and change of price movements. When used with RVAT:
- Overbought/Oversold Conditions: An unusually high RVAT in conjunction with RSI readings above 70 (overbought) or below 30 (oversold) can indicate strong market interest in reversals.
- Divergence: Divergence between RVAT and RSI (e.g., RVAT showing strength while RSI is declining) can signal a potential price movement before it occurs.

5.3 Pairing RVAT with Volume Profile
The Volume Profile displays trading activity over a specified price range, showing where and how much volume has been traded. Integrating RVAT with Volume Profile allows traders to:
- Identify Key Support/Resistance Levels: High RVAT at crucial Volume Profile levels (e.g., Point of Control, Value Area High/Low) can indicate strong interest, serving as potential support or resistance.
- Enhance Entry/Exit Points: Combining RVAT spikes with significant levels on the Volume Profile can refine entry and exit points, offering clearer signals for action.
5.4 RVAT and Breakout Indicators
Breakout indicators, such as Bollinger Bands or Donchian Channels, identify potential breakouts from established ranges. RVAT can complement these indicators by:
- Confirming Breakouts: A breakout accompanied by a high RVAT suggests a strong move supported by volume, increasing the likelihood of a successful breakout.
- Filtering False Breakouts: A breakout without accompanying high RVAT may indicate a lack of conviction, potentially signaling a false breakout.

| Indicator | How It Complements RVAT | Purpose |
|---|---|---|
| Moving Averages | Trend confirmation and reversal signals | Identifying the strength and potential changes in trends |
| RSI | Highlighting overbought/oversold conditions and divergences | Assessing momentum and potential reversal points |
| Volume Profile | Identifying key levels of support and resistance | Enhancing decision-making for entries and exits |
| Breakout Indicators | Confirming or questioning the strength of breakouts | Determining the validity of breakout signals |
6. Risk Management Using the Relative Volume At Time Indicator
Risk management is a critical aspect of successful trading, ensuring that traders can protect their capital while maximizing potential gains. The Relative Volume At Time (RVAT) indicator, while primarily used for identifying trading opportunities through volume analysis, can also play a significant role in risk management strategies. This section explores how RVAT can be utilized to enhance risk management in trading.
6.1 Setting Stop-Loss Orders
RVAT can help traders set more effective stop-loss orders by identifying periods of high volume activity, which often coincide with significant price movements.
- During High RVAT Periods: If entering a trade during a period of high RVAT, consider setting stop-loss orders beyond the usual price fluctuation range to account for increased volatility.
- Low RVAT Adjustments: Conversely, if RVAT is low, traders might set tighter stop-loss orders, as lower volume suggests less price volatility.
6.2 Position Sizing
Understanding the relative volume at specific times can inform position sizing decisions, helping traders manage the level of risk they are exposed to in a trade.
- Increased Volume: Larger positions may be justified during times of high RVAT, as the confidence in market movements can be higher. However, it’s crucial to balance this with the overall risk tolerance and not overextend.
- Decreased Volume: In periods of low RVAT, taking smaller positions can mitigate risk, as the lack of volume may lead to unpredictable price movements.
6.3 Timing Entries and Exits
RVAT can also guide the timing of entries and exits, which is crucial for risk management.
- Timing Entries: Entering trades during periods of above-average RVAT can increase the likelihood that the entry is made during a significant market move, potentially reducing the risk of entering during a flat or indecisive market period.
- Timing Exits: Similarly, exiting or taking profits during high RVAT periods may help capture gains before the market sentiment changes, minimizing the risk of holding through a reversal.
6.4 Combining RVAT with Volatility Measures
Incorporating volatility indicators (e.g., Average True Range, Bollinger Bands) with RVAT can enhance risk management by providing a clearer picture of the market’s volatility and potential price movement ranges.
- Volatility and RVAT: High RVAT in conjunction with expanding volatility measures can signal increased market risk, suggesting more conservative risk management measures should be taken.
Summary Table
| Risk Management Aspect | RVAT Application | Benefit |
|---|---|---|
| Stop-Loss Orders | Adjusting stop-loss orders based on RVAT levels | Tailors risk level to current market volatility |
| Position Sizing | Modifying position sizes in line with RVAT insights | Aligns exposure with market activity levels |
| Timing Entries and Exits | Utilizing RVAT for better timing decisions | Improves the risk/reward ratio of trades |
| Volatility Analysis | Combining RVAT with volatility indicators | Provides a comprehensive view of market risk |