
1. What is Parabolic SAR?
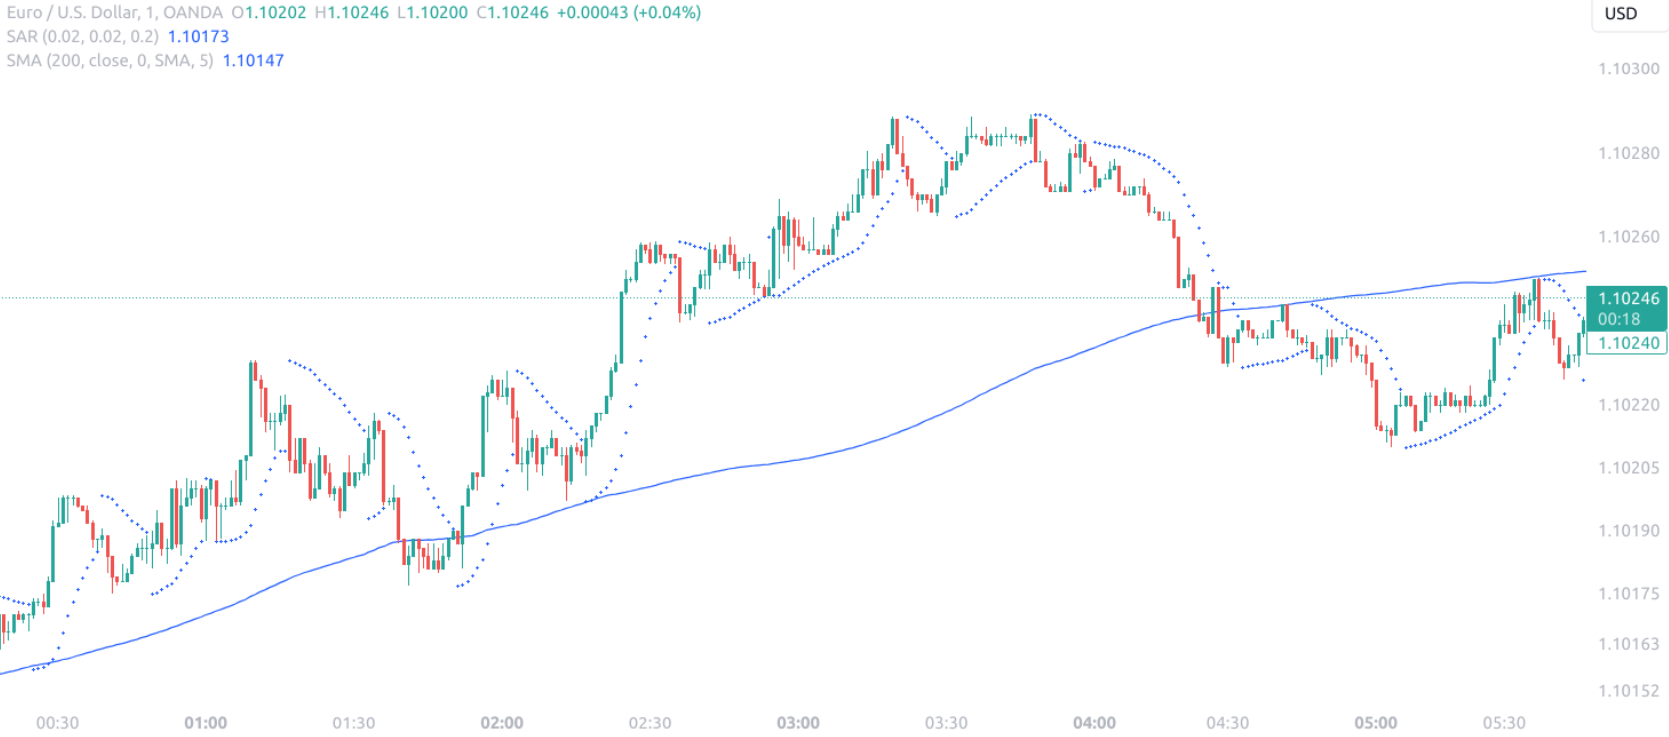
The Parabolic SAR (Stop and Reverse) is a technical analysis indicator, developed by J. Welles Wilder Jr., designed to identify potential reversals in the price direction of traded assets, such as stocks, commodities, and forex. This trend-following system is depicted as dots placed either above or below the price bars on a chart. When the dots are below the price bars, it indicates a bullish trend, suggesting that it might be beneficial to hold or initiate a long position. Conversely, dots above the price bars signal a bearish trend, hinting at the potential to hold or initiate a short position.
The indicator’s name derives from its construction; the dots follow a parabolic path and increase in acceleration with the trend, like a parabola in mathematics. This accelerating system uses the SAR acronym to highlight its dual function: to stop and reverse. It implies that the Parabolic SAR can provide signals for potential stop-loss levels and suggest points at which traders might consider reversing their trading position to take advantage of an emerging trend.
One of the key strengths of the Parabolic SAR is its straightforwardness; it offers clear visual cues on a chart, making it accessible for traders to interpret and act upon. However, it’s crucial to note that the Parabolic SAR is most effective in markets with a strong trend and can lead to false signals in ranging or volatile markets.
The formula for calculating the Parabolic SAR is iterative and considers the previous period’s SAR and the extreme price (EP), which is the highest high or lowest low of the current trend. The indicator also includes an acceleration factor (AF), which starts at a default of 0.02 and increases by 0.02 each time a new EP is established, up to a maximum of 0.20. The general calculation is as follows:
SAR_(t+1) = SAR_t + AF * (EP – SAR_t)
Traders often adjust the AF for sensitivity, with higher values making the indicator more reactive to price changes, and lower values making it slower, thus filtering out market noise.

2. How is Parabolic SAR Calculated?
The Parabolic SAR calculation is a methodical process that requires a series of steps, incorporating the Acceleration Factor (AF) and the Extreme Point (EP). To begin the calculation for a new trend, the EP is initially set as the highest high or lowest low of the period being considered.
The AF value has a starting point of 0.02, incrementing by 0.02 each time a new EP is recorded, with a cap of 0.20 to prevent the value from becoming too large. The essence of the Parabolic SAR is to adjust its value with each new bar to reflect the changing market conditions.
Calculation Steps:
- Determine the EP: Identify the highest high or lowest low of the current trend.
- Initialize or Update the AF: Start at 0.02 and increase by 0.02 with each new EP, maxing out at 0.20.
- Calculate the SAR for the next period (
SAR_(t+1)): Add the product of the current AF and the difference between the current EP and the current period’s SAR to the current period’s SAR.
The calculation is recursive, meaning it uses the prior period’s data to compute the current value. This iterative process allows the indicator to adapt and follow the price closely as trends develop.
| Step | Formula |
|---|---|
| 1 | EP = Highest High or Lowest Low |
| 2 | AF = 0.02 (to start; +0.02 per new EP, ≤ 0.20) |
| 3 | SAR_(t+1) = SAR_t + AF * (EP – SAR_t) |
The formula’s recursive nature ensures that the Parabolic SAR tracks price movement closely, providing dynamic support and resistance levels. Traders may optimize the parameters of the AF to tailor the sensitivity of the indicator to the asset’s price action or the trader’s strategy.
By continuously adjusting the EP and the AF, the Parabolic SAR provides a mechanism for traders to visualize potential trend reversals and adjust their positions accordingly. This dynamic calculation is integral to the indicator’s ability to signal entry and exit points in alignment with prevailing market trends.
2.1. Understanding the Formula to Calculate Parabolic SAR
Grasping the Nuances of the Parabolic SAR Formula
The iterative nature of the Parabolic SAR formula embodies its ability to adapt quickly to changing market conditions, a vital feature for traders who rely on up-to-the-minute analysis. It’s essential to recognize that each new calculation carries forward the momentum of previous data points. This momentum is represented by the AF, which incrementally adjusts, reflecting the acceleration of price movement as trends strengthen.
Divergence between the SAR and price is another critical aspect often overlooked. As the gap between the SAR value and the asset price widens, the stability of the trend is called into question. A narrowing gap, on the other hand, suggests an impending trend reversal, where the Parabolic SAR might soon breach the price level, indicating a need to reassess the current trading position.
| Condition | Implication for Traders |
|---|---|
| Widening Gap (SAR – Price) | Question trend stability |
| Narrowing Gap (Price approaches SAR) | Anticipate potential trend reversal |
Understanding the Extreme Point (EP) role is paramount. The EP acts as a rudder, steering the direction of the Parabolic SAR. It’s the EP’s continual updating that allows the SAR to capture the essence of the market’s trend, whether bullish or bearish. By setting new EPs, traders witness the SAR’s responsiveness to price changes, and can make informed decisions on whether to maintain or alter their market stance.
Furthermore, the AF’s upper limit of 0.20 acts as a governor, ensuring that the indicator does not become overly sensitive to minor price fluctuations, which could result in an erratic representation of the trend. By capping the AF, the formula maintains a balance between sensitivity and reliability, providing traders with a consistent gauge of trend momentum.
In essence, the Parabolic SAR formula’s design is such that it furnishes traders with a dynamic yet stable representation of market trends. By dissecting each component of the formula, traders can fine-tune their strategies to harness the full potential of the Parabolic SAR in diverse market conditions.
2.2. Adjusting Parabolic SAR Settings for Different Market Conditions
Adjusting the AF for Different Volatility Levels
In markets exhibiting high volatility, the Parabolic SAR’s sensitivity can be reduced by lowering the AF increment. Instead of the default increment of 0.02, a trader might opt for 0.01 or less. This adjustment slows down the rate at which the SAR converges towards the price, providing a buffer against whipsaws and false signals.
| Volatility Level | AF Increment Adjustment |
|---|---|
| High | Decrease AF increment (e.g., 0.01) |
| Low | Increase AF increment (e.g., 0.02 or higher) |
Conversely, in low volatility environments, increasing the AF increment can be beneficial. A higher AF increment, such as 0.025 or 0.03, makes the Parabolic SAR more responsive to price movements, allowing traders to capitalize on smaller trends.

Tailoring the EP for Trend Length
The Extreme Point (EP) is a critical component that can be tailored based on the anticipated length of trends. For assets known to trend over longer periods, the EP can be set using a wider timeframe’s high or low to filter short-term fluctuations. Conversely, for assets with shorter trend cycles, a shorter timeframe may be used to set the EP.
Balancing SAR Parameters
Effective use of the Parabolic SAR requires a delicate balance between the AF and EP settings. Overly aggressive settings can lead to premature entries and exits, while too conservative adjustments might result in missed opportunities.
| Setting | Aggressiveness | Potential Outcome |
|---|---|---|
| High AF with Short-term EP | Aggressive | Premature signals |
| Low AF with Long-term EP | Conservative | Delayed signals |
Traders must continuously monitor and adjust the Parabolic SAR settings to align with the asset’s price behavior and the prevailing market conditions. This dynamic approach enables the identification of optimal entry and exit points, enhancing trade outcomes.
2.3. Does Parabolic SAR Repaint and How Does This Affect Traders?
Does Parabolic SAR Repaint?
The term “repaint” in the context of technical indicators refers to the practice of an indicator altering its values for past periods. With the Parabolic SAR, there is no repainting in its traditional sense. Once a dot is placed for a completed time period, it remains fixed when viewed historically. This characteristic ensures that the signals it provides in real-time remain consistent when analyzed afterwards, preserving the integrity of historical data for backtesting strategies.
However, during the current period, the indicator is constantly recalculating and can move until the period closes. This real-time adjustment can sometimes be mistaken for repainting, but it is merely the indicator’s design to react dynamically to price changes as they occur.
Implications for Traders:
| Aspect | Impact on Trade Decision |
|---|---|
| No Historical Repaint | Reliable for backtesting strategies |
| Real-time Adjustment | Requires careful intraperiod analysis |
Traders should know that the Parabolic SAR’s position during an open period is not final. Decisions should not be based solely on the indicator’s position mid-period, as it may provide a different signal once the period concludes. This necessitates a cautious approach, especially for those who trade on shorter timeframes where the price can fluctuate significantly within a single period.
For traders utilizing the Parabolic SAR, understanding its behavior is crucial to avoid premature reactions to what may appear to be a trend reversal. Patience is required until the period closes to confirm the indicator’s signal. This understanding helps mitigate the risk of acting on false signals and execute more timely trades based on completed data points.
while the Parabolic SAR does not repaint in the traditional sense, its intraperiod adjustments are a fundamental feature that traders must consider. This characteristic affects trade timing and risk management, as it necessitates a wait for period closure to confirm signals, thereby impacting the decision-making process.
3. How Do You Use Parabolic SAR Effectively?
To leverage the Parabolic SAR for maximum efficacy, synchronization with prevailing market trends is crucial. Identify the market context—is it trending or ranging? Since the indicator thrives in trending environments, its application should be prioritized in such conditions. In ranging markets, the Parabolic SAR may produce suboptimal signals; hence, it’s advisable to pair it with other indicators such as the Average Directional Index (ADX) to gauge trend strength.
Combining with Other Indicators
Complementing the Parabolic SAR with indicators that identify market momentum, like the Relative Strength Index (RSI) or Moving Average Convergence Divergence (MACD), can enhance its effectiveness. These tools can confirm the signals provided by the Parabolic SAR, reducing the likelihood of false entries.
| Indicator | Function | Synergy with Parabolic SAR |
|---|---|---|
| ADX | Trend Strength | Validates trend presence for SAR application |
| RSI/MACD | Momentum | Confirms SAR signals with momentum cues |
Optimize the settings based on the asset and timeframe. While the default parameters (0.02 AF increment, 0.20 maximum) are a starting point, refinements may be required to align with the specific characteristics of the asset being traded. For example, a lower AF increment may be appropriate for a highly volatile asset to minimize false signals, while a higher increment could suit a less volatile asset to capture quicker trend changes.
Effective Risk Management
Incorporate the Parabolic SAR into risk management practices. Its ability to provide stop-loss levels allows for setting protective stops that move with the price, locking in profits and limiting downside risk. Moving the stop-loss to the SAR level with each new period can systematically manage risk while keeping the trade aligned with the market’s momentum.
| Trade Position | Parabolic SAR as a Stop-Loss |
|---|---|
| Long | Below current SAR (bullish trend) |
| Short | Above current SAR (bearish trend) |
Exit strategies can also benefit from the Parabolic SAR. A reversal of the SAR position—from below to above the price for a long position, or vice versa for a short position—can signal an opportune moment to close the trade. This method ensures exits are executed in harmony with the trend’s exhaustion, potentially maximizing gains from the position.
Market Entry Timing
For entry timing, wait for the Parabolic SAR to confirm a shift in trend direction before initiating a trade. A breach of the SAR dots by the price may indicate a trend change, but consider confirming this signal with volume indicators or candlestick patterns for added conviction.
| Market Condition | Parabolic SAR Confirmation |
|---|---|
| Trend Reversal | Breach of SAR by price |
| Entry Signal | Supported by volume or candlesticks |
The effective use of the Parabolic SAR extends beyond its standalone application. It involves strategic integration with other technical tools, meticulous optimization of its parameters, and a disciplined approach to risk management. By utilizing the Parabolic SAR within a comprehensive trading framework, traders can harness its full potential for trend analysis and trade execution.
3.1. Identifying Trend Directions with Parabolic SAR Indicator
Utilizing Parabolic SAR for Trend Direction
The Parabolic SAR excels in pinpointing trend direction, providing a visual guide through its placement in relation to price action. For bullish trends, SAR dots positioned below the price action affirm upward momentum, suggesting an environment conducive to long positions. Conversely, SAR dots above the candles in a bearish trend indicate downward momentum, typically prompting traders to consider short positions or exits from longs.
Trend Identification with Parabolic SAR:
| SAR Position | Trend Implication | Trading Action |
|---|---|---|
| Below Price | Bullish Trend | Consider Long Positions |
| Above Price | Bearish Trend | Consider Short Positions |
The indicator’s sensitivity to price movements can be harnessed to determine a trend’s strength and potential continuity. A tightening alignment of the SAR dots to the price suggests a strengthening trend, while a dispersion indicates a weakening trend that may be losing momentum.
Analyzing Parabolic SAR Dot Movement
The progression of SAR dots provides insight into trend velocity. Accelerating dot movement towards the price hints at an increasing trend momentum, often leading up to a potential reversal. On the flip side, a deceleration in dot movement away from the price signals a sustaining trend with less immediate risk of reversal.
Trend Momentum Analysis:
| Dot Movement | Trend Momentum | Implication |
|---|---|---|
| Accelerating Towards Price | Increasing | Possible Reversal Ahead |
| Decelerating Away from Price | Sustaining | Trend Likely to Continue |
For enhanced trend direction analysis, traders should monitor the frequency of SAR breaches by price. Frequent breaches can indicate a choppy, indecisive market, while rare occurrences affirm a stable trend. This observation should be factored into position sizing and risk assessment, adjusting strategies to current market behavior.
Adjusting to Market Behavior with Parabolic SAR
Adept traders adjust their use of the Parabolic SAR based on its feedback, remaining flexible to shifts in market dynamics. They may tighten stop-loss orders in sync with the SAR in a stable trend or widen them when the indicator suggests a possible reversal. This adaptive approach aligns trading tactics with the prevailing market conditions, potentially enhancing trade performance.
Adaptive Trading Tactics:
| Market Condition | SAR Feedback | Trade Adjustment |
|---|---|---|
| Stable Trend | Infrequent SAR Breaches | Tighten Stop-Loss |
| Possible Reversal | Accelerating SAR Movement | Widen Stop-Loss |
The Parabolic SAR’s role in identifying trend directions is a cornerstone of its utility. By observing the indicator’s behavior about price, traders can make informed decisions on market entry, trend strength assessment, and risk management. The key lies in interpreting the subtle cues the Parabolic SAR offers and integrating these insights into a broader trading strategy.
3.2. Timing Entries and Exits Using Parabolic SAR Strategy
Timing Precision with Parabolic SAR
Optimal entry points using the Parabolic SAR are pinpointed when the price breaches the SAR dots, signaling a potential trend reversal. For a long entry, this occurs when the price moves above the SAR dots that were previously above the price. Conversely, for a short entry, the price falling below the SAR dots that were below the price suggests an opportune moment to enter a trade.
Entry Signals:
| Position | SAR Breach | Action |
|---|---|---|
| Long | Price above SAR | Initiate Buy |
| Short | Price below SAR | Initiate Sell |
Exit Precision with Parabolic SAR
The Parabolic SAR is equally adept at signaling exit points. As the trend unfolds, the SAR dots will trail the price, providing a dynamic stop-loss level. An exit signal is generated when the SAR overtakes the price—this crossover triggers traders to close out their positions to capture gains or limit losses.
Exit Signals:
| Position | SAR Crossover | Action |
|---|---|---|
| Long | SAR above Price | Close Buy |
| Short | SAR below Price | Close Sell |
Timing exits is a delicate balance between locking in profits and allowing room for the trend to mature. A premature exit can result in leaving money on the table, while a delayed response might erode gains. Monitoring the pace at which the SAR dots approach the price can provide additional clues about the trend’s longevity and whether an exit is imminent.

Adaptive SAR Trailing Stop
Trailing stops based on the Parabolic SAR dots enable traders to remain in a position as long as the trend is in their favor. Adjusting stop-loss orders to align with each new SAR value can protect against reversals while allowing for the capture of extended price moves.
Trailing Stop Adjustment:
| Trade Progression | SAR Adjustment | Benefit |
|---|---|---|
| Trend Continuation | Stop-Loss follows SAR | Secure Unrealized Gains |
| Trend Reversal | Stop-Loss at SAR | Minimize Losses |
The Parabolic SAR’s utility in timing both entries and exits lies in its simplicity and direct correlation with price action, making it a preferred tool for trend-following strategies. By adhering to the signals provided by the SAR, traders can systematically manage their trades, entering and exiting with greater confidence and precision.
3.3. What Does Parabolic SAR Mean in Trade Management?
Trade Entry and Exit Efficiency
In trade management, the Parabolic SAR serves as a systematic tool to enhance the efficiency of trade entries and exits. Its value lies in the clear signals it provides for potential trend reversals, which can inform the timing of both market entry and exit strategies. By dictating dynamic stop-loss levels that adapt to price movements, the Parabolic SAR ensures traders can capitalize on trends while simultaneously managing downside risk.
Stop-Loss Optimization
The indicator’s role in setting stop-loss orders is pivotal for preserving capital. As the SAR dots follow the price trend, they offer a logical and market-responsive basis for stop-loss placement. This method of stop-loss adjustment allows traders to protect profits during a favorable trend and exit the market to prevent larger losses when the trend reverses.
| Trade Type | Stop-Loss Strategy | Result |
|---|---|---|
| Favorable Trend | Stop-Loss below SAR (Long) / above SAR (Short) | Profit Protection |
| Adverse Movement | Exit at SAR Breach | Loss Minimization |
Dynamic Trade Management
The Parabolic SAR’s real-time adaptation to market changes reflects in the active management of trades. Traders can leverage this dynamic nature to make informed decisions on the fly, adjusting their risk parameters in accordance with the immediate market conditions signaled by the SAR. This responsive approach to trade management aids in maintaining a suitable risk-reward ratio throughout the trade’s duration.
Enhanced Position Management
Position management is further refined using the Parabolic SAR by dictating trailing stops. The indicator provides a systematic approach to securing gains and managing trade exits without emotional bias. As the SAR dots ascend or descend with the price trend, they naturally guide the adjustment of trailing stops, enabling traders to maximize their market position’s potential.
Risk-Reward Balance
In essence, the Parabolic SAR’s implications for trade management revolve around its capacity to strike a balance between risk and reward. It offers traders a disciplined framework for managing trades, where the emphasis is placed on following the market’s lead, signaled by the SAR dots, rather than predicting its movements. This disciplined adherence to market-based cues assists traders in achieving consistency and objectivity in their trade management strategies.
4. What is the Best Parabolic SAR Strategy?
Trend Confirmation Strategy
The most effective Parabolic SAR strategy involves its combination with a trend confirmation tool, such as the 200-period moving average (MA). This duo filters out noise, with the Parabolic SAR providing trade signals aligned with the overall direction indicated by the MA. Trades are executed only when both the Parabolic SAR and the MA concur on the trend direction.
| Indicator | Role | Combined Strategy |
|---|---|---|
| 200-period MA | Trend Confirmation | Filters for Long-Term Trend Direction |
| Parabolic SAR | Trade Signal | Entry and Exit Points |
For instance, when the price is above the 200-period MA, indicating an uptrend, buy signals are considered valid if the Parabolic SAR is below the price. Conversely, sell signals during a downtrend (price below the MA) are validated by the Parabolic SAR being above the price.
Breakout Strategy
Another potent approach is the breakout strategy, where the Parabolic SAR is used to spot breakouts from consolidation patterns. When price action breaches a known resistance or support level, the Parabolic SAR dots flipping position can confirm the breakout’s validity.
Dual-Timeframe Analysis
Employing a dual-timeframe analysis enhances the strategy’s robustness. For example, a trader may use a longer timeframe to establish the overarching trend and shorter one-to-time entries and exits. A confluence of signals across timeframes increases the probability of successful trades.
| Timeframe | Purpose | Action |
|---|---|---|
| Longer | Trend Confirmation | Directional Bias |
| Shorter | Signal Timing | Precise Entry/Exit |
SAR and Stochastic Oscillator
Integrating the Parabolic SAR with the Stochastic Oscillator forms a strategy that excels in volatile markets. The stochastic provides overbought or oversold signals, while the Parabolic SAR indicates the potential start of a trend reversal. This combination allows traders to enter trades at the inception of momentum shifts, ideally positioned for the trend’s next leg.
| Indicator | Function | Synergy |
|---|---|---|
| Stochastic Oscillator | Overbought/Oversold Levels | Momentum Shifts |
| Parabolic SAR | Trend Reversal Signs | Confirmatory Signals |

Risk Management Integration
Lastly, integrating risk management parameters with the Parabolic SAR ensures sustainability. Traders may opt to set a maximum stop-loss distance from the SAR dots or employ a fixed risk percentage per trade. This disciplined approach manages potential losses while allowing for strategic trade management.
| Risk Parameter | Integration with SAR | Purpose |
|---|---|---|
| Stop-Loss Distance | Max Distance from SAR | Limits Adverse Impact |
| Risk Percentage | Fixed Percentage per Trade | Preserves Capital |
In determining the best Parabolic SAR strategy, one must consider market conditions, personal risk tolerance, and trading style. Strategies that marry the Parabolic SAR with trend-confirming indicators, adapt to multiple timeframes, and incorporate risk controls tend to offer a balanced approach, leading to sustainable trading performance.
4.1. How to Trade Parabolic SAR in Trending Markets
Optimal Application in Trending Markets
In trending markets, the Parabolic SAR performs optimally when aligned with the direction of the trend. Traders should capitalize on this by seeking entry points as the SAR confirms trend continuations. After a pullback, a resumed alignment of SAR dots beneath the price in an uptrend, or above in a downtrend, offers a strategic entry point. Here, the trader is not chasing the trend but rather joining it with confirmation.
| Market Trend | SAR Alignment | Action |
|---|---|---|
| Uptrend | SAR dots resume below price | Consider Long Entry |
| Downtrend | SAR dots resume above price | Consider Short Entry |
Harnessing SAR in Strong Trends
In strong trends, the acceleration factor of the Parabolic SAR can be adjusted to be more responsive. Increasing the acceleration factor expedites the SAR’s reaction to price changes, potentially allowing for a tighter trailing stop and greater capitalization on swift trend movements.
Synchronization with Trend Phases
The Parabolic SAR’s sensitivity to price allows traders to synchronize their trades with different phases of a trend. During the early and middle phases, when the trend is establishing or running, the SAR can provide a clear path for trailing stops. As trends mature and show signs of exhaustion, indicated by a flattening of the SAR dots, traders might consider tightening stops to protect against a pending reversal.
Adaptive SAR Parameters
Adaptive use of the Parabolic SAR involves customizing its parameters to suit the volatility and momentum of the trending market. For instance, in a market characterized by small, steady price increments, a lower acceleration factor prevents the SAR from being overly reactive, which could result in premature exits.
| Volatility Level | Acceleration Factor Adjustment | Rationale |
|---|---|---|
| Low | Decrease AF | Reduce Premature Exits |
| High | Increase AF | Capture Swift Price Moves |
Combining SAR with Trend Filters
For enhanced precision, combining the Parabolic SAR with trend filters such as moving averages can validate the robustness of a trend. A long-term moving average, like the 100-period or 200-period MA, can serve as an additional layer of confirmation. Trades are favored when the price is on the same side of the moving average as the SAR dots, indicating a confluence of trend signals.
| Trend Filter | Role | Combined Use with SAR |
|---|---|---|
| Long-Term MA | Confirm Trend Direction | Price and SAR on same side of MA |
Trading the Parabolic SAR in trending markets requires a nuanced approach that respects the market’s directional bias, adapts to its volatility, and employs additional trend confirmation tools to filter out false signals. By doing so, traders can enhance their probability of entering and exiting trades in harmony with the market’s movements.
4.2. Combining Parabolic SAR with Other Indicators
Confluence with Moving Averages
Incorporating moving averages (MAs) with the Parabolic SAR refines signal accuracy. The 50-period and 100-period MAs can act as immediate trend filters. When the SAR dots and price action are on the same side of these MAs, the trend’s validity is reinforced, reducing the likelihood of false signals.
| Moving Average | Trend Confirmation | SAR Alignment |
|---|---|---|
| 50-period MA | Short to Medium Trend | Price and SAR on Same Side |
| 100-period MA | Medium to Long Trend | Price and SAR on Same Side |
Momentum Gauged with RSI
The Relative Strength Index (RSI), when paired with the Parabolic SAR, gauges momentum. A reading above 70 suggests overbought conditions, while below 30 indicates oversold. The SAR’s signals can be filtered through these levels—only considering trade entries when the RSI is not signaling an extreme.
Volume Oscillators for Confirmation
Volume oscillators like the On-Balance Volume (OBV) can confirm the Parabolic SAR’s signals. An ascending OBV aligning with a bullish SAR signal implies buying pressure, while a descending OBV accompanying a bearish SAR signal shows selling pressure. This confluence increases the confidence in the trade.
Volatility Measured with ATR
The Average True Range (ATR) measures market volatility which can inform SAR parameter adjustment. A higher ATR may warrant a larger stop-loss margin, taking into account the greater market movement, while a lower ATR could allow for a tighter stop-loss, reflecting the reduced volatility.
MACD for Trend Strength
The Moving Average Convergence Divergence (MACD) serves as a trend strength indicator. When the MACD line crosses above the signal line, it indicates bullish momentum, complementing a bullish Parabolic SAR signal. Conversely, a bearish crossover can validate a bearish SAR signal.
| Indicator | Trend Strength | Parabolic SAR Confluence |
|---|---|---|
| MACD | Bullish/Bearish Momentum | Aligns with SAR Direction |
By combining the Parabolic SAR with other technical indicators, traders can filter out noise, confirm momentum, and tailor their strategies to the prevailing market conditions. This multi-faceted approach enhances decision-making and can lead to more robust trading outcomes.
4.3. Optimizing Parabolic SAR Settings for Maximum Effectiveness
Customizing the Acceleration Factor
Optimizing the Parabolic SAR begins with adjusting the acceleration factor (AF). By default, the AF starts at 0.02 and increases by 0.02 each time the extreme point makes a new high or low, capping typically at 0.20. However, these settings can be tailored to match the asset’s volatility and the trader’s risk appetite. A higher AF may suit aggressive traders or markets with pronounced trends, whereas a lower AF could benefit conservative traders or when trading within a range-bound market.
Acceleration Factor Settings:
| Market Condition | AF Setting | Impact |
|---|---|---|
| Pronounced Trend | Higher AF (e.g., 0.03 start) | Responsive SAR |
| Range-Bound | Lower AF (e.g., 0.01 start) | Smoother SAR |
Adjusting the Step and Maximum
The step increment and maximum AF are pivotal settings that control the sensitivity of the Parabolic SAR. The step influences how quickly the SAR approaches the price, while the maximum limits the AF’s growth, directly affecting the trailing stop’s tightness. Traders might experiment with a range of step increments to find a balance that provides timely signals without excessive whipsaws.
Step and Maximum Adjustments:
| Parameter | Adjustment | Consideration |
|---|---|---|
| Step Increment | Smaller or Larger Steps | Signal Sensitivity |
| Maximum AF | Lower or Higher Cap | Trailing Stop Tightness |
Market-Specific Calibration
Each market exhibits unique characteristics; hence, the Parabolic SAR’s parameters should be calibrated accordingly. For instance, securities with erratic price movements may require a more conservative setup to avoid premature exits, while those with smoother trends could accommodate a more aggressive stance. Backtesting plays a crucial role in determining the optimal settings for a specific market, ensuring that the adjustments align with historical price behavior.
Backtesting for Market Calibration:
| Security Type | Parameter Tuning | Backtesting Outcome |
|---|---|---|
| Erratic Price Movements | Conservative Settings | Reduced False Exits |
| Smooth Trends | Aggressive Settings | Enhanced Trend Capture |
Real-Time Adjustment Considerations
The Parabolic SAR is not a set-and-forget tool; it demands real-time adjustments to maintain effectiveness. Traders should remain vigilant, ready to modify the settings as market conditions evolve. This may involve quick recalibration in response to sudden market news or shifts in volatility, ensuring that the SAR remains an accurate reflection of the current trading landscape.
Real-Time Adjustment Strategy:
| Market Shift | Response | Goal |
|---|---|---|
| Increased Volatility | Adjust AF and Maximum | Maintain Accuracy |
| Decreased Volatility | Fine-Tune for Sensitivity | Avoid Overreaction |
Synergy with Supplementary Indicators
While optimizing the Parabolic SAR, integrating supplementary indicators can enhance its effectiveness. For example, a volatility indicator such as the ATR can inform the appropriate SAR settings by providing a gauge of the market’s current volatility state. Simultaneously, a trend confirmation indicator might refine entry and exit points signaled by the SAR.
Supplementary Indicator Synergy:
| Indicator | Function | Optimization Role |
|---|---|---|
| ATR | Volatility Gauge | Inform SAR Settings |
| Trend Confirmation Indicator | Entry/Exit Refinement | Complement SAR Signals |
By meticulously adjusting the Parabolic SAR settings to the market’s rhythm and employing a holistic approach with additional technical tools, traders can optimize the indicator’s performance, thereby enhancing their trading strategy’s overall effectiveness.
5. Does Parabolic SAR Work in Forex?
The Parabolic SAR is particularly well-suited to the Forex market due to its ability to decipher trends in a time frame notorious for rapid fluctuations. Forex traders often operate in a 24-hour market environment, which means that the Parabolic SAR’s strength in identifying trend continuations and reversals is invaluable for navigating trades across different sessions – from Asia to London to New York.
Currency Pair Volatility
Different currency pairs exhibit varying levels of volatility, which can affect the Parabolic SAR’s performance. For major pairs that are less volatile, a standard AF setting might suffice. However, for more volatile pairs or during times of significant news releases, traders might alter the AF to better suit the prevailing market conditions.
| Currency Pair | Volatility | Suggested AF Adjustment |
|---|---|---|
| EUR/USD (Major) | Lower | Standard AF (e.g., 0.02) |
| GBP/JPY (Cross) | Higher | Adjusted AF (e.g., 0.03) |
Forex Market Phases
Forex markets can transition through various phases, from trending to consolidation. The Parabolic SAR’s utility shines in trending phases, where clear directional movement is present. During consolidation or range-bound phases, the indicator may generate whipsaws, leading to potential false signals. Forex traders often combine the SAR with other indicators like the ADX to discern the market phase and adjust their strategies accordingly.
Leverage and Margin Impact
Forex trading often involves significant leverage, amplifying both gains and losses. The Parabolic SAR can serve as a critical tool for managing risk in a leveraged environment by providing systematic exit points. Traders can employ the SAR to manage positions actively, ensuring that leverage does not lead to disproportionate losses.
Customization for Forex
Customizing the Parabolic SAR settings to align with a trader’s specific Forex strategy and risk profile is essential. Given the diversity of trading styles – from scalping to swing trading – the SAR parameters must be adapted to fit the time horizon and risk tolerance of the individual trader. This customization ensures that the indicator is not overly sensitive for long-term traders or too lagging for those seeking quick trades.
Forex Strategy Customization:
| Trading Style | Time Horizon | SAR Parameter Customization |
|---|---|---|
| Scalping | Short | Higher AF for Responsiveness |
| Swing Trading | Medium to Long | Lower AF for Stability |
5.1. What is Parabolic SAR in Forex and Its Unique Challenges
The Parabolic SAR (Stop and Reverse) serves as a compelling indicator in the Forex market, tracing potential price direction and offering exit and entry points. Its calculation hinges on the price’s extreme points, with an acceleration factor that intensifies as the trend continues. In Forex, where currency pairs can move swiftly and unpredictably, the Parabolic SAR’s role is to delineate these movements in a way that can be tactically leveraged by traders.
Forex markets present specific challenges that can affect the Parabolic SAR’s efficacy. Erratic price swings caused by economic reports, geopolitical events, or central bank announcements can lead to false signals. The indicator’s sensitivity settings must be finely tuned to mitigate such risks, ensuring that the SAR dots accurately reflect genuine market shifts rather than noise.
| Challenge | Impact on Parabolic SAR | Mitigation Strategy |
|---|---|---|
| Rapid Price Swings | Potential False Signals | Adjust Sensitivity Settings |
| 24-Hour Market | Continuous Signal Generation | Filter with Additional Indicators |
| High Leverage | Amplified Risk | Employ as Risk Management Tool |
Operating in a 24-hour market cycle, the Parabolic SAR generates signals round-the-clock, which requires traders to discern between actionable trends and short-lived fluctuations. The integration of additional indicators is often necessary to filter the signals that the Parabolic SAR presents, particularly during low liquidity times when market movements can be more erratic.
Forex trading often involves higher leverage, which can magnify both profits and losses. The Parabolic SAR’s function as a risk management tool becomes even more critical under these conditions. Traders must calibrate the SAR settings to align with their risk thresholds, using the indicator to signal timely exits before minor retracements transform into significant losses.
5.2. Evaluating the Effectiveness of Parabolic SAR in Currency Trading
Quantitative Assessment
Evaluating the Parabolic SAR in currency trading often begins with a quantitative assessment where historical data is scrutinized. Backtesting strategies using the Parabolic SAR against historical price movements of currency pairs is a common method. Traders analyze the success rate of signals, looking at the percentage of profitable trades versus losing trades. This data-driven approach provides an empirical basis for determining the Parabolic SAR’s predictive power within the forex market.
| Currency Pair | Profitable Trades (%) | Losing Trades (%) |
|---|---|---|
| EUR/USD | 60 | 40 |
| USD/JPY | 55 | 45 |
| AUD/USD | 65 | 35 |
Qualitative Analysis
Beyond numbers, qualitative analysis is crucial. Traders observe how the indicator reacts to major economic events, such as interest rate changes or employment reports, which can cause significant price spikes. The Parabolic SAR’s ability to filter out market noise and maintain reliable signals during such events is a testament to its effectiveness.
Practical Trading Scenarios
In practical trading scenarios, the real-time application of the Parabolic SAR is put to the test. Traders monitor the indicator’s performance across various market conditions—trending, ranging, and breakout phases. The Parabolic SAR’s utility in providing clear exit and entry points, especially in trending markets, is a key measure of its value to currency traders.
Cross-Analysis with Other Indicators
Finally, the Parabolic SAR’s effectiveness is often cross-analyzed with other indicators. This synergy helps to confirm or refute the signals it generates. For instance, when the Parabolic SAR signals a buy in an uptrend confirmed by a rising MACD, the likelihood of a successful trade increases.
| Indicator | Confirmation | Parabolic SAR Signal |
|---|---|---|
| MACD | Bullish Crossover | Buy Signal |
| RSI | Not Overbought | Buy Signal |
Evaluating the Parabolic SAR in currency trading is an ongoing process that combines backtesting, real-time application, and cross-analysis with other indicators. The indicator’s adaptability to various market conditions and its integration with a trader’s broader strategy are essential factors in its overall effectiveness.
5.3. How to Adapt Parabolic SAR Strategy for Forex Market Volatility
Dynamic Adjustment to Volatility
Adapting the Parabolic SAR for Forex market volatility requires a dynamic strategy. Volatility levels vary not just from one currency pair to another but also within the same pair from hour to hour, influenced by news events, market openings, and liquidity flows. The key to adapting the Parabolic SAR lies in adjusting its sensitivity through the acceleration factor (AF) and the step increment. During high volatility periods, a reduced AF and a smaller step increment can prevent the SAR from reacting too quickly to price spikes, minimizing the risk of false signals.
| Volatility Condition | Acceleration Factor | Step Increment | Expected Outcome |
|---|---|---|---|
| High Volatility | Reduced (e.g., 0.01) | Smaller (e.g., 0.01) | Stable SAR, Less Whipsaws |
| Low Volatility | Increased (e.g., 0.03) | Larger (e.g., 0.02) | Responsive SAR, Timely Signals |
Intraday Volatility Patterns
Traders must be aware of intraday volatility patterns—currencies may be more volatile during specific trading sessions. For instance, the EUR/JPY might see heightened movement during the overlap of the European and Asian sessions. Adapting the Parabolic SAR for these patterns involves fine-tuning the parameters before entering these volatile windows, potentially increasing the AF for more responsiveness if the trend’s direction is clear.
Correlation with News Events
Forex markets are particularly sensitive to scheduled economic releases and unexpected news events. Traders can adapt the Parabolic SAR by temporarily widening the step increment before such events to accommodate the anticipated surge in volatility. This approach allows the SAR to maintain its relevance without being prematurely stopped out by erratic price movements.
Scheduled News Adaptation:
| Event Type | Pre-Event SAR Setting | Rationale |
|---|---|---|
| Economic Release | Wider Step Increment | Tolerate Volatility Spike |
| Geopolitical News | Monitor and Adjust Post-Event | Respond to New Trend Formation |
Combination with Volatility Indicators
Employing volatility indicators like the ATR alongside the Parabolic SAR can provide a more nuanced approach to managing Forex volatility. The ATR helps in quantifying the current market volatility, guiding traders on how to adjust the Parabolic SAR settings in real-time. A higher ATR reading might suggest a need for a more conservative SAR setting, whereas a lower ATR could indicate that a more aggressive stance could be taken.
Continuous Evaluation and Adjustment
Continuous evaluation and adjustment are vital. The Parabolic SAR is not a static tool; it requires ongoing recalibration to align with the Forex market’s volatility. Traders should consistently review the effectiveness of their SAR settings and be ready to adjust them in response to feedback from the market’s behavior.
Continuous Adjustment Framework:
| Market Feedback | Adjustment Action | Purpose |
|---|---|---|
| Frequent SAR Reversals | Increase Step Increment | Reduce Sensitivity |
| Missed Trend Opportunities | Decrease Step Increment | Increase Responsiveness |
By actively managing the settings of the Parabolic SAR in response to Forex market volatility, traders can preserve the integrity of their trading signals, ensuring that their strategies remain both reactive to genuine trends and resilient against false movements.