1. Overview of Depth Charts
Depth charts are a critical tool for anyone involved in cryptocurrency trading, offering a real-time visual representation of the market’s supply and demand dynamics. These charts, often overlooked by novice traders, provide valuable insights into market sentiment and liquidity, making them indispensable for making informed trading decisions. For crypto traders, understanding depth charts is not just about reading numbers; it’s about interpreting the ebb and flow of market forces that can indicate potential opportunities or risks.
The importance of depth charts in crypto trading cannot be overstated. Unlike traditional financial markets, where trading data is often aggregated and delayed, the cryptocurrency market operates on a more transparent and immediate basis. This transparency allows traders to see the order book—the collection of all buy and sell orders for a particular asset—directly through depth charts. By doing so, traders can gauge the current market environment, identify potential support and resistance levels, and anticipate significant price movements.
| Key Point | Explanation |
|---|---|
| Overview of Depth Charts | Depth charts visually represent the market’s supply and demand in real-time. |
| Importance for Crypto Traders | Crucial for understanding market liquidity, sentiment, and identifying trading opportunities. |
| Transparency in Crypto Markets | Crypto markets offer real-time, transparent data, making depth charts an essential tool for traders. |
| Goal of the Article | To provide a comprehensive guide on depth charts, from basic understanding to advanced trading strategies. |
2. Understanding Depth Charts
2.1. What is a Depth Chart?
A depth chart is a graphical representation of the order book for a specific cryptocurrency on an exchange. It displays the cumulative value of buy and sell orders at different price levels, providing a real-time view of market sentiment, liquidity, and potential price movement. In essence, a depth chart helps traders visualize the supply and demand in the market, illustrating the volume of buy and sell orders pending execution at various prices.
The X-axis of a depth chart represents the price levels, while the Y-axis shows the cumulative number of orders at each price point. On the chart, the left side typically shows the buy orders (bids), and the right side displays the sell orders (asks). The point where the two sides converge is known as the market price—the price at which the most recent trade was executed.
2.2. Components of a Depth Chart: Bid and Ask Orders, Order Book
To understand a depth chart, it is crucial to grasp its main components—bid orders, ask orders, and the order book.
Bid Orders (Buy Orders):
Bid orders represent the prices that buyers are willing to pay for a cryptocurrency. These orders appear on the left side of the depth chart. Each level of the bid curve corresponds to a specific price where traders are willing to buy a certain quantity of the asset. As the price decreases, the number of buy orders typically increases, reflecting the fact that more traders are willing to buy at lower prices.
Ask Orders (Sell Orders):
Ask orders are the opposite of bid orders; they represent the prices at which sellers are willing to part with their cryptocurrency. The ask orders appear on the right side of the chart. Similar to bids, the ask curve increases as prices rise, meaning more sellers are willing to sell their assets at higher prices.
Order Book:
The order book is essentially the foundation of the depth chart. It contains all the buy (bid) and sell (ask) orders for a given asset. Each order is placed by a trader at a specific price and amount. The depth chart visualizes this data by stacking orders in a cumulative fashion, allowing traders to see the total volume of buy and sell orders at each price point. The order book is dynamic, constantly changing as new orders are placed, filled, or canceled. This continuous flow of information provides traders with a real-time snapshot of market activity.
2.3. How Depth Charts Represent Market Liquidity and Supply/Demand
One of the key functions of a depth chart is to illustrate the market’s liquidity and the balance between supply and demand. Liquidity refers to how easily an asset can be bought or sold without causing significant price fluctuations. A highly liquid market will have a large number of buy and sell orders at various price points, creating smooth curves on the depth chart. Conversely, a market with low liquidity will show steep, jagged curves, indicating that there are fewer orders at each price level, making it easier for large trades to impact the price.
The relationship between supply and demand is visually represented by the steepness and shape of the bid and ask curves. When there is a greater demand for a cryptocurrency, the bid curve may rise sharply as buyers are willing to pay higher prices. On the other hand, when there is greater supply, the ask curve becomes steeper as sellers are eager to offload their assets at increasingly lower prices.
The point where the bid and ask curves converge is a critical indicator of market equilibrium or imbalance. If the bid curve is steeper than the ask curve, it suggests strong buying pressure (demand exceeds supply), which may push prices higher. Conversely, a steeper ask curve indicates stronger selling pressure (supply exceeds demand), potentially leading to a price decline.
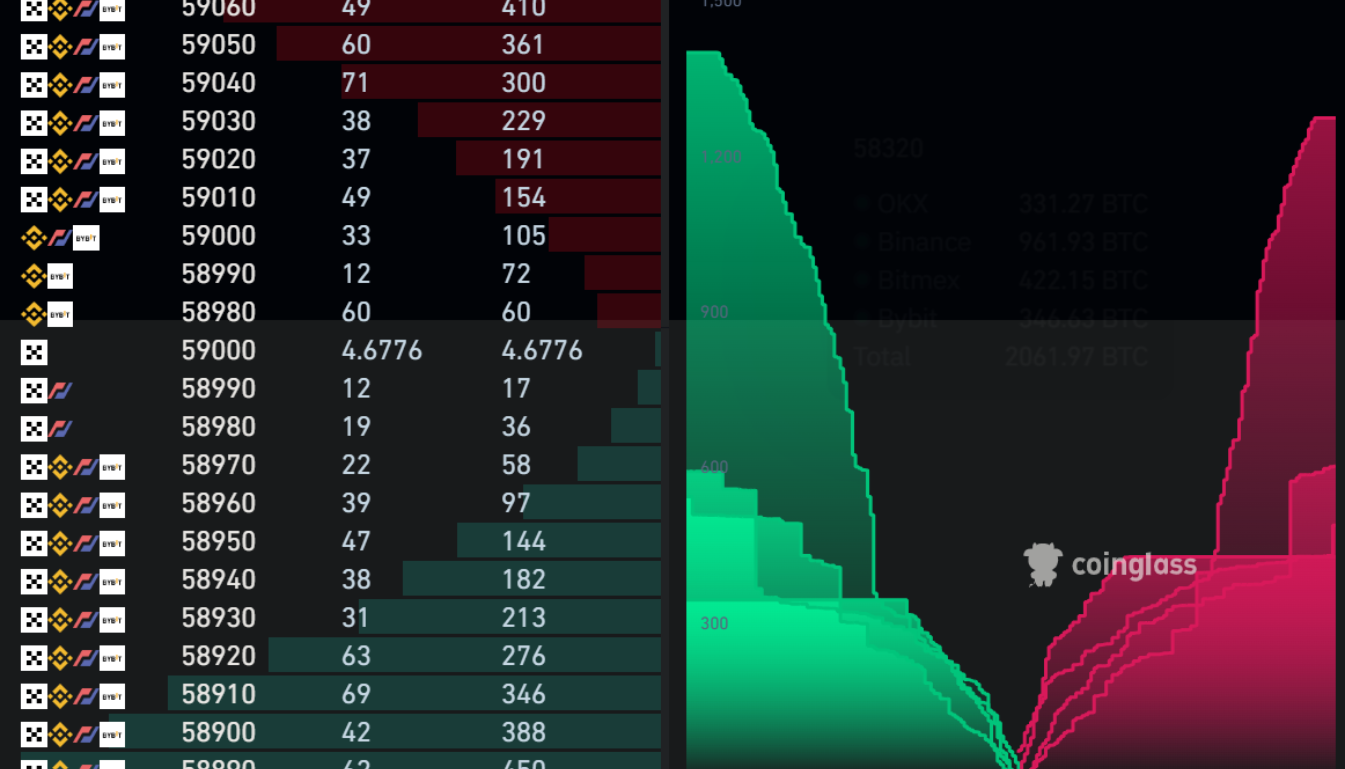
2.4. Example: Real-World Visualization
Imagine a depth chart for Bitcoin on a popular exchange. The bid orders form a rising curve on the left, indicating that traders are willing to buy Bitcoin at decreasing prices. As you move along the curve, the cumulative number of orders increases, showing stronger buying interest at lower price levels. On the right, the ask orders form a descending curve, indicating that sellers are willing to part with their Bitcoin at increasing prices. The point where these two curves meet is the current market price of Bitcoin.
If the bid curve were to rise significantly higher than the ask curve, this would signal strong demand, and traders might anticipate a price increase. Conversely, if the ask curve steepened sharply, it would suggest excess supply, possibly leading to a price drop. By examining the depth chart, traders can make informed decisions about entering or exiting positions based on the market’s current liquidity and supply/demand dynamics.
| Component | Explanation |
|---|---|
| Depth Chart | Graphical representation of the order book, displaying cumulative buy and sell orders at different prices. |
| Bid Orders (Buy Orders) | Prices and quantities buyers are willing to pay for an asset; represented on the left side of the chart. |
| Ask Orders (Sell Orders) | Prices and quantities sellers are willing to accept for an asset; shown on the right side of the chart. |
| Order Book | Collection of all buy and sell orders, forming the basis of the depth chart. |
| Market Liquidity | Refers to the ease of buying/selling an asset without significantly affecting its price. |
| Supply and Demand Representation | Illustrated through the shapes and steepness of the bid and ask curves, indicating market pressure. |
3. Analyzing Depth Charts
3.1. Identifying Support and Resistance Levels
One of the primary uses of a depth chart in cryptocurrency trading is to identify support and resistance levels, which are crucial for making informed trading decisions. Support levels are price points where the demand for an asset is strong enough to prevent the price from falling further. These levels are often represented on a depth chart by a significant concentration of bid orders (buy orders) at or around a specific price. When the price of an asset approaches this level, it tends to stabilize or bounce back up, as buyers step in to purchase the asset at what they perceive to be a favorable price.
Resistance levels, on the other hand, are price points where selling pressure (supply) is strong enough to prevent the price from rising further. On a depth chart, these are indicated by a high concentration of ask orders (sell orders) at a particular price. As the asset’s price nears this level, it may struggle to break through, as sellers are eager to offload their holdings at what they consider to be a profitable price.
By analyzing the depth chart, traders can identify these levels and make strategic decisions, such as setting entry or exit points for their trades. For instance, if a trader sees a strong support level on the depth chart, they might decide to buy the asset, anticipating a price increase. Conversely, if a significant resistance level is detected, a trader might choose to sell or avoid buying, expecting the price to struggle to rise beyond that point.
3.2. Recognizing Market Sentiment (Buy or Sell Pressure)
Depth charts are also effective tools for gauging overall market sentiment, helping traders determine whether there is more buy or sell pressure at any given time. Market sentiment can be inferred by examining the relative steepness and volume of bid and ask orders.
Buy Pressure:
When the depth chart shows a large number of bid orders at various price levels, it indicates strong buy pressure. This situation suggests that many traders believe the asset is undervalued at its current price and are willing to buy it. A steep bid curve, especially if it is significantly larger than the ask curve, indicates bullish sentiment, where the market expects prices to rise.
Sell Pressure:
Conversely, if the depth chart displays a large number of ask orders, this indicates strong sell pressure. In this case, many traders may believe the asset is overvalued, leading them to sell. A steep ask curve, especially if it dwarfs the bid curve, signals bearish sentiment, where the market expects prices to decline.
Recognizing this buy or sell pressure can help traders align their strategies with the prevailing market conditions. For example, in a market with strong buy pressure, traders might opt to hold onto their assets or buy more, anticipating price increases. On the other hand, strong sell pressure might prompt them to sell before the price drops further.
3.3. Detecting Potential Price Reversals or Breakouts
Depth charts can also be instrumental in detecting potential price reversals or breakouts, which are key moments for making profitable trades. A price reversal occurs when an asset’s price changes direction after reaching a peak or a trough, while a breakout happens when the price moves beyond a previously established support or resistance level.
Price Reversals:
Traders can often spot potential reversals by analyzing shifts in the depth chart. For instance, if a significant number of buy orders suddenly appear near a support level after a period of declining prices, it might indicate that the downtrend is losing momentum and a reversal is imminent. Similarly, if sell orders start piling up after a price surge, it could signal that the upward trend is nearing its end.
Breakouts:
Breakouts are often preceded by a buildup of orders near a key support or resistance level. If a large number of buy orders are placed just below a resistance level, it might indicate that buyers are gearing up for a breakout, expecting the price to rise above this level. Conversely, a cluster of sell orders just above a support level could signal an impending breakdown, where the price falls below this level.
Detecting these moments through depth chart analysis allows traders to enter or exit positions at the most opportune times, maximizing their potential profits or minimizing losses.
3.4. Understanding the Impact of Large Orders
Large orders, sometimes referred to as “whale” orders, can have a significant impact on the depth chart and, consequently, on the market itself. These large buy or sell orders can create sharp spikes in the depth chart, distorting the usual smoothness of the bid and ask curves.
Large Buy Orders:
When a large buy order appears on the depth chart, it often creates a steep rise in the bid curve. This can signal to other traders that there is strong buying interest at that particular price level, which might lead to a broader buying spree. In some cases, the presence of a large buy order can push the price up as sellers raise their ask prices in response to the perceived demand.
Large Sell Orders:
Conversely, a large sell order can create a sharp spike in the ask curve. This can indicate strong selling pressure, which might trigger panic among other traders, leading to a cascade of sell orders and a subsequent drop in the asset’s price.
Understanding the impact of these large orders is crucial for traders, as they can often lead to significant price movements. By monitoring the depth chart for these large orders, traders can anticipate potential market shifts and adjust their strategies accordingly.
3.5. Using Depth Charts in Conjunction with Other Technical Indicators
While depth charts provide valuable insights, they are most effective when used in conjunction with other technical indicators. This combined approach offers a more comprehensive view of the market, helping traders make more informed decisions.
For example, a trader might use depth charts to identify support and resistance levels while also employing moving averages to confirm the trend direction. Similarly, depth charts can be paired with indicators like the Relative Strength Index (RSI) or the Moving Average Convergence Divergence (MACD) to better understand market momentum and potential overbought or oversold conditions.
By integrating depth chart analysis with other technical tools, traders can develop more robust trading strategies that account for various market factors, reducing the risk of relying on a single indicator.
| Analysis Aspect | Explanation |
|---|---|
| Identifying Support and Resistance Levels | Depth charts help spot key price levels where demand (support) or supply (resistance) is concentrated. |
| Recognizing Market Sentiment | The relative steepness of bid and ask curves reveals whether buy or sell pressure is dominant. |
| Detecting Potential Price Reversals/Breakouts | Depth charts highlight moments where price trends might reverse or break through established support/resistance. |
| Understanding the Impact of Large Orders | Large buy or sell orders can create significant market movements, visible as sharp spikes in the depth chart. |
| Using Depth Charts with Other Indicators | Combining depth charts with other technical indicators provides a more complete market analysis. |
4. Depth Chart Trading Strategies
4.1. Day Trading with Depth Charts
Day trading involves buying and selling assets within the same day, capitalizing on small price movements. Depth charts are particularly useful in day trading because they provide a real-time view of market conditions, allowing traders to make quick decisions based on the latest data.
Strategy Overview: Day traders use depth charts to identify short-term trading opportunities by closely monitoring the bid and ask orders. They look for significant imbalances between buy and sell orders, which might indicate an imminent price move. For example, if the depth chart shows a sudden spike in buy orders (a steep bid curve), a day trader might anticipate a price increase and decide to buy the asset. Conversely, if a large number of sell orders appear (a steep ask curve), the trader might short-sell the asset, expecting the price to drop.
Execution Tips:
- Quick Decision-Making: Day traders must act quickly on the information provided by depth charts, as opportunities can vanish within minutes or even seconds.
- Setting Stop-Loss Orders: Given the volatility, it’s crucial to set stop-loss orders to limit potential losses if the market moves against the trade.
- Volume Consideration: Traders often consider not just the number of orders but also the volume behind those orders. A high volume of orders at a particular price level can reinforce the potential for a price movement.
4.2. Swing Trading Using Depth Charts
Swing trading focuses on capturing price swings over a few days to weeks, rather than minute-by-minute fluctuations. Depth charts can help swing traders identify trends and entry or exit points by analyzing the broader market sentiment and liquidity.
Strategy Overview: Swing traders use depth charts to spot areas where the market may be overextended and due for a correction or continuation. For instance, after a significant price run-up, a depth chart showing a buildup of sell orders at a resistance level might signal that the upward momentum is waning, providing a good exit point. Conversely, if a depth chart reveals a strong support level with accumulating buy orders, it might indicate a good entry point for a swing trade.
Execution Tips:
- Trend Identification: Swing traders should use depth charts in conjunction with trend indicators like moving averages to confirm the overall market direction before placing trades.
- Patience in Execution: Unlike day trading, swing trading requires patience to allow trades to develop over several days or weeks, as the strategy aims to capture more significant price movements.
- Volume Analysis: Monitoring the volume behind bid and ask orders helps in confirming the strength of the anticipated price swing.
4.3. Scalping Based on Depth Chart Analysis
Scalping is a high-frequency trading strategy where traders aim to profit from small price changes over very short timeframes. Depth charts are vital for scalpers as they provide the granular data needed to execute multiple trades within a short period.
Strategy Overview: Scalpers rely on depth charts to identify minor price discrepancies that they can exploit for quick profits. They focus on the tight bid-ask spreads and look for sudden changes in the depth chart, such as a quick influx of buy or sell orders, to enter and exit positions rapidly. Scalping requires precision and speed, as traders aim to profit from small price changes repeatedly throughout the trading session.
Execution Tips:
- Tight Spreads: Scalpers should focus on assets with narrow bid-ask spreads, as these offer more frequent opportunities for small profits.
- High Liquidity: Trading in highly liquid markets ensures that trades can be executed quickly without significant price slippage.
- Automated Tools: Given the speed required, many scalpers use automated trading tools that execute trades based on predefined criteria observed on depth charts.
4.4. Arbitrage Opportunities Using Depth Charts
Arbitrage involves taking advantage of price discrepancies for the same asset across different markets or exchanges. Depth charts can help traders identify these discrepancies and execute trades to profit from them.
Strategy Overview: Arbitrage traders monitor depth charts across multiple exchanges to spot differences in bid and ask prices for the same cryptocurrency. For instance, if Bitcoin is selling for $30,000 on one exchange but can be bought for $29,800 on another, an arbitrage trader can buy at the lower price and sell at the higher one, pocketing the difference. Depth charts provide the real-time data needed to spot these opportunities before they vanish due to market adjustments.
Execution Tips:
- Real-Time Monitoring: Successful arbitrage requires constant monitoring of multiple depth charts across various exchanges to quickly spot and act on price discrepancies.
- Fast Execution: Speed is critical, as arbitrage opportunities often disappear quickly once other traders notice the discrepancy.
- Considering Fees: Traders must account for transaction fees on each exchange, as these can eat into arbitrage profits, especially in low-margin trades.
| Trading Strategy | Explanation |
|---|---|
| Day Trading with Depth Charts | Focuses on short-term trades within the same day, using depth charts to capitalize on rapid price movements. |
| Swing Trading Using Depth Charts | Targets price swings over several days or weeks, using depth charts to identify trends and key price levels. |
| Scalping Based on Depth Chart Analysis | A high-frequency strategy aiming for small profits from numerous trades, relying on depth charts for quick entries and exits. |
| Arbitrage Opportunities Using Depth Charts | Involves profiting from price discrepancies across different markets, using depth charts to identify and exploit these opportunities. |
5. Best Practices for Using Depth Charts
5.1. Tips for Reading Depth Charts Effectively
To maximize the benefits of using depth charts in cryptocurrency trading, traders should focus on mastering the interpretation of the data presented. Effective reading of depth charts involves understanding the nuances that can signal market movements and help in making informed decisions.
Focus on the Order Book Dynamics:
A depth chart provides a visual representation of the order book, which is constantly changing as new orders are placed and existing orders are filled or canceled. Pay attention to the flow of orders and how quickly the bid and ask levels change. Rapid fluctuations might indicate high market activity and potential price volatility.
Look for Large Orders (Whale Activity):
Large buy or sell orders can significantly impact the market by creating psychological pressure on other traders. Spotting these “whale” orders early can give you an edge in anticipating market moves. If a large buy order appears, it might push the price up, while a large sell order could drive the price down.
Monitor Support and Resistance Zones:
Use depth charts to identify key support and resistance levels where large clusters of buy or sell orders exist. These levels often act as psychological barriers, and observing how the market behaves as prices approach these levels can provide clues about future price direction.
Watch for Order Imbalances:
An imbalance between bid and ask orders can indicate upcoming price movements. If there are significantly more buy orders than sell orders at a certain price level, it could suggest upward pressure on the price, and vice versa for a surplus of sell orders.
Consider the Overall Market Context:
Depth charts are most effective when interpreted within the broader context of market trends and sentiment. Use them alongside other technical indicators and market news to ensure your analysis is well-rounded and not solely reliant on one data source.
Common Mistakes to Avoid
Even seasoned traders can fall into common pitfalls when using depth charts. Understanding these mistakes can help you avoid them and improve your trading outcomes.
Over-Reliance on Depth Charts Alone:
While depth charts provide valuable insights, they should not be the sole basis for trading decisions. Relying exclusively on depth charts without considering other technical indicators, market news, or fundamental analysis can lead to misinformed trades.
Misinterpreting Large Orders:
Not all large orders indicate a clear market direction. Sometimes, large orders are placed strategically to create false signals or “spoof” the market. Traders should be cautious and consider the possibility of market manipulation before reacting to large orders on a depth chart.
Ignoring Market Liquidity:
In markets with low liquidity, depth charts can be misleading. A few large orders can drastically alter the chart’s appearance, giving a false sense of market direction. Always consider the overall liquidity of the market when interpreting depth charts.
Failing to Adapt to Market Conditions:
Markets can change rapidly, especially in the volatile world of cryptocurrencies. What might appear as a strong support or resistance level on a depth chart can quickly change as new information enters the market. Traders must be agile and willing to adapt their strategies as conditions evolve.
Not Accounting for Trading Fees:
When using strategies like scalping or arbitrage, failing to consider trading fees can turn a seemingly profitable trade into a loss. Always factor in the cost of executing trades when analyzing potential opportunities on a depth chart.
5.2. Tools and Resources for Depth Chart Analysis
To effectively use depth charts in cryptocurrency trading, leveraging the right tools and resources is essential. Various platforms and applications provide enhanced depth chart analysis capabilities, helping traders make more informed decisions.
Cryptocurrency Exchange Platforms:
Most major cryptocurrency exchanges, such as Binance, Coinbase Pro, and Kraken, offer built-in depth charts as part of their trading interfaces. These charts are updated in real-time and provide the necessary data to analyze market depth and order flow directly on the platform where you execute trades.
Advanced Trading Platforms:
Platforms like TradingView and Coinigy offer more sophisticated tools for analyzing depth charts. These platforms allow for the integration of multiple data sources and technical indicators, providing a comprehensive view of the market. TradingView, for instance, offers customizable depth chart widgets that can be tailored to fit specific trading strategies.
Market Data Aggregators:
Sites like CoinMarketCap and CoinGecko provide aggregated market data, including depth charts across multiple exchanges. These tools are particularly useful for arbitrage traders who need to compare prices and order book depth across different platforms quickly.
Automated Trading Bots:
For traders interested in high-frequency trading or scalping, automated trading bots like HaasOnline and 3Commas can be configured to use depth chart data as part of their trading algorithms. These bots can execute trades based on predefined criteria, ensuring fast and efficient order execution.
Educational Resources and Communities:
Learning to read and interpret depth charts effectively often requires practice and guidance. Online communities, such as those on Reddit or specialized forums, provide a wealth of knowledge where traders share tips and strategies. Additionally, many trading platforms offer educational content, including webinars and tutorials on depth chart analysis.
| Practice | Explanation |
|---|---|
| Effective Reading Tips | Focus on order book dynamics, large orders, support/resistance zones, order imbalances, and overall market context. |
| Common Mistakes to Avoid | Avoid over-reliance on depth charts, misinterpreting large orders, ignoring market liquidity, and not adapting to market changes. |
| Tools and Resources | Utilize exchange platforms, advanced trading tools, market data aggregators, automated bots, and educational resources for better depth chart analysis. |
Conclusion
Depth charts are an essential tool for cryptocurrency traders, providing a visual representation of market dynamics that can inform strategic trading decisions. By understanding how to read and analyze depth charts, traders can gain insights into market liquidity, supply and demand, and potential price movements, all of which are crucial for successful trading.
Throughout this article, we have explored the components of depth charts, including bid and ask orders and the order book, which form the foundation for understanding market activity. We discussed how depth charts represent market liquidity and the balance between supply and demand, offering traders a clear view of potential support and resistance levels.
In the analysis section, we delved into how depth charts can be used to identify key trading opportunities, such as detecting market sentiment, recognizing potential price reversals or breakouts, and understanding the impact of large orders on market movement. Additionally, we emphasized the importance of using depth charts in conjunction with other technical indicators to create a well-rounded trading strategy.
We also covered various trading strategies that utilize depth charts, including day trading, swing trading, scalping, and arbitrage. Each strategy benefits from the real-time data provided by depth charts, allowing traders to act swiftly and capitalize on market opportunities.
To use depth charts effectively, we outlined best practices, including tips for reading charts, common mistakes to avoid, and tools and resources that can enhance depth chart analysis. Understanding these best practices ensures that traders can make informed decisions and avoid common pitfalls that could lead to losses.
In conclusion, mastering depth charts can significantly enhance a trader’s ability to navigate the volatile cryptocurrency market. Whether you are a day trader, swing trader, or someone looking to explore arbitrage opportunities, depth charts provide the insights needed to make strategic, informed decisions. By integrating depth charts into your trading toolkit, along with other technical indicators and market research, you can better manage risk, optimize your trades, and ultimately increase your chances of success in the dynamic world of cryptocurrency trading.