
1. Understanding Market Depth
In the dynamic world of forex, crypto, and CFD trading, Market Depth stands as a crucial concept that can make or break a trader’s strategy. Essentially, it refers to the liquidity of a particular asset at different price levels. It’s akin to peering into the heart of the market, gaining insights into the supply and demand of a specific asset and the price levels at which other traders are willing to buy or sell.
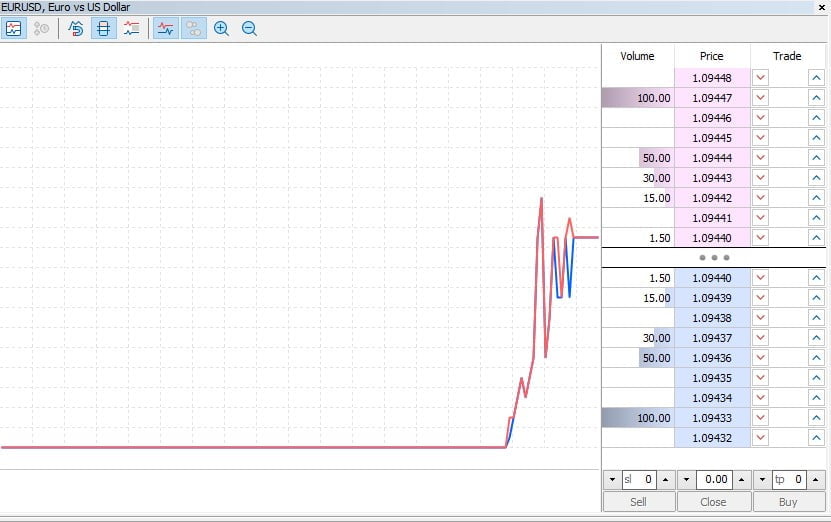
Market depth is typically visualized through a Depth of Market (DOM) ladder, a real-time data table that shows the buy and sell orders for a specific security or currency. The left side of the ladder shows the number of buy orders at a particular price point, while the right side indicates the number of sell orders. The higher the number of buy or sell orders at a particular price point, the higher the market depth at that level.
Understanding Market Depth can give traders a competitive edge, as it offers a window into the market’s potential reaction to a large order. For instance, if a trader observes that there’s a significant number of sell orders at a specific price level, they may infer that this level acts as a resistance point. Conversely, a high number of buy orders could indicate a support level.
Traders can utilize this information to fine-tune their entry and exit points, ensuring they get the best possible price for their trades. Moreover, it can also help in managing risk, as a market with high depth is less likely to experience drastic price swings due to large trades. However, it’s crucial to remember that while market depth can provide valuable insights, it’s just one piece of the puzzle and should be used in conjunction with other trading tools and indicators.
1.1. Definition of Market Depth
In the bustling world of forex, crypto and CFD trading, Market Depth is a term that often pops up, standing as a beacon of insight and strategy. At its core, it refers to the liquidity of a particular market, providing a real-time snapshot of the buying and selling activity of traders. This snapshot is usually presented in a “Depth Chart”, a visual representation that displays the number of buy and sell orders at various price points.
Market Depth is more than just a fancy chart; it’s a powerful tool that allows traders to gauge the strength or weakness of a market. It’s a peek into the market’s soul, revealing the level of demand for a specific asset, and the supply available to meet that demand. The greater the depth, the more stable and resilient the market is likely to be.
In essence, it’s a window into the balance between buyers and sellers, offering a glimpse into potential price movements. It allows traders to make more informed decisions, strategize their trades, and potentially anticipate market trends. By understanding the Market Depth, traders can identify key price levels where there may be a large volume of buy or sell orders, which could potentially serve as support or resistance levels.
1.2. Importance of Market Depth
Market depth is an underutilized tool that carries great significance in the world of trading. It’s a real-time snapshot of the market’s heartbeat, offering a comprehensive look at the buying and selling activity of specific securities. A trader who understands market depth can identify supply and demand levels, predict short-term price movement, and make informed trading decisions.
Market depth is essentially a list of buy and sell orders for a specific security at various prices. The data is presented in a table, with the volume of buy orders at different price levels on one side and the volume of sell orders on the other. This information allows traders to see where the price could go in the short term, based on the number of buy and sell orders at different prices.
For instance, if there are more buy orders than sell orders at a particular price, it could indicate that the price is likely to rise. Conversely, if there are more sell orders, the price may fall. This insight can be incredibly valuable when planning trades and managing risk.
Furthermore, market depth data can reveal the liquidity of a security. High liquidity means there’s a significant number of buyers and sellers, which can lead to more competitive bid and ask prices. On the other hand, low liquidity can result in larger bid-ask spreads, making it more difficult to execute trades at desirable prices.
Market depth is not only a powerful tool for day traders but also for those who trade on a longer timeframe. By understanding the balance between supply and demand, traders can better predict long-term price trends and identify potential trading opportunities.
2. Interpreting Market Depth Charts
Diving into the complexities of Market Depth Charts, it’s crucial to understand their inherent structure and how to interpret them effectively. At first glance, these charts may appear as an overwhelming array of numbers and lines, but once you grasp their essence, they can become an invaluable tool for your trading strategy.
The layout of a Market Depth Chart typically presents two opposing sides – the bid and the ask. The bid side represents buyers willing to purchase a particular asset, while the ask side signifies sellers offering to sell. These two sides come together to form what is known as the order book. The order book is a real-time, ever-changing database that provides insight into the market’s supply and demand.
To interpret a Market Depth Chart, traders should focus on the spread – the difference between the highest bid and the lowest ask. A tight spread often indicates a highly liquid market, whereas a wide spread can suggest lower liquidity. Traders should also pay attention to the order size at different price levels. Larger orders can act as potential support or resistance levels, influencing the asset’s price movement.
Market Depth Charts also display the cumulative bid and ask volumes, often represented as a graphical ‘depth’ curve. This curve gives a visual representation of market sentiment. If the curve tilts towards the bid side, it suggests a bullish sentiment, and vice versa.
Remember, like any trading tool, Market Depth Charts are not infallible. They should be used in conjunction with other indicators and analysis techniques to form a comprehensive trading strategy.
2.1. Components of Market Depth Charts
Diving into the world of market depth charts, you’ll find a treasure trove of data that can offer insightful trading advantages. These charts are composed of several key components that can help you decode market activity.
Firstly, the Bid Price is a vital element. This is the highest price that a buyer is willing to pay for a particular asset. It serves as a mirror into the market’s demand for a security, providing traders with a glimpse into potential buying pressure.
Secondly, the Ask Price is equally crucial. This is the lowest price at which a seller is willing to part with an asset. It provides a window into the supply side of the equation, indicating potential selling pressure.
The Number of Shares or Contracts at each price level is another key component. This information can provide a sense of the market’s liquidity and depth at different price levels.
The Order Book is another essential element. This is a real-time, continuously updated list of buy and sell orders for a specific security. It offers a comprehensive view of market activity, showing the prices and quantities at which traders are willing to buy or sell.
Lastly, the Time & Sales data is an important part of depth charts. This feature shows the time, price, and quantity of every completed transaction. It’s like a historical record of trading activity, offering insights into how the market has been moving.
Understanding these components can empower you to make more informed and strategic trading decisions. Whether you’re trading forex, crypto, or CFDs, a deeper knowledge of market depth charts can be a valuable tool in your trading arsenal.
2.2. Understanding Market Depth Indicators
Market depth indicators serve as the trader’s compass in the tumultuous sea of forex, crypto, and CFD trading. This vital tool provides a detailed view of the liquidity conditions for a specific security at different price levels. It’s akin to having X-ray vision into the market’s soul, revealing the layers of buy and sell orders that exist in the market at any given moment.
Market depth indicators are displayed in an easy-to-read histogram format, with price levels on the vertical axis and the cumulative volume of orders at each price level on the horizontal axis. This visual representation allows traders to quickly grasp the supply and demand dynamics for a particular security.
For instance, a large number of sell orders at a certain price level might indicate a potential resistance level, while a concentration of buy orders could suggest a support level. By anticipating these pivotal points, traders can make more informed decisions about when to enter or exit a trade, thereby optimizing their profit potential and minimizing risk.
Moreover, market depth indicators can also shed light on potential price movements. A sudden surge in volume at a particular price level might signal an imminent price change. Conversely, a drop in volume could suggest a lack of momentum, possibly heralding a price reversal.
In essence, market depth indicators are not just about understanding the current market conditions. They are about predicting future price movements and making strategic trading decisions based on these insights. By mastering this tool, traders can gain a significant edge in the fast-paced and unpredictable world of forex, crypto, and CFD trading.
3. Utilizing Market Depth for Trading
As you delve deeper into the world of trading, you’ll find that market depth is an invaluable tool in your arsenal. Essentially, market depth is a real-time list that displays the buy and sell orders of a specific security or cryptocurrency. This list, known as the Order Book, provides traders with insights into the supply and demand for a particular asset at different price levels.
Utilizing market depth for trading can offer a wealth of benefits. Firstly, it can help traders gauge the strength or weakness of a price movement. For instance, if there’s a large number of sell orders at a certain price level, it could indicate a potential resistance level. On the flip side, a large number of buy orders could suggest a support level.
Secondly, market depth allows traders to identify potential price gaps. These are areas where there are minimal orders, which could lead to rapid price movements if the orders at these levels get filled. Traders can leverage this information to set their entry and exit points, potentially securing profits before a significant price change occurs.
Lastly, market depth can also help traders determine the liquidity of a particular asset. High liquidity, indicated by a large number of buy and sell orders, means that traders can enter and exit positions easily. Conversely, low liquidity could pose challenges, especially for traders who are dealing with large volumes.
Applying market depth in your trading strategy requires practice and patience. It’s crucial to remember that while market depth provides valuable insights, it’s just one piece of the puzzle. It should be used in conjunction with other technical analysis tools and indicators for a more holistic trading approach.
3.1. Strategies for Using Market Depth
Market depth is a powerful tool that offers traders a unique window into the market’s dynamics, providing real-time data about the buying and selling activities of other market participants. One of the most effective strategies for using market depth is the liquidity analysis. This involves studying the volume of buy and sell orders at different price levels. A high volume of orders at a specific price level can act as a strong support or resistance level, helping traders to predict price movements and make informed trading decisions.
Another strategy is the imbalance analysis. By comparing the number of buy orders to the number of sell orders, traders can gauge the market sentiment. If there are significantly more buy orders than sell orders, it could indicate a bullish sentiment, which might lead to an increase in price. Conversely, if there are more sell orders, it could signal a bearish sentiment, potentially leading to a price decrease.
Finally, traders can use market depth to identify potential market manipulation. Large orders, also known as ‘whale orders’, can influence the market price. If a trader spots a whale order, they can anticipate the potential price movement and adjust their trading strategy accordingly. However, it’s crucial to remember that while market depth can provide valuable insights, it should not be the sole basis of your trading decisions. Always consider other technical and fundamental analysis tools to make a well-rounded trading decision.
3.2. Risks and Limitations of Using Market Depth
Just as there are two sides to every coin, there are also risks and limitations associated with using market depth in forex, crypto, or CFD trading. One of the most prominent risks is the potential for misinterpretation. Market depth data can often be complex and overwhelming, especially for novice traders. This complexity can lead to misinterpretation of the data, which can result in misguided trading decisions.
Another significant risk is the volatility of the market. Market depth is a real-time snapshot of the market’s buy and sell orders. However, these orders can change rapidly, especially in volatile markets such as forex and crypto. This volatility can make it challenging to make accurate trading decisions based on market depth data alone.
A notable limitation of using market depth is its inability to provide a complete picture of the market. Market depth only displays the orders that are immediately available in the market. It doesn’t show any hidden orders or the orders that are far from the current market price. Therefore, relying solely on market depth can provide a skewed view of the market’s actual liquidity.
Furthermore, market depth data is not universally available across all trading platforms or for all financial instruments. This lack of availability can limit its usefulness for some traders. Even when it is available, the data can sometimes be delayed, which further compounds the risks associated with interpreting and using it.
Finally, it’s worth noting that market depth data is most valuable in highly liquid markets. In less liquid markets, the data can be sparse and less reliable, making it less effective as a trading tool.
4. Market Depth in Different Trading Environments
In the realm of trading, understanding the concept of Market Depth is pivotal. It’s akin to having an X-ray vision into the market’s soul, revealing the layers of buy and sell orders that exist for a particular asset at various price levels. The trading environment, whether it’s forex, crypto, or CFDs, significantly influences how market depth is perceived and utilized.
In the Forex market, where liquidity reigns supreme, market depth provides an insight into the supply and demand of a specific currency pair. Traders can gauge the strength of a trend based on the volume and size of the orders. For instance, a large sell order at a particular price level might indicate a strong resistance level.
Crypto markets, known for their volatility, present a unique scenario. Here, market depth can serve as an early warning system for sudden price swings. A thin order book, i.e., fewer buy and sell orders, might suggest a potential price manipulation or an impending steep price movement.
CFD trading involves speculating on the price movements of various financial instruments. In this environment, market depth is crucial for assessing liquidity risk. A deep market, characterized by large volumes of buy and sell orders, allows traders to enter and exit positions without significantly affecting the price.
In essence, the market depth is a dynamic, real-time data source that provides a snapshot of the market’s mood. It’s a powerful tool that, when used correctly, can enhance trading strategies and improve decision-making. However, it’s important to remember that market depth is just one piece of the trading puzzle. It should be used in conjunction with other technical and fundamental analysis tools for a comprehensive understanding of the market.
4.1. Market Depth in Forex Trading
In the dynamic world of forex trading, understanding Market Depth can provide traders with a distinct advantage. Market Depth, in essence, reveals the supply and demand levels of a particular currency pair. It provides a snapshot of the pending orders that are lined up at different price levels, waiting to be executed. This valuable information not only gives traders a real-time view of the market’s liquidity but also offers insights into potential price movements.
Market Depth can be visualized as a list of buy and sell orders organized by price level and updated to reflect real-time market activity. Most trading platforms provide a market depth view, allowing traders to see the buy and sell orders waiting to be filled. It’s like having a window into the market’s soul, where you can see the tug of war between buyers and sellers.
But how can traders leverage this information? Well, a high level of market depth (many orders at each price level) suggests a highly liquid market, which means trades can be executed quickly and at a favorable price. Conversely, a market with low depth could lead to slippage, where trades are executed at a worse-than-expected price.
Additionally, by analyzing market depth, traders can identify potential support and resistance levels. If there are large orders at a certain price level, it can act as a barrier, preventing the price from moving beyond that point. This can be incredibly useful for setting stop losses or take profit levels.
Market Depth is a powerful tool in a trader’s arsenal. But like any tool, it requires skill and practice to use effectively. So, delve into the depth, observe the ebb and flow of orders, and harness this knowledge to make informed trading decisions.
4.2. Market Depth in Crypto Trading
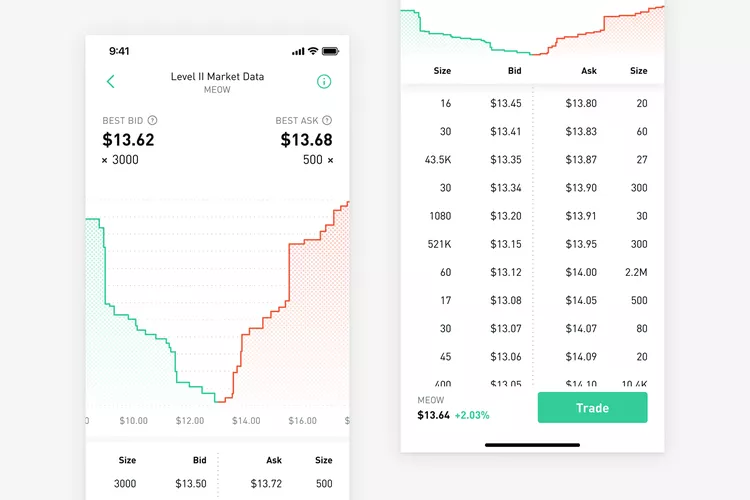
In the dynamic world of crypto trading, understanding Market Depth can be a game-changer. It’s a visual representation of real-time demand for a particular cryptocurrency on an exchange, showing the number of buy and sell orders at different prices. The most crucial aspect of market depth is the Order Book, which lists all current buy (bid) and sell (ask) orders for a specific cryptocurrency. This real-time data provides traders with a snapshot of the market’s buying and selling activity, and its potential impact on price movements.
The market depth chart, often known as the Depth Chart, is a graphical representation of the order book. The x-axis shows the price, while the y-axis represents the cumulative order quantity. The green part of the chart represents buy orders, while the red part represents sell orders. The point where both meet is the current market price.
Market Depth provides insights into the market’s liquidity and volatility. A deep market with a high volume of orders close to the market price indicates high liquidity, meaning a trader can buy or sell large quantities without significantly affecting the price. Conversely, a shallow market with fewer orders suggests low liquidity, and large trades can significantly impact the price.
Understanding Market Depth can also help traders anticipate price movements. If there’s a large sell order (also known as a ‘sell wall’) at a particular price point, the price may struggle to rise beyond this point unless there’s enough buying pressure to absorb the sell wall. Similarly, a large buy order (a ‘buy wall’) can act as a support level, preventing the price from falling further.
Market Depth is a valuable tool for both short-term and long-term traders. Day traders may use it to identify potential resistance and support levels, while swing traders and investors can use it to gauge the overall market sentiment and liquidity. However, it’s essential to remember that market depth is just one of many tools in a trader’s arsenal and should be used in conjunction with other technical and fundamental analysis methods to make informed trading decisions.
4.3. Market Depth in CFD Trading
In the bustling world of CFD trading, understanding the concept of market depth can be your secret weapon. It’s like having a crystal ball that offers a glimpse into the market’s future movements. Market depth refers to the market’s ability to sustain relatively large orders without impacting the price of a security. In simpler terms, it shows the different prices and the number of orders lined up at each price point waiting to be filled.
With market depth, you can see the open buy and sell orders for a security at different prices. High market depth means there’s a significant number of buy and sell orders at each price point, indicating a highly liquid market. Conversely, a market with low depth might be more volatile, with prices likely to change rapidly if large orders are placed.
So, how can traders use this information? Market depth data can be a powerful tool for identifying potential support and resistance levels. For instance, a large number of open buy orders at a certain price level could indicate a potential support level, as this is the price at which a significant number of traders are willing to buy. Similarly, a significant number of sell orders at a certain price could suggest a resistance level.
Moreover, market depth can help traders gauge the strength of a price trend. If there’s high market depth behind a price increase, it could suggest a strong uptrend, with plenty of buyers ready to purchase at higher prices. On the other hand, if a price increase is accompanied by low market depth, it could indicate a weaker trend that might reverse soon.
However, while market depth can provide valuable insights, it’s important to remember that it’s just one piece of the puzzle. It should be used in conjunction with other trading tools and strategies to make informed trading decisions. After all, successful trading is all about having a well-rounded view of the market and making decisions based on a comprehensive analysis.