
1. What is McGinley Dynamic Indicator?
The McGinley Dynamic Indicator is a technical analysis tool developed by John R. McGinley, a market technician, in the 1990s. It is designed to solve the lag problem that is inherent in all moving averages. The indicator is not very well known but is highly regarded by technical analysts who use it.
Unlike traditional moving averages, the McGinley Dynamic automatically adjusts to changes in market speed. It achieves this by incorporating a formula that factors in the instrument’s price and the Dynamic’s own data. The primary aim of the McGinley Dynamic is to be a market tool rather than a trading indicator.
The indicator functions by smoothing the price data which allows it to better track the market without introducing lag as much as standard moving averages do. Its calculation involves a complex formula where the Dynamic adjusts itself relative to the price movement—speeding up when prices move swiftly and slowing down when prices move sluggishly.
Traders often similarly use the McGinley Dynamic to moving averages, to determine market trends and potential reversal points. However, it is characterized by a smoother line that is not as susceptible to separation from prices during rapid market movements. This makes it potentially more reliable during volatile market conditions.
The McGinley Dynamic can be used on any time frame and with any market instrument. It is a versatile tool in a trader’s arsenal, often used to refine other trading strategies and indicators by providing a more accurate reflection of the market trend.
2. How to Set Up McGinley Dynamic Settings?
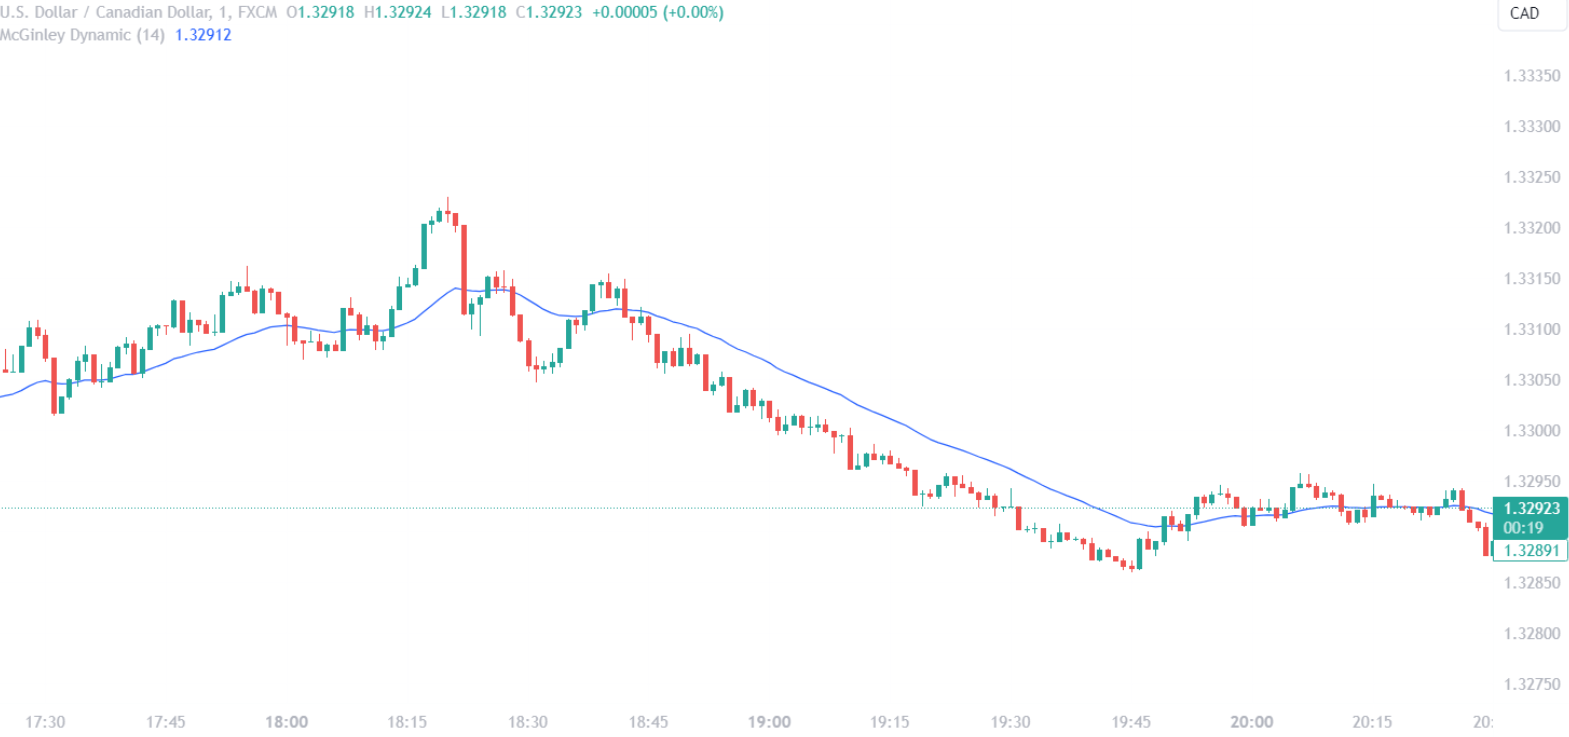
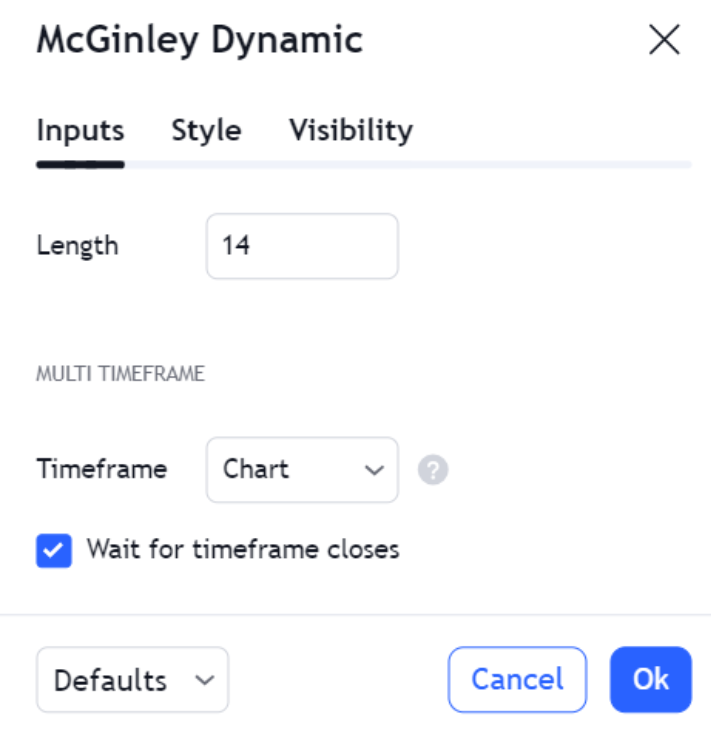
Setting up the McGinley Dynamic is straightforward, but it requires attention to certain parameters to ensure optimal performance. The indicator’s primary setting is the Dynamic period, which is similar to the period setting of a moving average. The default value is typically set to a 14-period timeframe, but traders can adjust this to suit their individual trading style and the instrument being traded.
Adjusting the Dynamic period involves a trade-off between sensitivity and smoothness. A shorter period makes the indicator more sensitive to price changes, which can be useful for short-term traders looking for early signals. In contrast, a longer period smooths out the data further, which may be preferable for long-term traders focused on the bigger trend.
To add the McGinley Dynamic to a chart, traders should:
- Open their charting platform and select the instrument they wish to analyze.
- Locate the indicator section and search for the McGinley Dynamic. If not available by default, it may be found in a public library or custom code repository.
- Add the indicator to the chart.
- Enter the desired period in the indicator settings. The period can be based on minutes, days, weeks, or any other timeframe the platform supports.
- Observe the Dynamic’s line on the chart and adjust the settings if necessary to align with the trading strategy.
Fine-tuning the Dynamic can also involve overlaying it with other indicators or chart patterns to enhance decision-making. For instance, traders might use a faster Dynamic period on a shorter timeframe chart for entry signals, while consulting a slower Dynamic on a longer timeframe for overall trend direction.
Optimal settings for the McGinley Dynamic vary depending on market conditions and volatility. Traders should backtest different settings to determine what works best for their trading approach.
| h4 | Key Considerations When Setting Up McGinley Dynamic |
| Default Period | 14 (can be adjusted) |
| Shorter Period | Increases sensitivity, suitable for short-term trading |
| Longer Period | Increases smoothness, suitable for long-term trend analysis |
| Fine-Tuning | Combine with other indicators, adjust based on backtesting results |
2.1. McGinley Dynamic Settings for Different Trading Platforms
MetaTrader 4 & MetaTrader 5
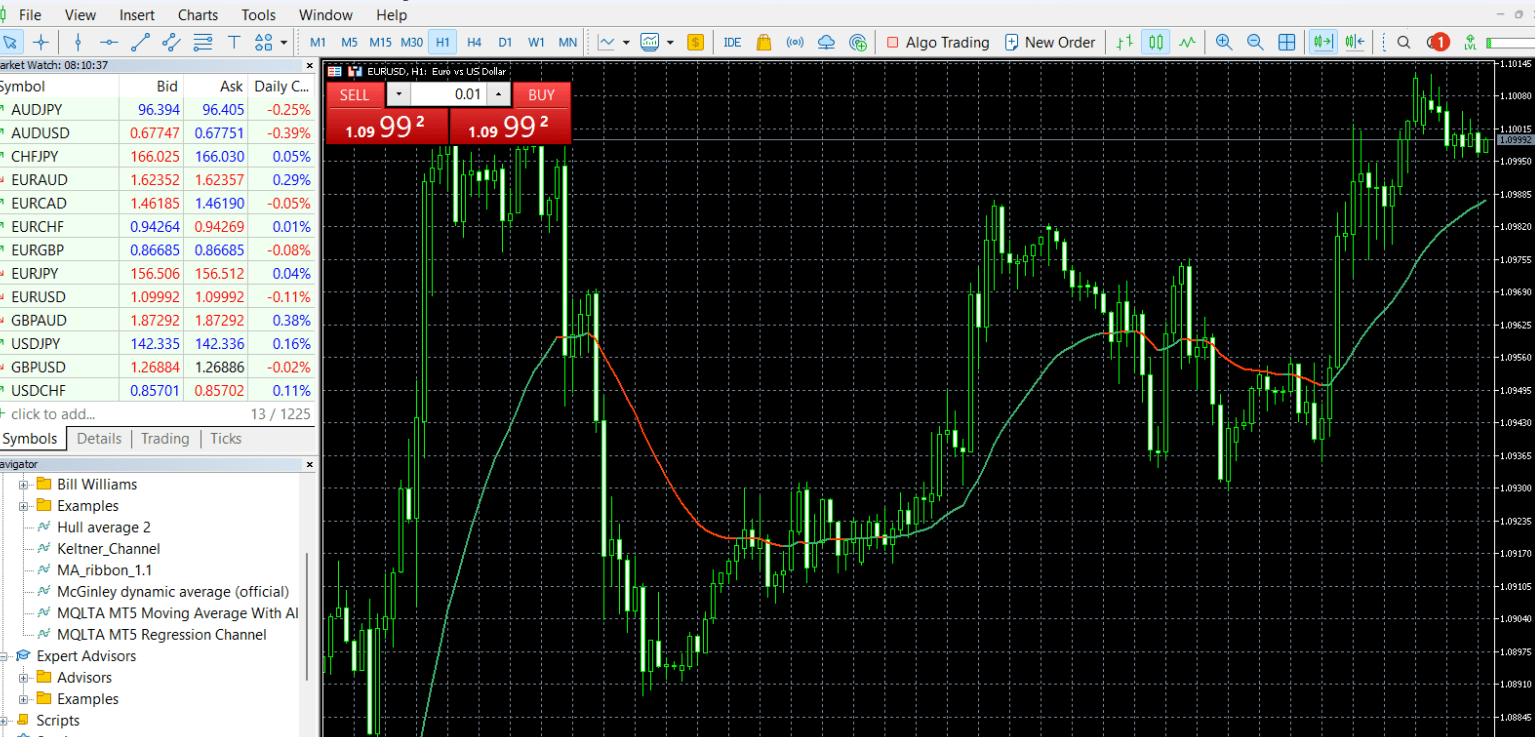
For MetaTrader 4 (MT4) and MetaTrader 5 (MT5) users, the McGinley Dynamic is not included by default. Traders must download and install it as a custom indicator. Once installed, accessing the indicator settings allows for the adjustment of the Dynamic period, which traders may set according to their strategy. It’s important to ensure the downloaded version is compatible with the platform’s scripting language, MQL4 for MT4 and MQL5 for MT5.
Thinkorswim
On the Thinkorswim platform by TD Ameritrade, traders can add the McGinley Dynamic through the ‘Studies’ feature. Once added, settings can be customized in the ‘Edit Study’ section. Thinkorswim allows for a high degree of customization, and users may alter the color, thickness, and period of the Dynamic to fit their visual preferences and trading needs.
TradingView
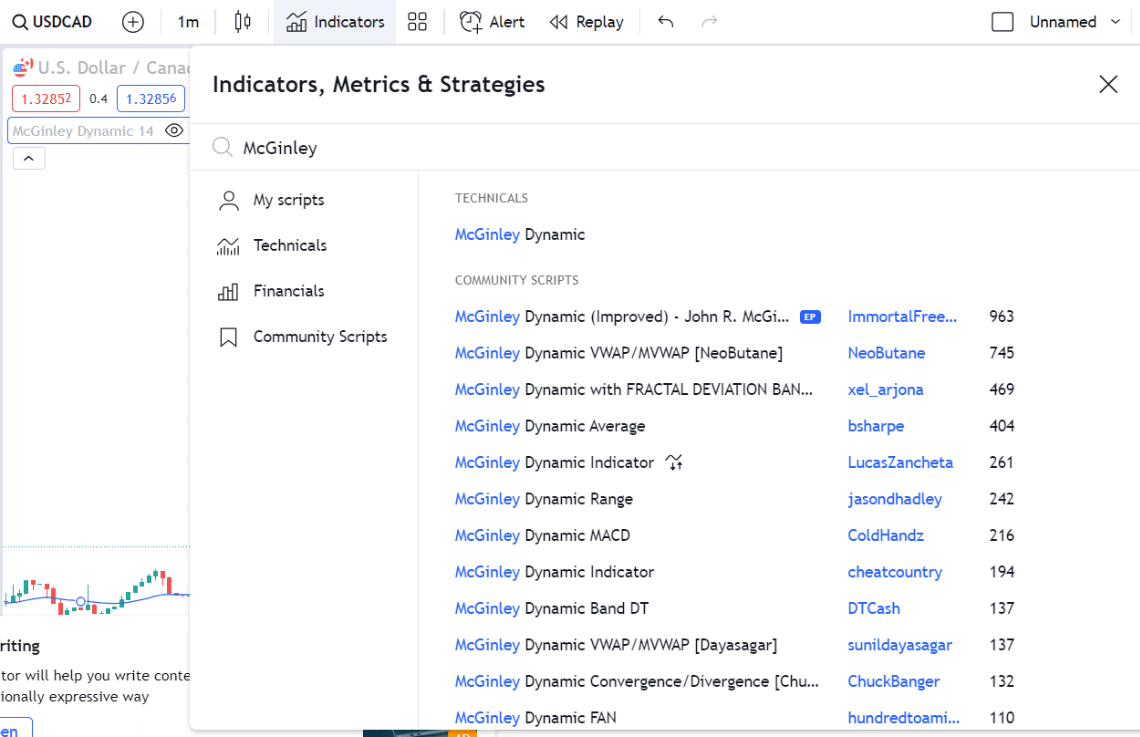
TradingView users can find the McGinley Dynamic in the public library or create it using Pine Script for a more personalized version. The platform’s user-friendly interface enables easy adjustments of the indicator’s inputs, including the period setting. Traders can simply select the indicator and modify its properties directly from the chart overlay.
Bloomberg Terminal
For professionals using the Bloomberg Terminal, the McGinley Dynamic may need to be set up through Bloomberg’s advanced charting tools. Given the sophisticated nature of the platform, traders should familiarize themselves with the Terminal’s unique command system to effectively implement and adjust the indicator.
In all cases, regardless of the platform, traders should verify the accuracy of the McGinley Dynamic implementation and ensure it operates as intended. Regular updates and platform-specific nuances may affect how custom indicators like the McGinley Dynamic function, so staying informed about the latest versions is essential.
2.1.1. McGinley Dynamic Python Implementation
McGinley Dynamic Python Implementation
Implementing the McGinley Dynamic in Python requires an understanding of its formula and the ability to manipulate data series with Python’s libraries. Pandas is typically used for data manipulation, and NumPy for numerical calculations. The calculation involves iterating over the price data and applying the McGinley Dynamic formula to each data point.
The first step is to obtain financial data, which can be sourced from free APIs like Yahoo Finance or through paid services that provide higher granularity and reliability. Once the data is loaded into a DataFrame, the calculation of the McGinley Dynamic can commence. The formula used is:
[ MD{i} = MD{i-1} + \frac{Price – MD{i-1}}{N \times (Price / MD{i-1})^4} ]
where:
- (MD_{i}) is the current McGinley Dynamic value,
- (MD_{i-1}) is the previous McGinley Dynamic value,
- (Price) is the current price of the asset, and
- (N) is the Dynamic period.
A Python function to calculate the McGinley Dynamic might look like this:
import pandas as pd
import numpy as np
def calculate_mcg_dynamic(data, period=14):
mcg_dynamic = pd.Series(index=data.index)
mcg_dynamic.iloc[0] = data.iloc[0] # Initialize with the first price value
for i in range(1, len(data)):
mcg_dynamic.iloc[i] = mcg_dynamic.iloc[i-1] + (
(data.iloc[i] – mcg_dynamic.iloc[i-1]) /
(period * (data.iloc[i] / mcg_dynamic.iloc[i-1])**4)
)
return mcg_dynamic
In this function, data represents the series of price data points, and period is the Dynamic period which can be altered to fit the trader’s strategy. The initial McGinley Dynamic value is set to the first price in the series to start the iteration process.
Once the McGinley Dynamic is calculated, it can be plotted alongside the price data using libraries like matplotlib or plotly to visualize the relationship and the indicator’s behavior over time.
| Function Argument | Description |
| data | Price data series |
| period | Dynamic period (default set to 14) |
The trader should perform backtesting to integrate the McGinley Dynamic into a trading strategy using Python. This involves running the strategy against historical data to assess its viability. Libraries such as Backtrader or Zipline can be used for backtesting purposes.
By leveraging Python to implement the McGinley Dynamic, traders can automate their analysis and integrate this indicator into algorithmic trading strategies. Python’s flexibility also allows for combining the McGinley Dynamic with other indicators and data sources to develop comprehensive trading systems.
2.1.2. Configuring McGinley Dynamic on Thinkorswim
Configuring the McGinley Dynamic on Thinkorswim begins by accessing the ‘Studies’ tab, a hub for various technical analysis tools. The platform’s comprehensive suite of studies allows traders to include the McGinley Dynamic indicator by selecting ‘Add Study’ and navigating through the list or utilizing the search function to expedite the process.
Once added, customization is critical to align the McGinley Dynamic with specific trading needs. Traders access the ‘Edit Study’ section by right-clicking on the indicator line on the chart. This is where the period can be set to reflect the trader’s preference for sensitivity or smoothness. For instance, a day trader might reduce the period to capture short-term trends, while a long-term investor may extend it to filter out market noise.
Thinkorswim’s advanced customization options also allow users to modify the visual aspects of the McGinley Dynamic. This includes adjustments to the line color and thickness, ensuring the indicator is both prominent and distinguishable from other studies on the chart. Customizing these visual parameters not only aids in quick identification but also helps in reducing visual clutter, especially when multiple indicators are in use.
Thinkorswim Configuration Overview
| Setting | Purpose | Customization Options |
| Period | Determines sensitivity to price changes | Adjustable to match trading strategy |
| Line Color | Enhances visibility | Selectable from a color palette |
| Thickness | Improves line prominence | Slider to increase or decrease |
It is also advisable for traders to apply the McGinley Dynamic on different time frames to observe its behavior in various market conditions. This could reveal insights into how the indicator responds to specific instruments or time periods, assisting in refining the Dynamic period further. Through Thinkorswim’s flexible interface, traders can quickly switch between time frames and observe the McGinley Dynamic’s performance in real-time.
Continuous refinement and backtesting remain integral to employing the McGinley Dynamic effectively on Thinkorswim. As market conditions evolve, so should the configuration of technical indicators. Traders may find it beneficial to periodically review and adjust the McGinley Dynamic settings to maintain alignment with their current trading approach and market dynamics.
3. How to Use McGinley Dynamic Indicator?
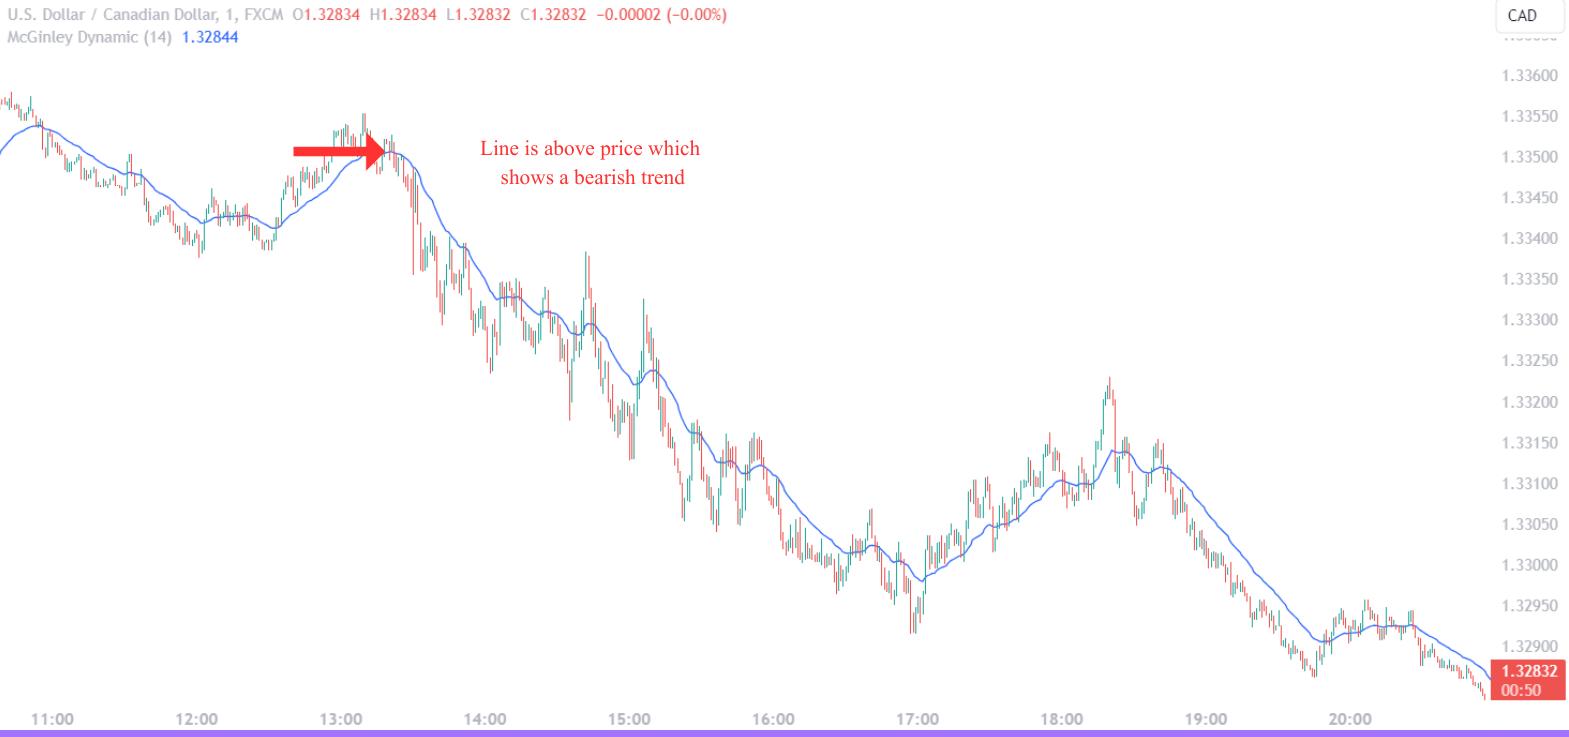
The McGinley Dynamic Indicator serves as a trend-following tool, akin to a moving average yet with a unique self-adjusting mechanism for volatility. To capitalize on its benefits, identify the overall market trend by observing where the Dynamic line positions itself in relation to the price. A Dynamic line below the price often indicates an uptrend, suggesting a potential buying opportunity, whereas a line above the price signals a downtrend and possibly a selling scenario.
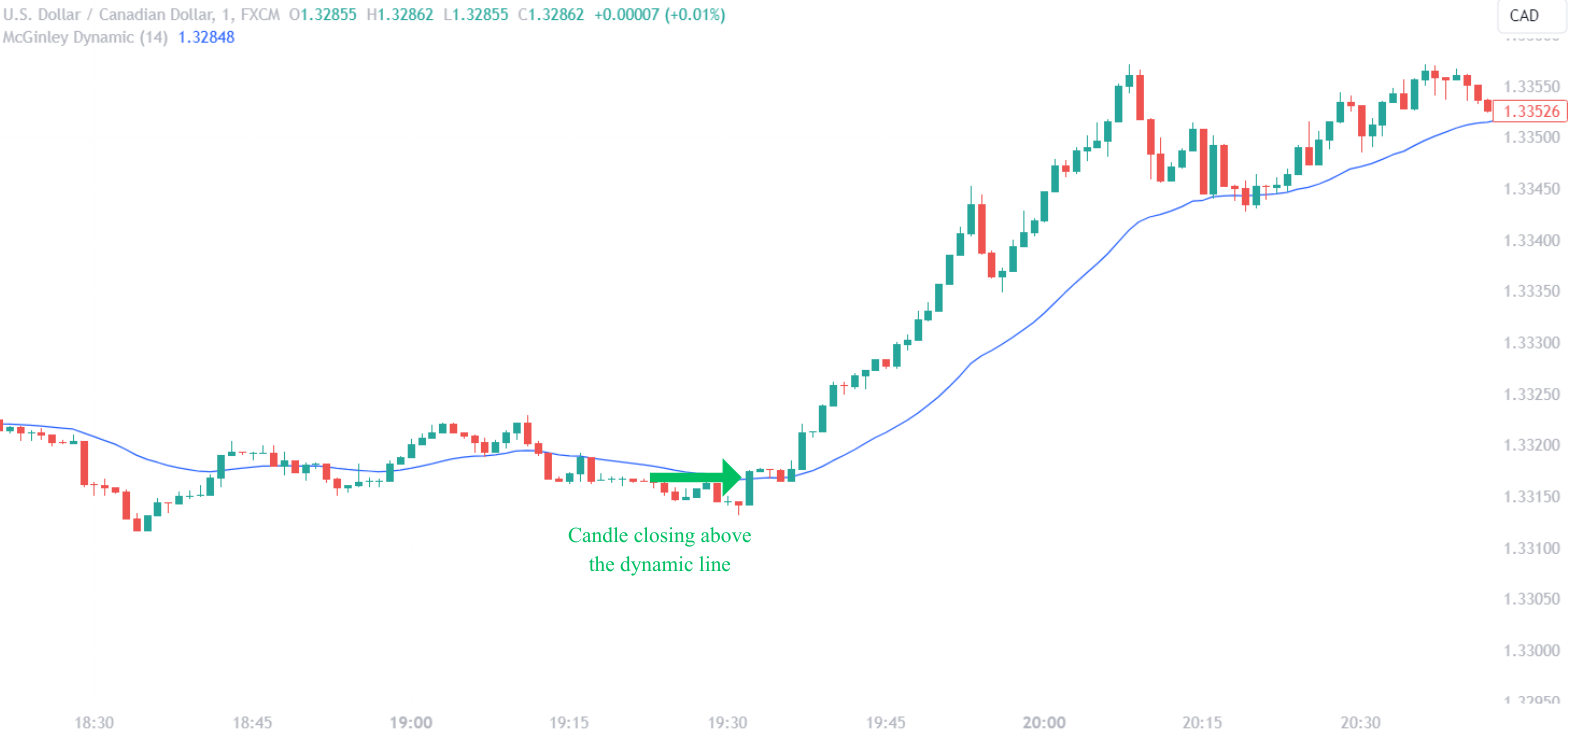
Traders might also employ the McGinley Dynamic for crossover strategies. When the price crosses above the Dynamic line, it may be interpreted as a bullish signal and conversely, a bearish signal when the price falls below the Dynamic line. Depending on the trader’s strategy, these crossovers can serve as entry or exit points.
Support and resistance levels can also be gauged using the McGinley Dynamic. The indicator often mirrors key levels where price may experience a bounce or a breakthrough. Traders can use these observations to set stop-loss orders or to take profits.
Using McGinley Dynamic with Other Indicators
| Indicator | Purpose | Interaction with McGinley Dynamic |
| Relative Strength Index (RSI) | Measure overbought/oversold conditions | Confirm signals given by divergences or overbought/oversold levels |
| Bollinger Bands | Assess market volatility | Provide context for Dynamic’s position relative to price bands |
| Moving Average Convergence Divergence (MACD) | Identify momentum and direction | Reinforce trend direction or momentum shifts signaled by the Dynamic |
Integrating the McGinley Dynamic with other indicators like RSI, Bollinger Bands, or MACD can enhance its effectiveness. For instance, a bullish crossover on the McGinley Dynamic accompanied by an RSI moving out of oversold territory could reinforce a buy signal. Similarly, the McGinley Dynamic’s trend line in conjunction with the outer bands of Bollinger Bands could indicate potential reversals or continuations.
Risk management is paramount when using the McGinley Dynamic. Despite its adaptive nature, no indicator is foolproof. Traders should apply proper risk management techniques, such as setting stop-losses and determining position sizes based on the volatility and their individual risk tolerance.
Incorporating the McGinley Dynamic into a trading strategy starts with understanding its behavior in the context of the trader’s preferred time frames and assets. Continuous observation, combined with backtesting strategies, refines its application, ensuring the Dynamic is not solely relied upon but rather used as a component of a comprehensive trading system.
3.1. Interpreting the McGinley Dynamic Line
McGinley Dynamic Line as a Trend Filter
The McGinley Dynamic line is a more responsive trend filter than traditional moving averages. Its self-adjusting algorithm allows it to adhere closely to price action, mitigating the separation issue that often plagues moving averages during fast market swings. When the Dynamic line lies below the market price, it typically suggests an uptrend, and traders might consider this an environment conducive to long positions. Conversely, a downtrend is indicated when the Dynamic line is above the price, and traders might explore short-selling opportunities or exit long positions.
Price Crossovers with the McGinley Dynamic
Price crossovers are pivotal moments when interpreting the McGinley Dynamic. A price crossing above the Dynamic line may signal a shift to bullish sentiment, prompting a trader to enter a long position or close out short positions. Conversely, a price crossing below can be a precursor to bearish momentum, leading to potential short entries or exits from long positions. These crossovers are considered significant as they may reflect changes in market sentiment.
| Crossover Type | Market Implication | Potential Action |
| Price crosses above McGinley Dynamic | Bullish shift | Consider long positions or close shorts |
| Price crosses below McGinley Dynamic | Bearish shift | Consider short positions or exit longs |
McGinley Dynamic Line in Volatile Markets
In volatile markets, the McGinley Dynamic line’s responsiveness is particularly useful. It smooths out price volatility without the need for manual adjustment, providing a clearer picture of the underlying trend. This adaptability can help traders distinguish between genuine market reversals and misleading noise. The smooth nature of the line also aids in identifying sustained trends, potentially allowing traders to stay in winning trades longer and with more confidence.
Market Phases and the McGinley Dynamic
Recognizing market phases is crucial when interpreting the McGinley Dynamic line. During consolidation phases, the Dynamic line may flatten, indicating a lack of a clear trend, which can signal traders to be cautious about trend-following strategies. In trending phases, the line’s direction and slope become more pronounced, offering visual cues about the strength and stability of the trend. Traders can use this information to adjust their strategies, such as tightening stop-losses during robust trends or taking profits before a potential phase shift.
Adaptive Nature of the McGinley Dynamic
The adaptive nature of the McGinley Dynamic line sets it apart from other trend-following indicators. It automatically recalibrates its sensitivity based on the velocity of price changes, making it a dynamic companion to the static nature of other technical analysis tools. This characteristic enhances its utility in dynamic market conditions, allowing traders to rely less on guesswork and more on the quantitative adjustments the Dynamic line provides.
3.2. Integrating McGinley Dynamic with Other Indicators
Enhancing McGinley Dynamic with Volume-Based Indicators
Integrating the McGinley Dynamic with volume-based indicators such as the On-Balance Volume (OBV) or the Volume-Weighted Average Price (VWAP) can provide a deeper analysis of market trends. For example, a rising McGinley Dynamic in conjunction with increasing OBV could confirm an uptrend’s strength, suggesting robust buying pressure. Conversely, if the McGinley Dynamic indicates a downtrend while OBV is declining, it can reinforce the presence of selling pressure. VWAP, often used as an intraday benchmark, can be overlaid with the McGinley Dynamic to identify price trends in relation to the average volume-weighted price, providing insights into potential institutional buying or selling levels.
Confirming Trends with Oscillators
Oscillators like the Stochastic Oscillator or the Commodity Channel Index (CCI) serve as complementary tools to the McGinley Dynamic for confirming trend strength and potential reversals. The Stochastic Oscillator, which compares a closing price to its price range over a certain period, can validate the McGinley Dynamic’s signals when both reach overbought or oversold conditions simultaneously. Similarly, CCI, which measures a security’s variation from its statistical mean, can be used alongside the McGinley Dynamic to spot divergences that may signal a trend change.
Synergy with Chart Patterns
The McGinley Dynamic’s fluidity makes it well-suited to be paired with chart patterns such as triangles, head and shoulders, or flags. When a pattern is identified, the McGinley Dynamic can help confirm the breakout direction and the pattern’s validity. For instance, a breakout above a resistance pattern accompanied by an upward trending McGinley Dynamic may offer a stronger case for a continued uptrend.
Combining with Price Action Techniques
Price action techniques involve analyzing the movement of securities through the use of price charts and patterns without the need for additional indicators. When used with the McGinley Dynamic, traders can refine entry and exit points by looking for price action confirmation such as bullish or bearish candlestick formations that coincide with Dynamic crossovers or trend indications.
| Integration Technique | Benefit |
| Volume-Based Indicators | Validates trend strength through volume confirmation |
| Oscillators | Provides overbought/oversold conditions to support Dynamic signals |
| Chart Patterns | Confirms breakout directions and enhances pattern trading |
| Price Action | Refines entries/exits with candlestick pattern confirmation |
By strategically integrating the McGinley Dynamic with other indicators and price action techniques, traders can construct a robust, multi-faceted approach to market analysis. This integration not only increases the confidence in the signals provided but also contributes to a more holistic trading strategy that can adapt to the ever-changing market conditions.
3.3. Practical Examples of McGinley Dynamic in Action
Breakout Trading with the McGinley Dynamic
In breakout trading, the McGinley Dynamic can be instrumental in confirming the validity of a breakout. For example, when a stock price consolidates within a narrow range and then breaks out, the McGinley Dynamic can be used to assess whether the breakout has momentum. If the Dynamic line follows the price breakout closely, it suggests the move may be sustainable. Traders might then enter a trade in the direction of the breakout, using the Dynamic line as a trailing stop to manage risk.
Trend Reversal Identification
The McGinley Dynamic’s unique formula allows it to swiftly reflect changes in price velocity, making it valuable for spotting potential trend reversals. A practical scenario could involve a trader observing a steady uptrend with the Dynamic line below the price. If the price suddenly drops below the Dynamic line and the line starts to turn down, this could indicate a reversal from bullish to bearish sentiment. Such a cross under might be used as a signal to exit long positions or to initiate a short trade.
Dynamic Support in Range-Bound Markets
Even in range-bound markets, the McGinley Dynamic offers utility by acting as a dynamic support or resistance level. Traders might watch for the price to touch the Dynamic line and bounce back within the range. These touches can be considered buying or selling opportunities based on whether the price approaches the Dynamic line from above or below. The key here is to observe the reaction of the price when it meets the Dynamic line, as it may indicate the strength of the range’s boundaries.
Combining McGinley Dynamic with Candlestick Patterns
Combining the McGinley Dynamic with specific candlestick patterns can provide clear entry and exit signals. For instance, if a bullish engulfing pattern occurs at the same time the price crosses above the McGinley Dynamic, it could be a robust signal to go long. Conversely, a bearish engulfing pattern coinciding with a price drop below the Dynamic line might be a signal to sell or short the asset.
| Scenario | McGinley Dynamic Behavior | Possible Interpretation |
| Price Breakout | Dynamic line closely follows the breakout | Sustainable move, consider entering the trade |
| Trend Reversal | Price drops below a descending Dynamic line | Bearish sentiment, potential short entry |
| Range-Bound Touch | Price touches and bounces off the Dynamic line | Dynamic line acts as support/resistance, opportunity to trade the range |
| Candlestick Confirmation | Price crosses the Dynamic line with a confirming pattern | Strong signal for entry/exit based on pattern indication |
By applying the McGinley Dynamic in these practical trading scenarios, traders can leverage its responsive nature to enhance decision-making processes and potentially increase the precision of their trades. The key is to observe the interaction between the price and the Dynamic line and to use this relationship to inform trading actions.
4. What is the Best Strategy for McGinley Dynamic?
The optimal strategy for employing the McGinley Dynamic depends largely on the trader’s individual style, objectives, and the market context. However, strategies that capitalize on the indicator’s unique properties tend to yield the best results. Trend identification and confirmation strategies are particularly effective, as the McGinley Dynamic excels in smoothing price action and adapting to market volatility.
A strategy that combines the McGinley Dynamic with volume-based indicators can be powerful. For instance, using the Dynamic line to identify the trend direction and then looking for volume confirmations of that trend can provide a robust signal. When the McGinley Dynamic indicates an uptrend and volume indicators show increasing buying pressure, it can be a strong signal to enter a long position.
Breakout Confirmation Strategy
| Condition | McGinley Dynamic Behavior | Volume Indicator Confirmation | Action |
| Bullish Breakout | The dynamic line follows the price closely | Volume increases | Consider long position |
| Bearish Breakout | The dynamic line follows the price drop | Volume increases | Consider short position |
8Another effective approach is to use the McGinley Dynamic in crossover strategies. The strategy involves initiating trades when the price crosses the Dynamic line, and these crossovers can be further validated with oscillator divergences or candlestick patterns for higher trade accuracy.
Dynamic support and resistance strategy is also a viable approach, particularly in range-bound markets. Traders can look for price bounces off the McGinley Dynamic line to enter trades, expecting the price to return within the established range. This strategy harnesses the Dynamic line’s ability to act as a moving support or resistance level.
Risk management should be an integral part of any strategy involving the McGinley Dynamic. Given that the indicator is a trend-following tool, it may lag during rapid trend reversals or market shocks. Therefore, incorporating stop-loss orders based on the indicator’s level or volatility metrics can help mitigate potential losses.
4.1. McGinley Dynamic Strategy for Trend Following
McGinley Dynamic Strategy for Trend Following
The McGinley Dynamic is adept at trend following due to its responsiveness to price movements, making it an invaluable tool for traders who aim to capitalize on sustained market trends. A core strategy involves monitoring the slope and position of the Dynamic line in relation to the price. A rising McGinley Dynamic line beneath the price suggests a healthy uptrend, signaling traders to maintain or initiate long positions. Conversely, a falling Dynamic line above the price implies a downtrend, indicating potential short-selling opportunities.
To refine this trend-following approach, traders can look for the Dynamic line to act as a trailing stop. As long as the price remains above the line in an uptrend (or below in a downtrend), the position is held. A close below (or above) the line in the respective trend could trigger an exit, ensuring that trades are exited when the trend may be waning. This method capitalizes on the Dynamic line’s ability to provide a more accurate representation of the current trend state, mitigating the risk of premature exits that can occur with more static types of moving averages.
Entry points can be further optimized by observing the Dynamic line’s angle. A steeper slope on the line often indicates a stronger trend and could be used as a confirmation for entry. Traders should be cautious when the line begins to flatten out, as this may signal a slowing momentum or an impending trend pause or reversal.
| Trend | McGinley Dynamic Slope | Position Relative to Price | Trading Action |
| Uptrend | Rising | Below Price | Maintain/Initiate Longs |
| Downtrend | Falling | Above Price | Consider/Initiate Shorts |
| Trend Strength | Steeper Slope | – | Confirm Entry Point |
| Trend Weakening | Flattening | – | Prepare for Possible Exit |
While the McGinley Dynamic is a powerful trend-following tool, its effectiveness increases when used in conjunction with price action. Breakouts, pullbacks, and consolidations identified through price analysis can provide additional context to the indicator’s readings, allowing for more nuanced trade decisions.
Incorporating the McGinley Dynamic into a trend-following strategy enhances a trader’s ability to ride trends while managing risk with dynamic exit points. The key to success lies in the continuous analysis of the Dynamic line’s behavior in relation to price action, ensuring that decisions are made based on current market conditions rather than lagging or static indicators.
4.2. Reversion to Mean Strategies with McGinley Dynamic
Reversion to Mean Strategies with McGinley Dynamic
Reversion to the mean strategies capitalize on the principle that prices tend to return to a long-term average. The McGinley Dynamic, with its smoothing mechanism, serves as an excellent tool to identify the mean or average price over a given period. When prices deviate significantly from the McGinley Dynamic line, it may signal an overextended market that could revert to its mean.
Traders employing this strategy should monitor the distance between the price and the McGinley Dynamic line. An unusually large gap may indicate an overbought or oversold condition, suggesting a potential price correction towards the Dynamic line. The key is to look for extreme deviations from the mean, as these present the highest probability opportunities for reversion trades.
Confirmation signals are critical in executing reversion strategies. Traders might look for candlestick patterns such as dojis or hammers at the point of extreme deviation, which could suggest a pause or reversal in price momentum. Additionally, oscillator indicators like the Relative Strength Index (RSI) or Bollinger Bands can provide confluence, indicating when conditions have become overextended.
| Condition | Indicator | Signal Suggested |
| Overextended from Mean | McGinley Dynamic | Potential Reversion Setup |
| Candlestick Pattern | Doji, Hammer | Reversal Confirmation |
| Oscillator Confluence | RSI, Bollinger Bands | Overbought/Oversold Validation |
It’s important for traders to set clear parameters for entering and exiting reversion trades. A common approach is to enter a trade as the price begins to revert from an extreme deviation and exit when it reaches or crosses the McGinley Dynamic line. This strategy assumes that the Dynamic line will act as a magnet, pulling prices back towards it. Implementing stop-loss orders beyond the extreme points can help manage risk should the market not revert as expected.
By integrating the McGinley Dynamic into reversion to mean strategies, traders are equipped with a dynamic benchmark that adjusts to market conditions, enhancing the identification of potential reversion points and the timing of trades.
4.3. Adjusting McGinley Dynamic for Volatility
Adjusting McGinley Dynamic for High Volatility
In periods of high market volatility, the McGinley Dynamic’s sensitivity may need adjustment to maintain its effectiveness as a trend-following indicator. High volatility can cause more frequent and larger price swings, potentially leading to false signals if the Dynamic line is too responsive. Traders can increase the Dynamic Constant (N), which is the key parameter in the McGinley Dynamic formula, to reduce the indicator’s sensitivity to price movements.
The Dynamic Constant, typically set between 8 and 21, can be adjusted based on the average true range (ATR) or historical volatility measures. A higher Dynamic Constant value will smooth the indicator further, making it less prone to react to sudden price spikes or drops. This adjustment helps in filtering out the noise and focuses on the underlying trend.
| Volatility Level | Adjustment | Effect on McGinley Dynamic |
| High Volatility | Increase Dynamic Constant (N) | Reduces sensitivity, smooths line further |
Conversely, during periods of low volatility, the McGinley Dynamic may become too slow to react to price changes, which can delay entry and exit signals. In such cases, traders might consider lowering the Dynamic Constant to make the indicator more responsive to market movements. This ensures that the Dynamic line remains an effective tool for trend confirmation, even when price changes are less pronounced.
It’s crucial for traders to regularly assess the market’s volatility and adjust the McGinley Dynamic accordingly. By doing so, they can ensure that the indicator remains an accurate reflection of market conditions, providing reliable signals for trend following or reversion to mean strategies.
Adjusting McGinley Dynamic for Low Volatility
For low volatility environments, the McGinley Dynamic may lag excessively, necessitating a decrease in the Dynamic Constant to capture more subtle trend shifts. A lower N value increases the indicator’s responsiveness, allowing it to adjust more quickly to price movements and providing traders with timely trend information.
| Volatility Level | Adjustment | Effect on McGinley Dynamic |
| Low Volatility | Decrease Dynamic Constant (N) | Increases sensitivity, makes line more reactive |
To optimize the McGinley Dynamic for various volatility regimes, traders can employ backtesting techniques. Testing different Dynamic Constant values against historical data provides insights into how the indicator would have performed during past volatility fluctuations, enabling traders to fine-tune the parameter for future use.
5. What to Consider When Using McGinley Dynamic?
Assessing Market Context
When implementing the McGinley Dynamic, traders must evaluate the market context to ensure the indicator’s settings are appropriate. The market’s phase—whether trending or range-bound—impacts the effectiveness of the McGinley Dynamic. In a strong trend, the indicator can be a valuable tool for maintaining positions in the direction of the trend, but in a sideways market, its signals might be less reliable due to the absence of a clear trend.
Adjusting the Dynamic Constant
The Dynamic Constant (N) is a critical parameter that influences the responsiveness of the McGinley Dynamic. Traders should adjust it based on the current volatility of the market. A larger N value suits periods of high volatility, providing a smoother line that filters out noise. Conversely, a smaller N value is better for low volatility conditions, capturing price movements more accurately.
Complementary Indicators
Relying solely on the McGinley Dynamic can lead to incomplete analysis. It is most effective when combined with other technical tools. Indicators that measure volume, momentum, or market sentiment can provide additional confirmation and enhance the overall trading strategy. For example, integrating the McGinley Dynamic with oscillators can help identify overbought or oversold conditions, while volume indicators can confirm the strength of a trend.
Backtesting and Optimization
Before applying the McGinley Dynamic in live trading, it is essential to backtest the strategy. Backtesting allows traders to optimize the Dynamic Constant and evaluate the indicator’s past performance across different market conditions. This process helps in refining the strategy and setting realistic expectations for the indicator’s behavior.
Risk Management Considerations
Finally, while the McGinley Dynamic can inform entry and exit points, it should not be the sole determinant of trade decisions. Traders must incorporate solid risk management practices, including the use of stop-loss orders and position sizing, to protect against losses. The McGinley Dynamic can serve as a dynamic stop-loss level, but traders should also consider the overall risk profile of their trading strategy and the potential for market anomalies that could affect the indicator’s performance.
| Consideration | Importance | Action Required |
| Market Context | High | Adjust settings based on trend or range-bound conditions |
| Dynamic Constant (N) | Critical | Modify based on market volatility |
| Complementary Indicators | High | Use additional technical tools for confirmation |
| Backtesting and Optimization | Essential | Test and optimize before live trading |
| Risk Management | Crucial | Implement stop-loss and position sizing strategies |
5.1. Market Conditions and McGinley Dynamic Effectiveness
Market Conditions and McGinley Dynamic Effectiveness
The effectiveness of the McGinley Dynamic is closely linked to prevailing market conditions. Trending markets amplify the indicator’s strengths, as its smoothing mechanism aligns well with persistent directional moves. In such environments, the Dynamic line can serve as a reliable gauge for the trend’s strength and a marker for dynamic support or resistance levels. Traders benefit from the indicator’s adaptiveness, which can help maintain positions in the market’s direction until a significant trend reversal occurs.
In contrast, range-bound or choppy markets can diminish the McGinley Dynamic’s utility. Its design to follow price action means that lateral price movements can result in the Dynamic line offering little to no insight into market direction. The line may oscillate without a clear trend, leading to potential false signals if used as a standalone tool for trade initiation or exit.
To optimize the indicator’s performance, traders should assess the market’s phase. During consolidation periods, it may be prudent to rely more heavily on other forms of analysis or to adjust the Dynamic Constant to better filter out market noise. Conversely, when a clear trend is present, traders can capitalize on the Dynamic line’s ability to track price movements more closely than traditional moving averages.
| Market Type | McGinley Dynamic Application | Consideration |
| Trending | Follows price closely; good for trend confirmation | Use as dynamic support/resistance |
| Range-bound | Less effective due to lateral movement | Combine with other analysis or adjust settings |
It’s essential for traders to recognize that no indicator is infallible or universally applicable. The McGinley Dynamic, like any technical tool, should be used in conjunction with a comprehensive trading plan that considers various market factors and adheres to sound risk management principles.
5.2. Limitations of McGinley Dynamic
Lag in Rapid Market Reversals
The McGinley Dynamic, despite its adaptive nature, is not immune to the fundamental limitation of all trend-following indicators: lag. In markets that experience swift reversals, the indicator may not adjust quickly enough, potentially leading to delayed exit signals and, consequently, greater drawdowns. This lag is inherent to the formulaic smoothing and can cause traders to hold onto positions longer than optimal in fast-changing market environments.
False Signals in Sideways Markets
Another limitation arises in sideways markets. Here, the McGinley Dynamic may produce false signals as it attempts to adapt to minor price fluctuations that lack significance in a non-trending context. This can result in a series of unprofitable trades if the indicator’s readings are followed without supplementary analysis to filter out these conditions.
Over-Reliance on the Dynamic Constant
The effectiveness of the McGinley Dynamic hinges on the appropriate setting of the Dynamic Constant (N). An over-reliance on a single value for N across diverse market conditions can lead to suboptimal performance. Traders must actively manage and adjust N to suit the prevailing volatility, which introduces a degree of subjectivity and complexity into the indicator’s use.
Singular Focus on Price
The McGinley Dynamic’s focus is solely on price, overlooking other market factors such as volume, open interest, and sentiment. This singular focus can be a disadvantage because it does not account for the multifaceted nature of market dynamics, which can be especially critical in confirming the strength or weakness of a given trend.
No Explicit Signals for Trade Entries and Exits
Lastly, the McGinley Dynamic does not provide explicit trade entry and exit signals. Instead, it offers a view of the market trend that requires interpretation and confirmation through other means. Traders seeking clear-cut signals may find this aspect of the indicator less appealing, necessitating the integration of additional tools to formulate actionable trading decisions.
5.3. Combining McGinley Dynamic with Risk Management Techniques
Risk Parameters Aligned with the Dynamic Line
Integrating the McGinley Dynamic within a risk management framework involves setting risk parameters that are in harmony with the indicator’s behavior. For instance, a dynamic stop-loss can be placed just below the Dynamic line in an uptrend or above it in a downtrend, moving in tandem with price changes. This type of stop-loss adapts to the market’s volatility, tightening during quieter periods and widening during more volatile phases, thus allowing for a flexible exit strategy that aligns with the current market state.
Position Sizing Based on Market Volatility
Position sizing should reflect the prevailing market conditions, which the McGinley Dynamic helps to interpret. When volatility is high and the Dynamic line is adjusted accordingly, it may be prudent to reduce position sizes to account for the increased risk of larger price swings. Conversely, in low volatility scenarios where the Dynamic line is more responsive, traders might be more confident in taking larger positions due to the reduced risk of sudden market moves.
| Volatility | Position Size | Rationale |
| High | Smaller | Accommodate wider stop-loss, reduce risk |
| Low | Larger | Tighter stop-loss possible, capitalize on stability |
Adjusting the Dynamic Constant for Risk Control
The Dynamic Constant (N) not only affects the indicator’s sensitivity but also plays a role in risk management. A higher N value during volatile periods can serve as a buffer against market noise, preventing traders from being stopped out prematurely. Meanwhile, a lower N value in calm markets allows for a closer following stop, protecting profits without foregoing potential gains from a continuing trend.
Capital Preservation with Dynamic Exits
The McGinley Dynamic’s primary function in risk management is to protect capital by providing dynamic exit points. These exits are not arbitrary but are based on the indicator’s real-time assessment of price action. By exiting when the price crosses the Dynamic line, traders can effectively lock in profits and prevent large drawdowns, as the line represents a moving threshold of trend sustainability.
Leveraging the Indicator for Diversified Risk
Lastly, the McGinley Dynamic can be used to diversify risk across a portfolio of trades. By analyzing the indicator across different timeframes and assets, traders can identify varying trends and volatility levels, allowing for risk dispersion. Diversifying trades based on the Dynamic’s readings ensures that risk exposure is not concentrated in a single market condition or asset, leading to a more balanced and resilient trading approach.