
1. Overview of RSI Divergence
The Relative Strength Index (RSI) Divergence is a concept used by traders and investors to identify potential reversals in market trends. It combines the concepts of RSI, a momentum oscillator that measures the speed and change of price movements, with the principle of divergence, a situation where the price of an asset moves in the opposite direction of a technical indicator. This section aims to introduce beginners to the RSI Divergence, explaining its basics, how it works, and its importance in trading.
1.1 What is RSI?
Before diving into RSI divergence, it’s crucial to understand the Relative Strength Index (RSI) itself. Developed by J. Welles Wilder Jr. in 1978, the RSI is a momentum oscillator that ranges from 0 to 100 and is used to gauge overbought or oversold conditions in the price of an asset. A common interpretation is that an asset is considered overbought when the RSI is above 70 and oversold when it is below 30.
1.2 Understanding Divergence
Divergence occurs when the price of an asset is moving in the opposite direction of a technical indicator or another data point. In the context of the RSI, divergence can be a powerful signal indicating that the current price trend may be weakening and a potential reversal could be on the horizon.
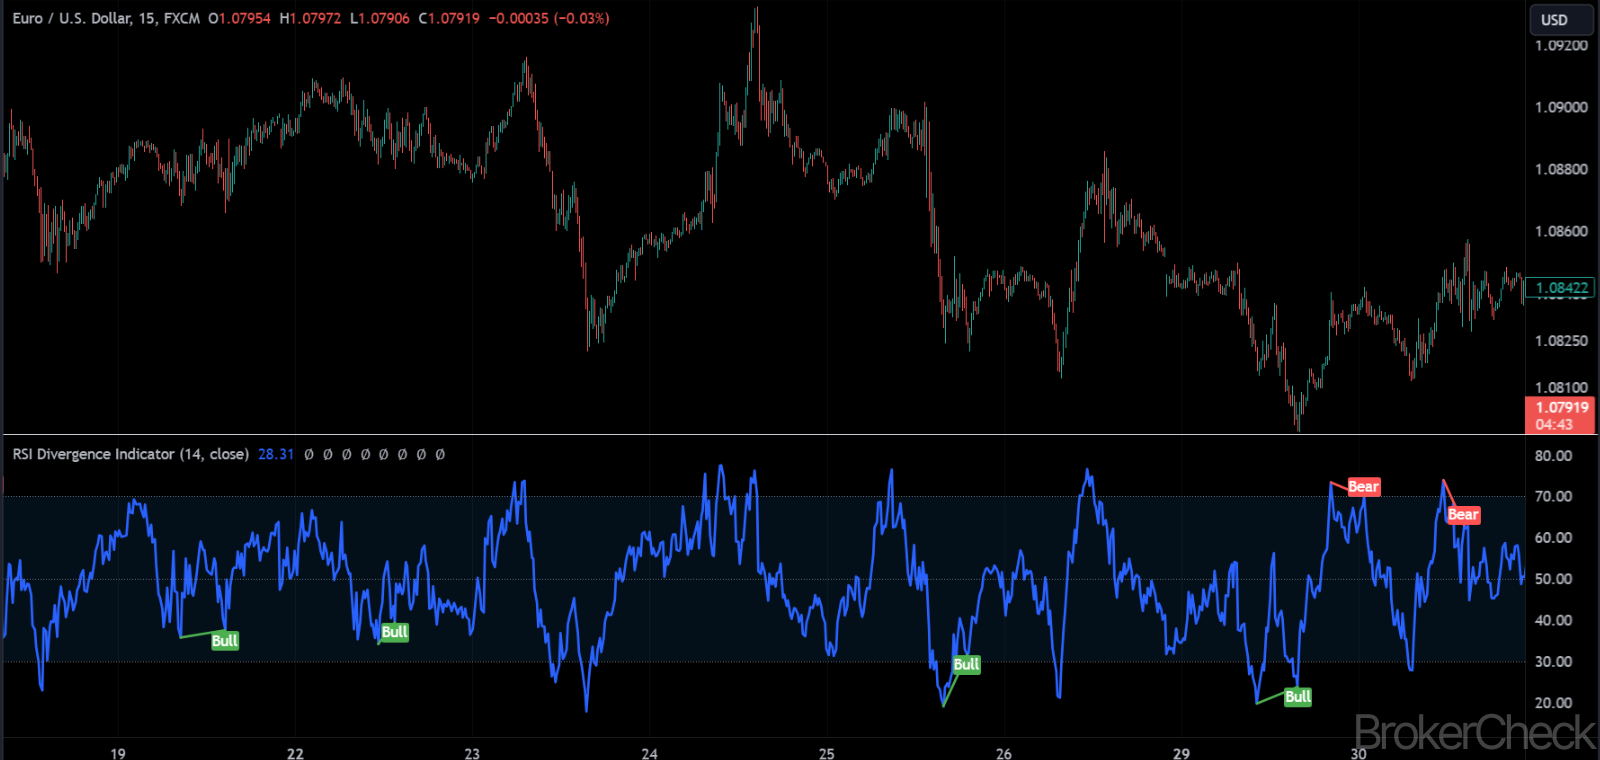
- Bullish Divergence: This happens when the price creates a lower low, but the RSI forms a higher low. It suggests that while the price is dropping, the downward momentum is decreasing, indicating a potential upward reversal.
- Bearish Divergence: Conversely, bearish divergence occurs when the price hits a higher high, but the RSI makes a lower high. This signals that despite the increasing price, the upward momentum is fading, which could lead to a downward reversal.
1.3 Importance of RSI Divergence in Trading
RSI Divergence is valued by traders for several reasons:
- Predictive Value: It can provide early warning signs of a potential trend reversal, allowing traders to adjust their positions accordingly.
- Risk Management: By identifying potential reversals early, traders can set tighter stop losses and manage their risk more effectively.
- Versatility: RSI Divergence can be used in various market conditions and applies to a wide range of financial instruments, including stocks, forex, commodities, and cryptocurrencies.
| Feature | Description |
| Indicator Type | Momentum Oscillator |
| Main Purpose | Identify potential trend reversals by detecting divergence between price movement and RSI readings. |
| Common Thresholds | Overbought (>70), Oversold (<30) |
| Divergence Type | Bullish (Price ↓, RSI ↑), Bearish (Price ↑, RSI ↓) |
| Applicability | Stocks, Forex, Commodities, Cryptocurrencies |
| Importance | Predictive value for reversals, risk management, versatility |
2. Calculation Process of RSI
Understanding the calculation behind the Relative Strength Index (RSI) and identifying divergence requires a step-by-step approach. This section breaks down the process into manageable parts, ensuring that beginners can grasp how to calculate RSI and subsequently recognize divergence signals. The RSI itself is a momentum oscillator, measuring the speed and change of price movements within a specific period, typically 14 days.
2.1 Calculating the RSI
The calculation of the RSI involves several steps, focusing on average gains and losses over a specified period, traditionally set to 14 periods. Here’s a simplified breakdown:
- Select the Period: The standard period for RSI calculation is 14, which can be days, weeks, or any time frame the trader chooses.
- Calculate Average Gains and Losses: For the chosen period, calculate the average of all gains and losses. On the first calculation, simply sum up all gains and losses, then divide by the period (14).
- Smooth the Calculation: After the initial average gain and loss are calculated, subsequent calculations are smoothed by taking the previous average, multiplying it by 13, adding the current gain or loss, and then dividing the total by 14.
- Compute the Relative Strength (RS): This is the ratio of average gain to average loss.
- Calculate the RSI: Use the formula (RSI = 100 – \frac{100}{1 + RS}), where RS is the Relative Strength.
| Step | Description |
| 1. Select Period | Typically 14 periods; determine the timeframe for RSI calculation. |
| 2. Average Gains/Losses | Calculate the average of all gains and losses over the period. |
| 3. Smooth Calculation | Use previous averages for ongoing RSI updates, smoothing the data. |
| 4. Compute RS | The ratio of average gain to average loss. |
| 5. Calculate RSI | Apply the RSI formula to determine the indicator’s value. |
3. Optimal Values for Setup in Different Timeframes
Choosing the optimal values for the RSI setup across various timeframes is essential for maximizing its effectiveness in trading strategies. This section guides beginners through selecting the best parameters for the RSI and understanding how these choices impact the indicator’s performance in different market conditions.
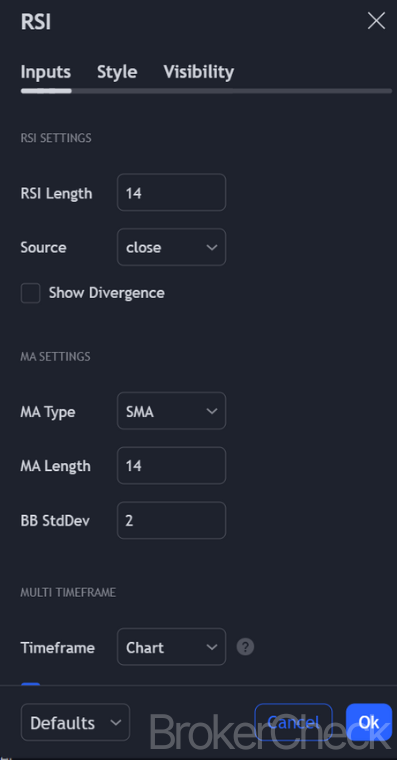
3.1 Standard RSI Settings
The standard setting for the Relative Strength Index (RSI) is 14 periods, which is versatile and widely used across many assets and timeframes. However, adjusting the period can fine-tune the indicator’s sensitivity:
- Shorter Periods (e.g., 9 or 10): Increase sensitivity, making the RSI more reactive to price changes. This is beneficial for short-term trading or scalping, as it can highlight shorter-term trends and reversals more quickly.
- Longer Periods (e.g., 20 or 25): Decrease sensitivity, smoothing out the RSI’s fluctuations. This approach suits longer-term trading strategies, providing a clearer view of the overall trend direction without the noise of short-term price movements.
3.2 Adjusting for Different Timeframes
The optimal RSI settings can vary depending on the trading timeframe:
- Day Trading (Short-term): For day traders, using a shorter RSI period (e.g., 9 to 10) can be more effective. This setting helps capture quick, significant movements, as these traders are more interested in short-term price action.
- Swing Trading (Medium-term): Swing traders may find the standard 14-period RSI or slightly adjusted values (e.g., 12 or 16) more suitable. These settings offer a balance between sensitivity and the ability to filter out market noise, aligning well with the medium-term nature of swing trading.
- Position Trading (Long-term): For position traders, a longer RSI period (e.g., 20 to 25) may provide better signals. These settings reduce the RSI’s sensitivity to short-term price changes, focusing on the underlying trend strength and offering clearer signals for long-term position adjustments.
3.3 Divergence Detection in Different Timeframes
The detection of RSI divergence also depends on the selected timeframe and settings:
- Short-term Timeframes: Require more frequent monitoring and a quicker reaction to divergence signals, given the increased market noise and the higher number of false signals.
- Long-term Timeframes: Divergence signals are generally more reliable but occur less frequently. Traders need to be patient and may use additional confirmation tools to validate divergence signals before taking action.
3.4 Practical Tips for Setting Up RSI Divergence
- Experiment with Settings: Traders should experiment with different RSI periods to find the optimal setting that matches their trading style and the volatility of the asset they are trading.
- Use Additional Confirmation: Regardless of the timeframe, using additional indicators or analysis techniques for confirmation can enhance the reliability of divergence signals.
- Consider Market Conditions: The effectiveness of specific RSI settings can vary in different market conditions (e.g., trending vs. range-bound markets), so it’s crucial to adjust settings based on current market dynamics.
| Trading Style | Suggested RSI Period | Advantages | Considerations |
| Day Trading | 9-10 | Quick to react, captures short-term movements | Higher potential for false signals |
| Swing Trading | 12-16 | Balances sensitivity and noise filtering | Requires careful monitoring and adjustment |
| Position Trading | 20-25 | Filters out short-term noise focuses on trends | Signals may come late; requires patience |
4. Interpretation and Application of RSI Divergence Signals
Interpreting and applying RSI divergence signals correctly is crucial for traders looking to leverage this indicator for identifying potential trend reversals. This section aims to guide beginners through the process of interpreting RSI divergence signals and how to apply them effectively in trading decisions.
4.1 Understanding RSI Divergence Signals
RSI Divergence signals come in two primary forms: bullish and bearish divergences, each indicating a potential reversal in the current trend.
- Bullish Divergence: Occurs when the price records a lower low, but the RSI marks a higher low. This indicates weakening downward momentum and a possible upcoming upward trend reversal.
- Bearish Divergence: Happens when the price achieves a higher high, but the RSI shows a lower high. This suggests that upward momentum is decreasing, potentially leading to a downward trend reversal.
4.2 Application in Trading Strategies
The application of RSI divergence signals in trading strategies involves several key steps:
- Signal Identification: First, identify a clear divergence between the price action and the RSI readings. This requires a visible discrepancy in the direction of the price and the RSI trend lines.
- Confirmation: Look for additional confirmation of the trend reversal. This could be a reversal candlestick pattern, a breakout from a trend line, or confirmation from another indicator.
- Entry Point: Determine an entry point based on the confirmation signals. Traders often wait for a specific candlestick pattern to complete or for the price to break a certain level before entering a trade.
- Stop Loss and Take Profit: Set a stop loss to manage risk, typically at the recent low or high before the divergence signal. The take profit level can be set based on key resistance or support levels, or using a risk-reward ratio that aligns with the trader’s strategy.
4.3 Practical Examples
- Bullish Divergence Example: Imagine a scenario where a stock price drops to a new low, but the RSI forms a higher low. If this is followed by a bullish engulfing candlestick pattern, a trader might enter a long position at the close of the candle, setting a stop loss below the recent low and a take profit at a previous resistance level or using a 2:1 risk-reward ratio.

- Bearish Divergence Example: Conversely, if a stock price reaches a new high with the RSI forming a lower high and is followed by a bearish reversal candlestick pattern, this could signal a good opportunity to enter a short position. The trader would set a stop loss above the recent high and a take profit at a known support level or based on their risk-reward preferences.
| Step | Description |
| Signal Identification | Look for discrepancies between price lows/highs and RSI lows/highs indicating divergence. |
| Confirmation | Seek additional signals (e.g., candlestick patterns, other indicators) to confirm trend reversal. |
| Entry Point | Enter the trade based on confirmation signals, considering the optimal timing and market context. |
| Stop Loss and Take Profit | Set stop loss at recent low/high before the divergence and take profit at strategic levels. |
5. Combining RSI Divergence with Other Indicators
To enhance the effectiveness of RSI Divergence signals, traders often combine them with other technical indicators. This multifaceted approach helps confirm signals, reduce false positives, and improve the overall decision-making process. This section will guide beginners on how to effectively combine RSI Divergence with other indicators to create a more robust trading strategy.
5.1 Key Indicators to Combine with RSI Divergence
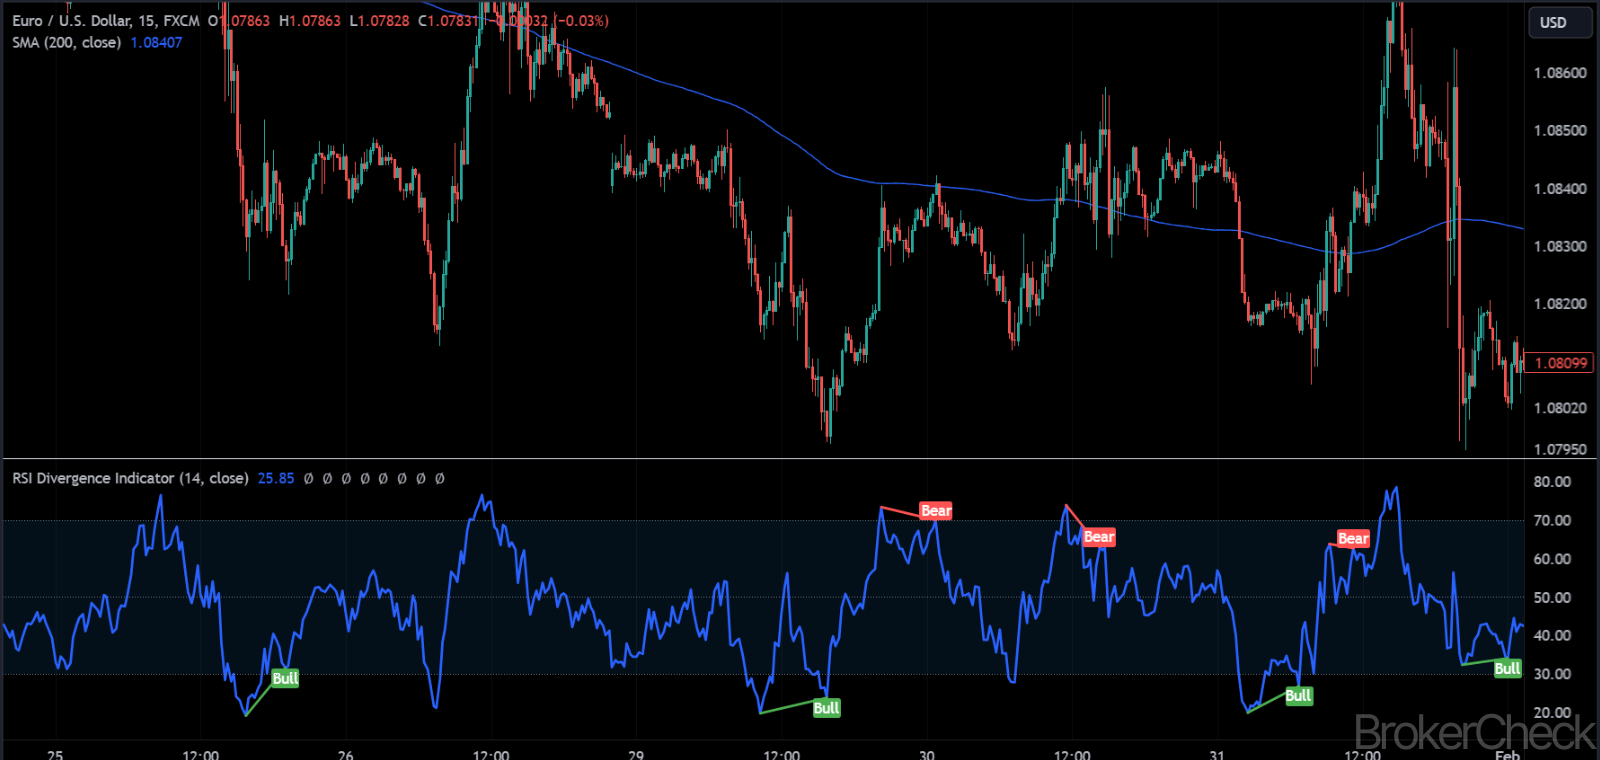
- Moving Averages (MAs): Moving Averages smooth out price data to create a single flowing line, making it easier to identify the direction of the trend. Combining RSI Divergence with MAs (such as the 50-day or 200-day MA) can help confirm the strength of the trend reversal.
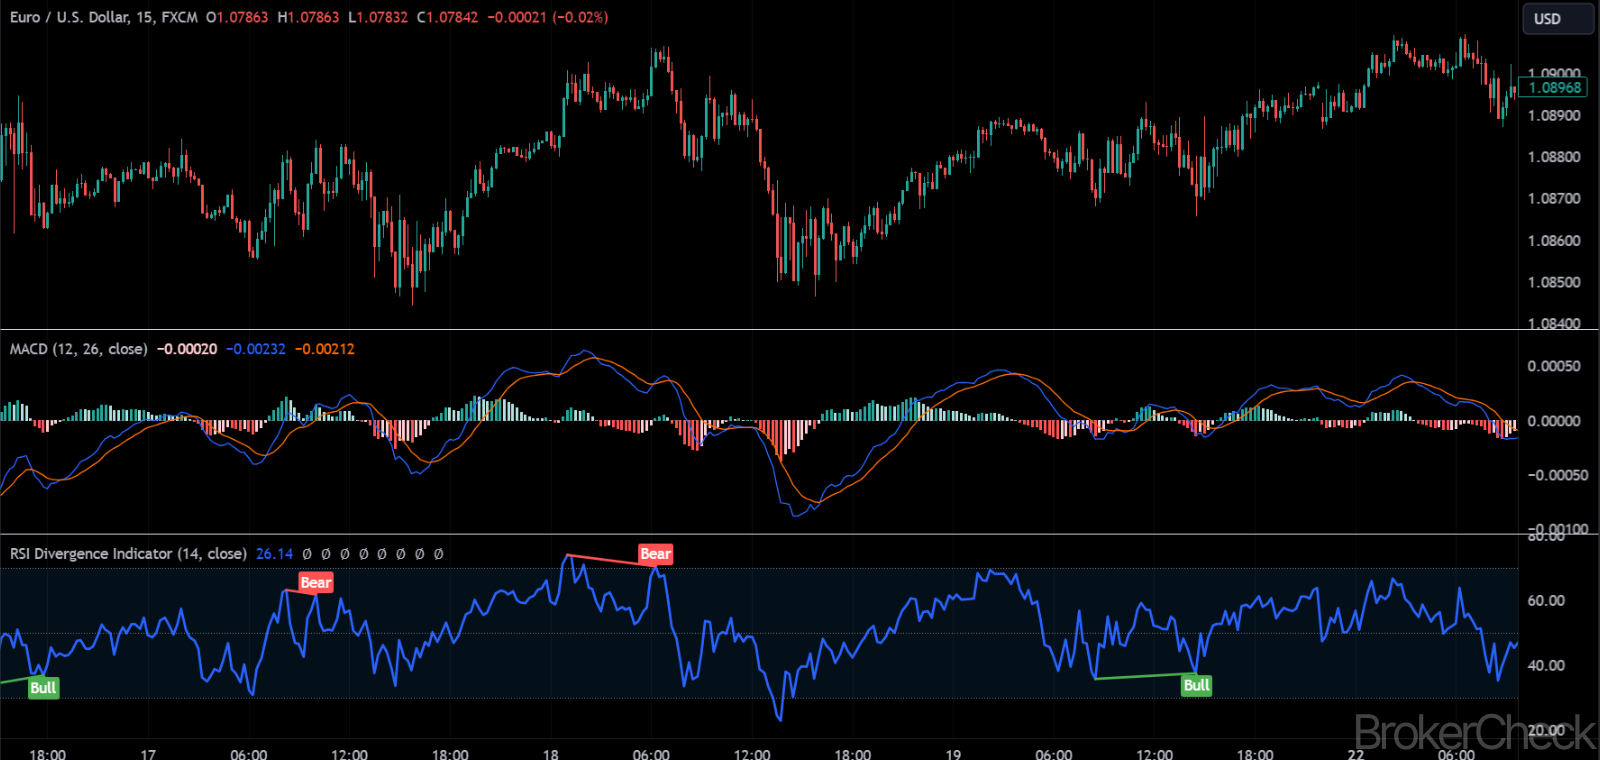
- MACD (Moving Average Convergence Divergence): The MACD measures the momentum of an asset by comparing two moving averages. A divergence between the MACD and the price action, when occurring alongside RSI Divergence, can provide a stronger signal for a potential trend reversal.
- Stochastic Oscillator: Similar to the RSI, the Stochastic Oscillator measures the momentum of price movements. When both Stochastic and RSI indicators show divergence with the price simultaneously, it can indicate a high probability of a trend reversal.
- Volume Indicators: Volume indicators, such as the On-Balance Volume (OBV), can confirm the strength of a trend reversal signaled by RSI Divergence. An increase in volume in the direction of the reversal adds credibility to the signal.
5.2 How to Combine Indicators with RSI Divergence
- Trend Confirmation: Use Moving Averages to confirm the overall trend direction. A bullish RSI Divergence in an uptrend or a bearish divergence in a downtrend can be a strong signal.
- Momentum Confirmation: The MACD can help confirm the momentum shift suggested by RSI Divergence. Look for the MACD line to cross its signal line or show divergence that aligns with the RSI signal.
- Validation with Stochastic Oscillator: Confirm the RSI Divergence with divergence in the Stochastic Oscillator, especially in overbought or oversold regions.
- Volume Confirmation: Check volume indicators to ensure that volume supports the reversal signal. Increasing volume on the direction of the reversal lends weight to the divergence signal.
5.3 Practical Application and Examples
- Combining RSI and MACD: If the RSI shows bullish divergence at the same time the MACD crosses above its signal line, this could be a strong buy signal.
- RSI Divergence and Moving Averages: Spotting RSI Divergence while the price is approaching a significant moving average (like the 200-day MA) can indicate a potential bounce off the MA, confirming a trend reversal.
5.4 Best Practices for Combining Indicators
- Avoid Redundancy: Select indicators that provide different types of information (trend, momentum, volume) to avoid redundant signals.
- Look for Confluence: The best signals occur when there is confluence between multiple indicators, suggesting a higher probability of a successful trade.
- Backtesting: Always backtest your strategy on historical data to ensure its effectiveness before applying it in real trading scenarios.
| Indicator | Purpose | How to Combine with RSI Divergence |
| Moving Averages | Trend confirmation | Confirm the trend direction with MAs. |
| MACD | Momentum confirmation | Look for MACD line crossovers and divergence. |
| Stochastic Oscillator | Momentum and overbought/oversold levels | Confirm divergence especially in extreme levels. |
| Volume Indicators | Confirm strength of trend reversal | Check for volume increase on the direction of the reversal. |
6. Risk Management with RSI Divergence Trading
Effective risk management is essential when trading with the RSI Divergence, as with any trading strategy. This section will discuss how traders can implement risk management techniques to safeguard their investments while utilizing RSI Divergence signals. The aim is to help beginners understand the importance of managing risk and provide practical methods to apply these principles in their trading activities.
6.1 Setting Stop Losses
One of the fundamental aspects of risk management is the use of stop-loss orders. When trading on RSI Divergence signals:
- For Bullish Divergence: Place the stop loss just below the most recent low in the price action that corresponds with the divergence signal.
- For Bearish Divergence: Set the stop loss just above the recent high associated with the divergence.
This strategy helps limit potential losses if the market does not move in the anticipated direction after a divergence signal.
6.2 Position Sizing
Position sizing is crucial to manage the amount of risk taken on each trade. It involves determining how much capital to allocate to a trade based on the stop loss and the trader’s risk tolerance. A common rule is to risk no more than 1-2% of the trading capital on a single trade. This way, even a series of losses won’t significantly impact the overall capital.
6.3 Using Take Profit Orders
While stop losses protect against large losses, take profit orders are used to secure profits at a predetermined price level. Setting take profit levels requires analyzing the chart for potential resistance (in a bullish setup) or support levels (in a bearish setup) where the price might reverse.
6.4 Diversification
Diversification across different assets or strategies can reduce risk. When trading based on RSI Divergence signals, consider applying the strategy across various markets or instruments. This approach spreads the risk and can protect the portfolio from volatility in a single asset.
6.5 Continuous Monitoring and Adjustment
Markets are dynamic, and conditions can change rapidly. Continuous monitoring of open positions allows traders to adjust stop losses, take profit orders, or close positions manually to respond to new information or market movements. This adaptability can significantly enhance risk management.
6.6 Practical Risk Management Example
Assuming a trader has a $10,000 trading account and follows the 2% risk rule, they should risk no more than $200 on a single trade. If the stop loss is set 50 pips away from the entry point in a Forex trade, the position size should be adjusted so that each pip movement equals no more than $4 ($200 risk divided by 50 pips).
| Risk Management Technique | Description |
| Setting Stop Losses | Place stop losses to limit potential losses, based on the recent lows/highs from the divergence signal. |
| Position Sizing | Determine the trade size based on the stop loss distance and risk tolerance, often 1-2% of capital. |
| Using Take Profit Orders | Set take profit levels at strategic points to secure profits before potential trend reversals. |
| Diversification | Spread risk by applying the strategy across different assets or instruments. |
| Continuous Monitoring and Adjustment | Adjust stop losses, take profits, or close positions as market conditions change. |