1. What is the Ultimate Oscillator?
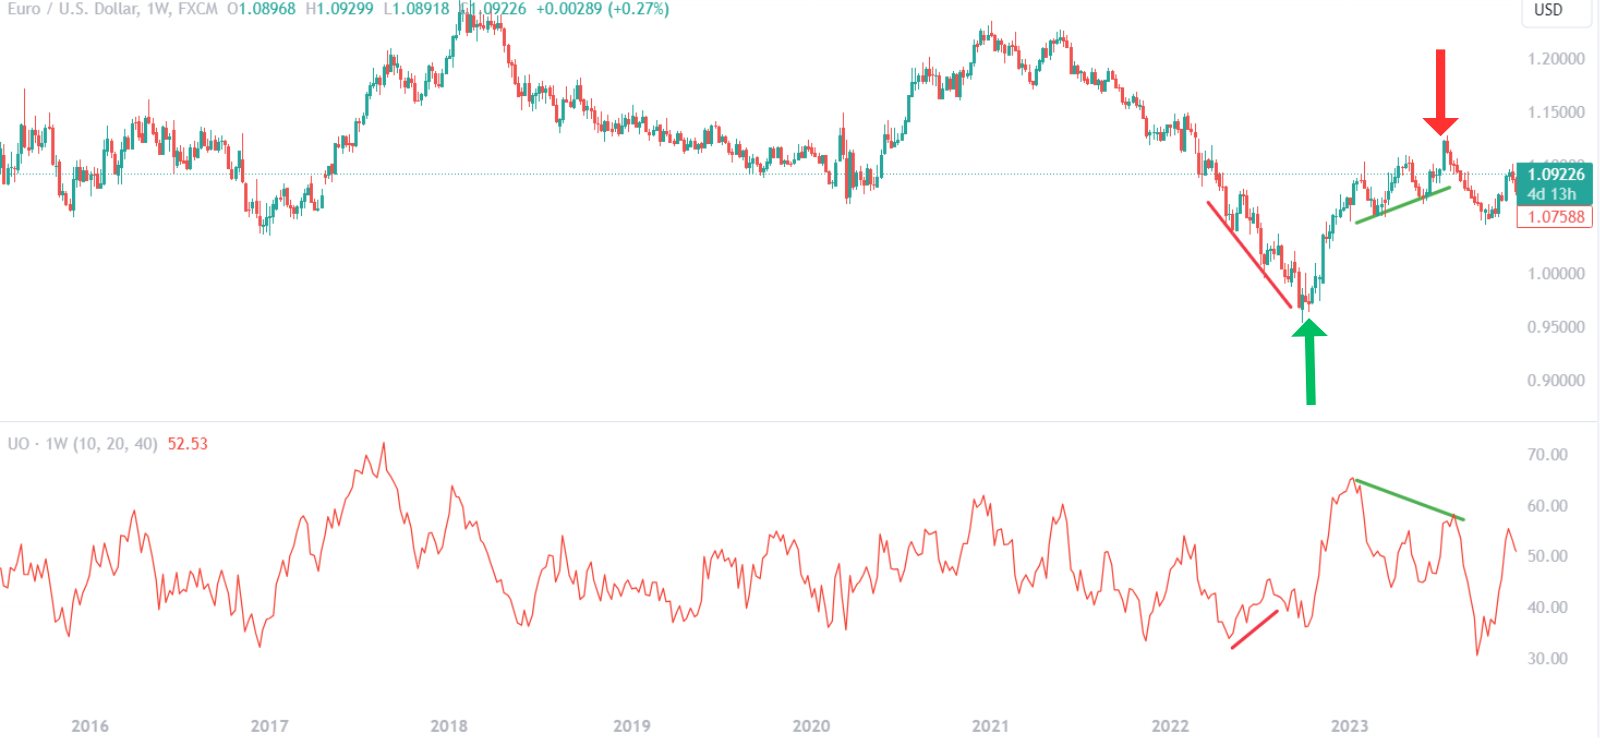
In the realm of trading, the divergence between the Ultimate Oscillator and price action is a crucial signal for traders. A bullish divergence occurs when the price records a lower low, but the oscillator forms a higher low, suggesting weakening downward momentum. Conversely, a bearish divergence is when the price hits a higher high while the oscillator creates a lower high, indicating fading upward momentum. Traders should watch these divergence patterns closely, as they often precede significant price reversals.
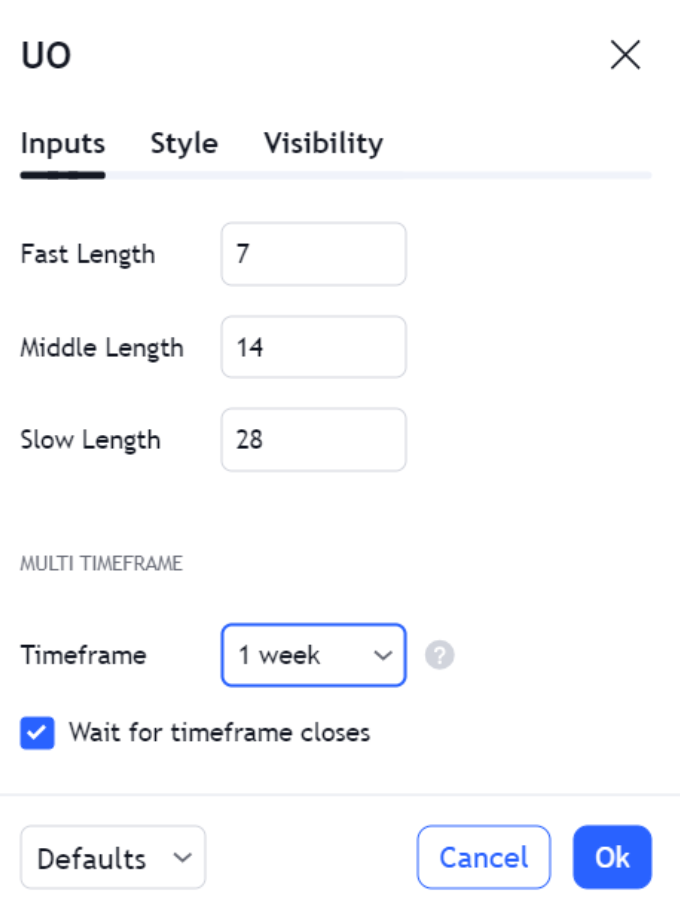
The Ultimate Oscillator’s formula is a blend of three different time period oscillators, typically 7-period, 14-period, and 28-period. The final value is a weighted sum of these three oscillators, with the longer time periods receiving less weight. This weighting is based on the belief that more recent data is more relevant to current market conditions.
Here’s a basic outline of the calculation process:
- Calculate the Buying Pressure (BP) and the True Range (TR) for each period.
- Sum the BP and TR for each of the three timeframes.
- Create a raw score for each timeframe by dividing the sum of BP by the sum of TR.
- Apply a weight to each timeframe (the 7-period has the highest weight, followed by the 14-period, and then the 28-period).
- The final Ultimate Oscillator reading is the weighted sum of the three timeframes.
Effective use of the Ultimate Oscillator involves not just recognizing overbought or oversold conditions, but also understanding how the oscillator behaves in relation to the price. For instance, if the market is making new highs but the Ultimate Oscillator is not, it may be a sign that the market is running out of steam.
Additionally, traders may also employ other technical analysis tools in conjunction with the Ultimate Oscillator to confirm signals. For example, using trend lines, support and resistance levels, and volume analysis can provide a more robust trading strategy.
Key points to remember when using the Ultimate Oscillator include:
- Monitor for divergence between the oscillator and price to identify potential reversals.
- Consider the overbought (>70) and oversold (<30) threshold levels as alerts rather than absolute buy or sell signals.
- Use multiple technical analysis tools to confirm the signals provided by the Ultimate Oscillator for increased reliability.
- Be aware of the market context and ensure that signals from the oscillator align with the broader market trend.
By taking into account these aspects, traders can leverage the Ultimate Oscillator to gain insights into market momentum and make more informed trading decisions.

2. How to Set Up the Ultimate Oscillator?
Configuring the Ultimate Oscillator for Optimal Performance
When setting up the Ultimate Oscillator, it’s crucial to tailor it to your trading strategy and the unique behavior of the market you’re analyzing. Here’s a step-by-step guide on how to customize this powerful tool:
- Select Timeframes:
- Short-term period: 7 days
- Intermediate period: 14 days
- Long-term period: 28 days
These periods can be adjusted based on the asset’s volatility and the trader’s preference for more or less sensitivity.
- Adjust Overbought/Oversold Thresholds:
- Default settings:
- Overbought level: 70
- Oversold level: 30
- Adjusted settings for high volatility:
- Overbought level: 80
- Oversold level: 20
Tweaking these levels can help in adapting to different market conditions and reducing false signals.
- Default settings:
- Fine-Tuning and Backtesting:
- Use historical data to backtest different settings.
- Analyze the frequency and accuracy of the signals generated.
- Adjust the timeframes and thresholds to find the best fit for your trading style.
Key Considerations:
- Market Cycles: Ensure the selected timeframes adequately represent the various cycles in the market.
- Asset Characteristics: Consider the unique price patterns and volatility of the asset.
- Risk Tolerance: Align the oscillator settings with your risk management strategy.
By meticulously configuring the Ultimate Oscillator, traders can enhance its effectiveness, leading to more informed trading decisions. Remember, the goal is to integrate the oscillator into your overall trading plan, complementing other analysis techniques and indicators.
| Timeframe | Default Setting | Adjusted Setting (High Volatility) |
|---|---|---|
| Short-term | 7 days | Customizable based on asset |
| Intermediate | 14 days | Customizable based on asset |
| Long-term | 28 days | Customizable based on asset |
| Overbought Level | 70 | 80 |
| Oversold Level | 30 | 20 |
It’s essential to regularly review and adjust the settings of the Ultimate Oscillator as market conditions change. Continuous refinement will help maintain the relevance and accuracy of the signals it provides.
2.1. Choosing the Right Timeframes
In the dynamic world of trading, the Ultimate Oscillator stands out as a versatile tool for gauging market momentum through its multi-timeframe analysis. To leverage its full potential, traders must fine-tune the oscillator’s settings to align with their trading strategy and the characteristics of the market.
Day traders, seeking to capitalize on quick market movements, might find the standard settings too sluggish. By adjusting the periods to 5, 10, and 15, they can enhance the oscillator’s sensitivity to immediate price changes, thereby obtaining timely signals that are crucial for this high-frequency trading style.
On the other hand, swing traders typically operate on a broader time horizon, aiming to catch larger market swings. For them, a configuration of 10, 20, and 40 periods could be more appropriate. This adjustment helps to smooth out the short-term volatility, providing a clearer view of the underlying trend momentum.
The process of calibrating the Ultimate Oscillator should include backtesting, a method of applying the oscillator to past market data to assess its effectiveness. This step is essential for identifying the most productive settings for the trader’s specific objectives.
| Trading Style | Short Period | Intermediate Period | Long Period |
|---|---|---|---|
| Day Trading | 5 | 10 | 15 |
| Swing Trading | 10 | 20 | 40 |
 Backtesting outcomes guide traders in refining the periods, ensuring that the oscillator’s signals are attuned to the market’s rhythms. It’s not just about finding a one-size-fits-all setting but about discovering the unique combination that resonates with the market’s pulse.
The Ultimate Oscillator’s design to reduce false signals is particularly beneficial in volatile markets. By integrating signals from multiple timeframes, it offers a more comprehensive view, reducing the likelihood of being misled by random price fluctuations.
Ultimately, the effective use of the Ultimate Oscillator hinges on a trader’s ability to adapt to changing market conditions. Regularly reviewing and adjusting the time periods can help maintain the relevance and accuracy of the signals it provides. This continuous process of refinement is what allows traders to stay in tune with the market’s ebb and flow, making informed decisions that are grounded in a thorough analysis of momentum trends.
2.2. Adjusting the Overbought and Oversold Levels
Adjusting the overbought and oversold levels on the Ultimate Oscillator can provide a more tailored approach to generating trade signals. The default settings may not always align with the unique characteristics of different trading instruments or the market’s current volatility climate.
In highly volatile markets, the likelihood of rapid price swings is higher, which can lead to false signals with the standard thresholds. By adapting the overbought and oversold levels, traders can mitigate these false signals:
- Overbought threshold: Lower to 65
- Oversold threshold: Increase to 35
This adjustment helps in filtering out the noise and focusing on more robust signals.
For less volatile markets, where price movements are more subdued, the thresholds can be adjusted to capture the longer trends without reacting to minor price fluctuations:
- Overbought threshold: Raise to 75
- Oversold threshold: Lower to 25
This allows traders to take advantage of the full range of movement before a signal is generated.
Backtesting is an essential step in this process. By analyzing how different settings would have performed in the past, traders can gauge the potential effectiveness of their adjustments. It is crucial to continuously refine these settings, as market conditions can change, rendering previous optimal levels less effective.
Key Considerations for Adjustment:
- Market Volatility: Higher volatility may necessitate tighter levels to avoid false signals.
- Risk Tolerance: More conservative traders might prefer wider bands to ensure stronger signals.
- Instrument Characteristics: Some instruments may inherently have different volatility profiles requiring unique settings.
- Backtesting Results: Historical performance can guide the adjustment of levels for future trades.
- Market Conditions: Adapting to current market conditions can enhance the relevance of the signals.
By customizing the overbought and oversold levels of the Ultimate Oscillator, traders can improve the quality of their trade signals, potentially leading to better trading outcomes. However, it’s crucial to approach this customization with a strategic mindset, considering the various factors that influence the effectiveness of these technical indicators.
3. How to Calculate the Ultimate Oscillator?
When applying the Ultimate Oscillator in trading strategies, it’s essential to understand not just the calculation but also the nuances of how it can signal potential trading opportunities. Divergence plays a key role here; if the price of an asset makes a new high or low that is not reflected in the oscillator, this can indicate a weakening trend and a potential reversal.
Here’s a step-by-step breakdown of the calculation process:
- Determine the True Low (TL):
- TL = Lower of Today’s Low or Yesterday’s Close
- Calculate Buying Pressure (BP):
- BP = Today’s Close – TL
- Establish the True Range (TR):
- TR = Higher of Today’s High – Today’s Low, Today’s High – Yesterday’s Close, or Yesterday’s Close – Today’s Low
- Compute the Average Ratios for each period:
- Average7 = (Sum of BP for 7 periods) / (Sum of TR for 7 periods)
- Average14 = (Sum of BP for 14 periods) / (Sum of TR for 14 periods)
- Average28 = (Sum of BP for 28 periods) / (Sum of TR for 28 periods)
- Apply the Weightings:
- Weighted Average = (4 x Average7 + 2 x Average14 + Average28)
- Normalize the Oscillator:
- UO = 100 x (Weighted Average / 7)
Interpreting the Ultimate Oscillator involves looking for specific patterns and signals:
- Overbought and Oversold Conditions: As mentioned, readings above 70 and below 30 can indicate overbought and oversold conditions, respectively.
- Divergence: When the price makes a new high or low that is not confirmed by the oscillator, it suggests a possible price reversal.
- Threshold Breaks: A move above the upper threshold can signal the start of a bullish phase, while a break below the lower threshold can indicate the beginning of a bearish phase.
Practical considerations for traders include:
- Adjusting Thresholds: Depending on the asset’s volatility, traders may need to adjust the overbought and oversold thresholds to better suit the market’s characteristics.
- Confirmation: Using the Ultimate Oscillator in conjunction with other technical analysis tools can provide stronger confirmation of trading signals.
- Time Frame Sensitivity: The oscillator can be applied to different time frames, but traders should be aware that its sensitivity and signals can vary accordingly.
By integrating the Ultimate Oscillator into a comprehensive trading strategy, traders can better gauge the momentum and potential turning points in the market. It’s a tool that adds depth to technical analysis and can help in making more informed trading decisions.
3.1. Understanding Buying Pressure
When assessing market conditions, traders often look for patterns in buying pressure to inform their strategies. For instance, increasing buying pressure over consecutive periods may suggest a strong bullish sentiment, potentially leading to a breakout. Conversely, decreasing buying pressure might hint at a weakening trend or impending price correction.
Key indicators of buying pressure include:
- Higher Highs: When the price consistently closes at higher levels than previous sessions.
- Rising Volume: An uptick in trading volume can accompany increased buying pressure, reinforcing the trend.
- Price Patterns: Bullish patterns such as the ‘cup and handle’ or ‘ascending triangle’ can indicate building buying pressure.
Traders often complement the Ultimate Oscillator with other tools to confirm buying pressure signals:
| Technical Indicator | Purpose |
|---|---|
| Moving Averages | To identify the direction of the trend |
| Volume Oscillator | To measure changes in volume, which can confirm buying pressure |
| RSI (Relative Strength Index) | To gauge the strength of the buying pressure |
| MACD (Moving Average Convergence Divergence) | To confirm the momentum behind the buying pressure |
Effective utilization of the Ultimate Oscillator involves looking for divergence between the oscillator and price action. If the oscillator is making higher highs while the price is not, it may indicate underlying strength that could lead to an upward price movement.
Traders should always be aware of the market context when interpreting buying pressure. News events, economic data releases, and market sentiment can all influence buying pressure and, by extension, the reliability of signals from the Ultimate Oscillator. It’s recommended to use a combination of technical analysis, fundamental analysis, and risk management techniques to make informed trading decisions.
3.2. Summing the Average Gains and Losses
When using the Ultimate Oscillator, the process of summing average gains and losses plays a pivotal role in generating reliable signals. Gains occur when the current period’s closing price is higher than the previous period’s, and losses are recorded when the current period’s closing price is lower.
Traders sum gains and losses over predetermined periods, typically using the timeframes of 7, 14, and 28 periods. These represent short-term, intermediate-term, and long-term market trends, respectively. The methodology for calculating the averages is straightforward: sum the gains or losses for each timeframe and then divide by the number of periods.
Here’s how the calculation is broken down for each timeframe:
| Timeframe (Periods) | Calculation of Average Gain or Loss |
|---|---|
| 7 | (Sum of Gains or Losses) / 7 |
| 14 | (Sum of Gains or Losses) / 14 |
| 28 | (Sum of Gains or Losses) / 28 |
These averages are then weighted and integrated into the Ultimate Oscillator formula, yielding a value that fluctuates between 0 and 100. It is essential for traders to update these averages with each new period to maintain the oscillator’s accuracy. By diligently summing the average gains and losses, the Ultimate Oscillator remains a trusted tool for identifying potential buy or sell points in the trading landscape.
3.3. Applying the Formula
When utilizing the Ultimate Oscillator in trading strategies, it’s important to recognize divergences between the oscillator and price action. A bullish divergence occurs when the price makes a lower low, but the oscillator makes a higher low, suggesting a potential upward price reversal. Conversely, a bearish divergence is when the price hits a higher high while the oscillator forms a lower high, indicating possible downward price movement.
Overbought and oversold conditions are critical signals provided by the Ultimate Oscillator. Traders often look for:
- Overbought conditions (UO > 70): This could signify that the asset may be overvalued, and a price correction might be imminent.
- Oversold conditions (UO < 30): This might indicate that the asset is undervalued, and a price increase could be on the horizon.
Confirmation with price action is a prudent approach. Traders should watch for the price to break through a trendline or resistance/support level after the oscillator signals a potential reversal.
Timeframe alignment is also an essential aspect. Aligning the oscillator’s signals with the broader market trend can increase the reliability of the trading signals.
| Signal Type | Oscillator Condition | Price Action | Potential Trading Action |
|---|---|---|---|
| Bullish Divergence | Higher Low in UO | Lower Low in Price | Consider Long Position |
| Bearish Divergence | Lower High in UO | Higher High in Price | Consider Short Position |
| Overbought | UO > 70 | – | Monitor for Sell Signals |
| Oversold | UO < 30 | – | Monitor for Buy Signals |
Risk management should always accompany the use of the Ultimate Oscillator. Setting stop-loss orders and taking profits at predetermined levels can help manage potential losses and lock in gains.
Combining the Ultimate Oscillator with other indicators can provide additional layers of confirmation. For instance, using moving averages, volume, or even patterns on the price chart can enhance the effectiveness of the signals generated by the Ultimate Oscillator.
Incorporating the Ultimate Oscillator into a trading system requires practice and attention to market nuances. As with any technical indicator, it’s not foolproof and should be used in conjunction with a well-rounded trading plan.
4. What are the Best Strategies for Using the Ultimate Oscillator?
Setting the right thresholds is critical when working with the Ultimate Oscillator. While common levels are set at 70 for overbought and 30 for oversold, adjusting these thresholds to better fit the asset’s volatility can improve signal accuracy. A more volatile asset might require a higher threshold to avoid false signals, whereas a less volatile one might need a lower threshold to be sensitive enough to detect meaningful movements.
Timing entries and exits is another aspect where the Ultimate Oscillator can be of great assistance. Traders should look for periods when the oscillator moves out of the overbought or oversold territory, which can indicate a momentum shift. Entering a trade as the oscillator crosses back through the 70 or 30 level can be a strategy to catch the beginning of a potential trend.
Ultimate Oscillator Parameters:
| Parameter | Description |
|---|---|
| Short-term Period | Typically 7 periods |
| Intermediate Period | Commonly 14 periods |
| Long-term Period | Often set to 28 periods |
| Overbought Threshold | Usually 70 (adjustable) |
| Oversold Threshold | Typically 30 (adjustable) |
Risk management is essential when utilizing the Ultimate Oscillator. Traders should always set stop-loss orders to protect against market reversals that can occur even after a signal has been given. By managing risk and preserving capital, traders can ensure they remain in the game even when a trade doesn’t go as planned.
Incorporating the Ultimate Oscillator into a comprehensive trading plan that accounts for individual risk tolerance and trading style is paramount. Traders should backtest their strategies using historical data to understand how the oscillator performs under various market conditions. This practice can help refine the use of the Ultimate Oscillator and tailor it to the trader’s specific needs.
Leveraging the Ultimate Oscillator for trend confirmation can provide an additional layer of validation for traders. When the market is trending, the oscillator should generally trend in the same direction. If the oscillator begins to diverge from the price trend, it may signal that the trend is weakening and a reversal could be imminent.
4.1. Identifying Divergence Signals
When incorporating divergence signals into a trading strategy, it’s crucial to monitor the market context. Divergence alone may not be a sufficient indicator of a trend reversal, as it can sometimes lead to false signals. Traders should consider the following aspects to enhance the reliability of divergence:
- Volume: Higher trading volume on the trend reversal confirmation candle can strengthen the divergence signal.
- Support and Resistance Levels: A divergence that coincides with a key support or resistance level can provide additional validation.
- Trend Duration: Divergences that occur after prolonged trends may be more significant than those appearing after short-lived trends.
Traders may also employ other technical indicators such as moving averages, Bollinger Bands, or the Relative Strength Index (RSI) to corroborate the signals suggested by divergence with the Ultimate Oscillator.
| Divergence Type | Price Action | Ultimate Oscillator Action | Confirmation Signal |
|---|---|---|---|
| Bullish | New Low | Higher Low | Oscillator Rises Above Recent Peak |
| Bearish | New High | Lower High | Oscillator Falls Below Recent Trough |
Risk management is an indispensable component when trading on divergence signals. Setting stop-loss orders at strategic levels can help mitigate potential losses if the market does not move as anticipated. Additionally, traders should size their positions appropriately and avoid overexposure to a single trade.
By integrating divergence signals with other technical analysis tools and sound risk management practices, traders can enhance their decision-making process and strive for a balanced trading approach.
4.2. Trading the Breakout
When incorporating the Ultimate Oscillator into a breakout strategy, traders should closely monitor the oscillator’s behavior in relation to price movements. The Ultimate Oscillator combines short-term, intermediate, and long-term moving averages to provide a comprehensive momentum signal.
| Price Action | Ultimate Oscillator | Interpretation |
|---|---|---|
| Price breaks above resistance | Oscillator breaks above its high | Bullish confirmation |
| Price breaks below support | Oscillator breaks below its low | Bearish confirmation |
| Price approaches resistance | Oscillator nears high without breakout | Potential bullish momentum |
| Price approaches support | Oscillator nears low without breakout | Potential bearish momentum |
Divergence plays a key role in assessing the validity of a breakout. When the price breaks out but the Ultimate Oscillator does not confirm the move, it can be a sign of a weak breakout or a false signal. A divergence where the price makes a new high or low, but the oscillator does not, is a red flag for traders.
Entry points should be chosen with care, ideally after the Ultimate Oscillator confirms the breakout. Traders may look for the oscillator to move beyond its recent extremes as a sign of robust momentum.
| Entry Condition | Action |
|---|---|
| Confirmed breakout with oscillator agreement | Consider entering trade |
| Breakout without oscillator confirmation | Exercise caution or avoid trade |
| Oscillator divergence | Reevaluate trade validity |
Risk management is crucial, and a well-placed stop-loss can help mitigate potential losses. Traders might set a stop-loss just below the breakout level for long positions or just above for short positions.
The timeframe for the Ultimate Oscillator should align with the trader’s strategy. Shorter timeframes may be more sensitive to price changes, while longer timeframes can filter out noise.
| Timeframe | Sensitivity | Suitability |
|---|---|---|
| Short-term | High | Aggressive trading |
| Long-term | Low | Conservative trading |
Incorporating the Ultimate Oscillator into breakout trading can provide traders with a powerful tool for identifying and confirming potential trends. By paying attention to the oscillator’s confirmation and divergence, and by coupling it with volume analysis, traders can execute more informed and strategic trades.
4.3. Combining with Other Technical Indicators
Ultimate Oscillator + Moving Averages
| Market Condition | Moving Average | Ultimate Oscillator Signal | Potential Action |
|---|---|---|---|
| Uptrend | Price above MA | Overbought | Monitor for potential sell |
| Downtrend | Price below MA | Oversold | Monitor for potential buy |
| Ranging | Price oscillating around MA | Divergence | Consider buy/sell based on divergence |
Ultimate Oscillator + RSI
| Ultimate Oscillator | RSI | Market Condition | Potential Action |
|---|---|---|---|
| Overbought | Overbought | Bearish Reversal Likely | Consider selling |
| Oversold | Oversold | Bullish Reversal Likely | Consider buying |
| Divergence | Divergence | Possible Trend Reversal | Confirm with other indicators |
Ultimate Oscillator + Bollinger Bands
| Ultimate Oscillator Signal | Bollinger Band Interaction | Volatility | Potential Action |
|---|---|---|---|
| Exit Overbought | Price touches upper band | High | Possible sell on reversal |
| Exit Oversold | Price touches lower band | High | Possible buy on reversal |
| Neutral | Price within bands | Normal | Await further signals |
Ultimate Oscillator + Stochastic Oscillator
| Ultimate Oscillator | Stochastic Oscillator | Market Momentum | Potential Action |
|---|---|---|---|
| Bullish Momentum | Bullish Crossover | Increasing | Consider buying |
| Bearish Momentum | Bearish Crossover | Decreasing | Consider selling |
| Divergence | Divergence | Uncertain | Use additional analysis |
Ultimate Oscillator + MACD
| Ultimate Oscillator | MACD | Trend Confirmation | Potential Action |
|---|---|---|---|
| Bullish Crossover | MACD above Signal Line | Confirmed Uptrend | Consider buying |
| Bearish Crossover | MACD below Signal Line | Confirmed Downtrend | Consider selling |
| Divergence | Divergence | Trend Weakness | Reevaluate position |
Key Considerations:
- Confluence between indicators strengthens trade signals.
- Divergence can be an early warning of a potential trend reversal.
- Volatility assessment is crucial for determining entry and exit points.
- Risk management is imperative, including the use of stop-loss orders.
- Oscillators should not be used in isolation; market context is essential.
- Regular backtesting of strategies helps in refining their effectiveness.