
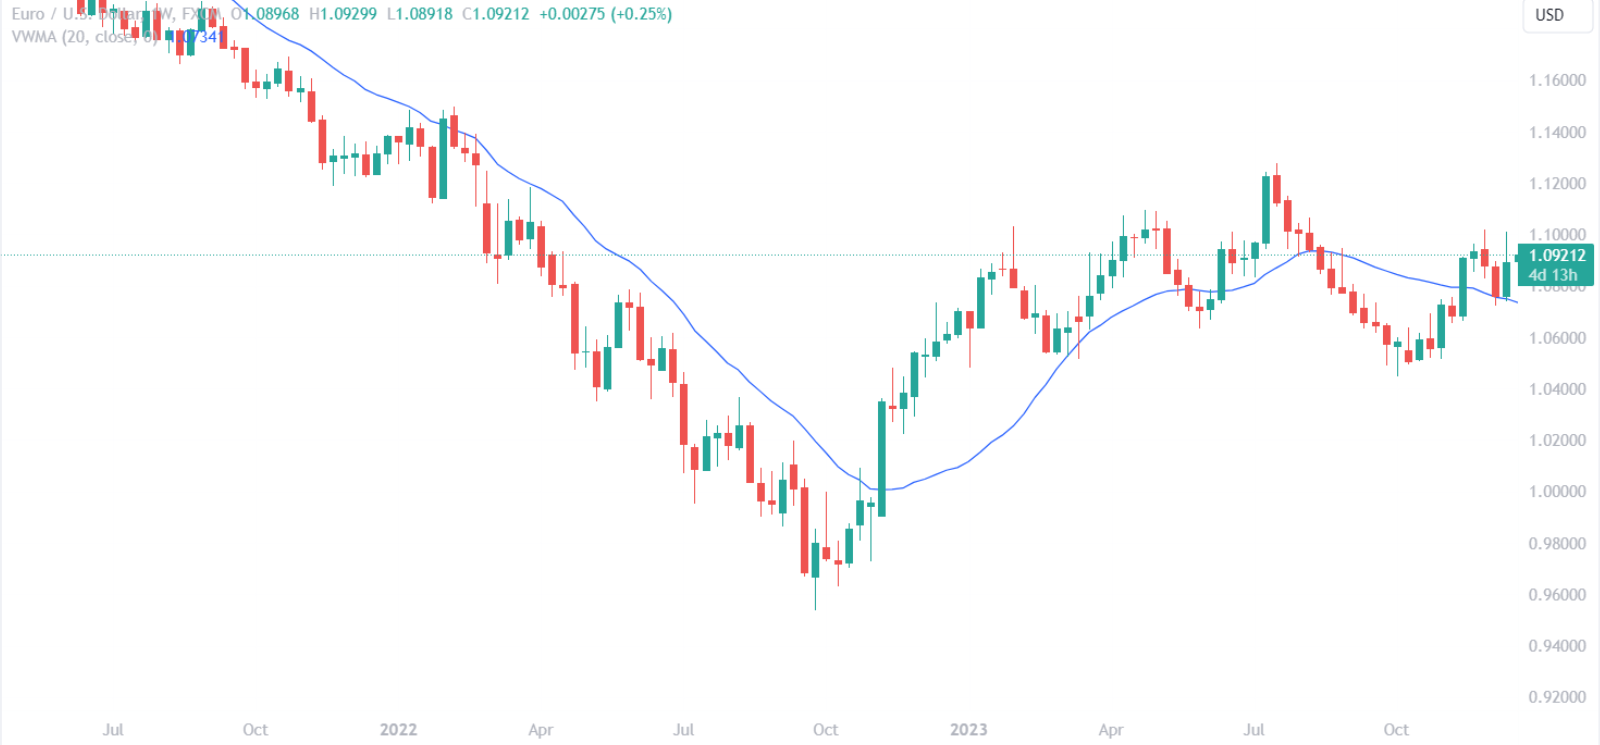
1. Understanding Volume Weighted Moving Average (VWMA)
When analyzing the VWMA, traders often look for crossovers with other moving averages, such as the SMA. A crossover occurs when two moving averages intersect, and it can signal potential shifts in market dynamics. For instance:
- VWMA crossing above an SMA can indicate that a recent price increase is supported by high volume, suggesting a strong upward trend.
- VWMA crossing below an SMA might suggest that a recent price decline is volume-backed, potentially signaling a strong downward trend.
These crossovers can be pivotal for traders making decisions about entry and exit points. It’s important to note, however, that the VWMA is just one tool among many, and its signals are most effective when combined with other forms of technical analysis.
Traders may also observe the distance between the VWMA and the price. A larger gap can sometimes indicate a trend that is gaining momentum, as the average price, weighted by volume, is moving in the same direction as the current price but at a slower rate due to the historical data included in the calculation.
Key insights that can be drawn from the VWMA include:
- Confirmation of Trend Strength: A VWMA that is moving in the same direction as the price trend and widening the gap may confirm the strength of the trend.
- Potential Reversal Points: If the VWMA starts to flatten out or diverge from the price trend, it could be an early sign of a potential trend reversal.
- Support and Resistance Levels: Sometimes, the VWMA can act as a dynamic support or resistance level. A price bouncing off the VWMA may find support in an uptrend, whereas a price that fails to break above the VWMA in a downtrend may encounter resistance.
To effectively use the VWMA, traders should consider the following best practices:
- Combine with Other Indicators: Use VWMA in conjunction with other technical indicators to validate signals and reduce the risk of false signals.
- Adjust the Period: Depending on the trading style, adjust the VWMA period to better suit short-term or long-term analysis.
- Monitor Volume: Pay close attention to volume bars to confirm the signals provided by the VWMA.
- Consider Market Context: Always take into account the broader market context, as external factors can influence volume and price movements.
By integrating the VWMA into their trading strategy, traders can enhance their analysis of market trends and make more informed decisions based on the interplay of price and volume.
2. Applying VWMA in Trading Strategies
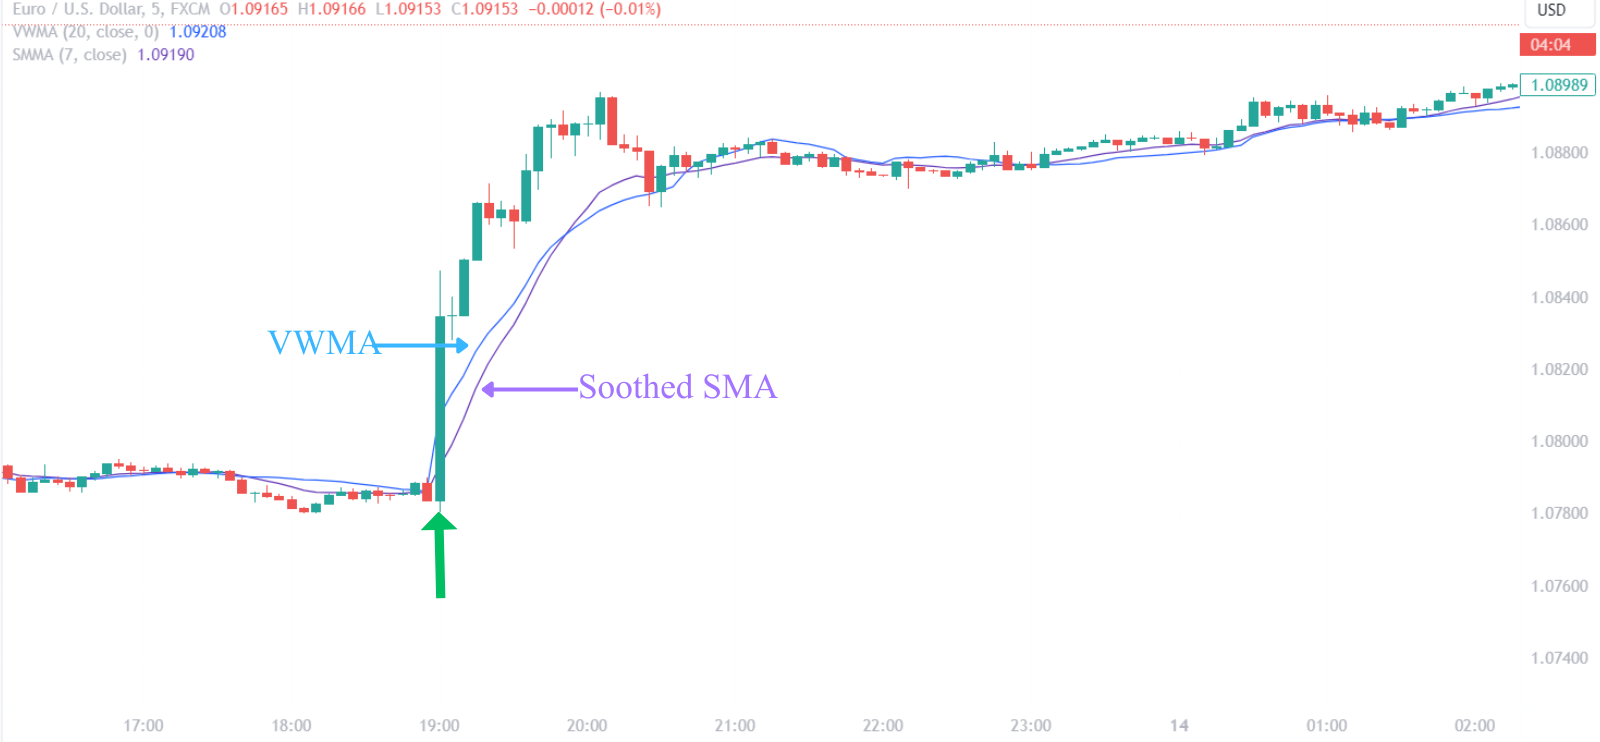
When utilizing the VWMA, traders often compare its movements to a Simple Moving Average (SMA). The key difference between VWMA and SMA is the volume factor; the VWMA emphasizes periods with higher volume.
This distinction becomes particularly significant during volume spikes associated with market events or news releases. A VWMA that deviates significantly from the SMA signals that volume is playing a notable role in price movements, and traders should pay attention.
Crossover strategies are popular among traders incorporating the VWMA. A bullish signal is generated when the VWMA crosses above an SMA, indicating increased buying pressure. Conversely, a bearish signal is seen when the VWMA crosses below an SMA, suggesting increased selling pressure. These crossovers can be used to trigger trades or to confirm signals from other indicators.
Volume analysis is another aspect where VWMA proves beneficial. For instance, during a consolidation period, a rise in volume indicated by the VWMA could foreshadow a breakout. Traders can position themselves accordingly, anticipating the direction of the breakout based on the prevailing trend and volume signals.
To effectively implement the VWMA in trading strategies, consider the following steps:
- Identify the trend using the VWMA – look for a consistent direction above or below the indicator.
- Monitor for crossovers with an SMA to find potential trade signals.
- Observe volume patterns and the VWMA’s reaction to spikes or unusual activity.
- Use VWMA as a dynamic support or resistance to validate trade entries during retracements in a trend.
- Assess trend strength by comparing the gap between the VWMA and SMA.
| VWMA Strategy | Description |
|---|---|
| Trend Identification | Use VWMA to determine the market trend direction. |
| Crossover Signals | Enter trades on VWMA/SMA crossovers. |
| Volume Analysis | Watch for volume spikes and VWMA response for breakout/breakdown signals. |
| Support/Resistance | Trade bounces off VWMA in trending markets. |
| Trend Strength | Compare VWMA and SMA gap to gauge trend momentum. |
It’s imperative for traders to remember that no indicator is foolproof. The VWMA should be used in conjunction with other technical analysis tools and fundamental analysis to validate trading signals. Additionally, risk management techniques must be employed to protect against market volatility and unexpected events.
By integrating the VWMA into their trading arsenal, traders can gain a more nuanced understanding of market dynamics. This indicator is not just about following price, but also about understanding the underlying volume that drives market movements, providing a strategic edge in the competitive trading environment.
2.1. Identifying Trends with VWMA
Incorporating the VWMA into a trading strategy requires a keen understanding of its behavior in different market conditions. Here are some practical applications:
- Crossovers: When the VWMA crosses over a simple moving average (SMA) or an exponential moving average (EMA), it can signal a change in trend. A VWMA moving above a SMA or EMA may indicate the beginning of a bullish trend, while a crossover below may suggest a bearish shift.
- Support and Resistance: The VWMA can act as a dynamic level of support or resistance. During uptrends, the VWMA often provides support, with prices bouncing off the VWMA line. In downtrends, it can serve as resistance, with prices struggling to break above the VWMA.
- Breakouts: A breakout above or below the VWMA can be an early indication of a trend acceleration. Traders might look for high volume breakouts for confirmation, as they can be more reliable signals of trend continuation.
VWMA vs. Traditional Moving Averages Comparison:
| Aspect | VWMA | Traditional Moving Averages (SMA/EMA) |
|---|---|---|
| Volume Sensitivity | High (volume-weighted) | None (price only) |
| Trend Confirmation | Strong (with volume confirmation) | Moderate (price action only) |
| Signal Generation | Later (due to volume weighting) | Earlier (price changes only) |
| Support/Resistance Levels | Dynamic (volume changes affect levels) | Static (fixed to price history) |
By integrating these approaches, traders can enhance their analysis and potentially improve their trading outcomes. The VWMA’s emphasis on volume allows for a nuanced interpretation of market dynamics, emphasizing the importance of trading activity in confirming or refuting price movements.
Incorporating the VWMA into chart analysis involves looking for these key signals and understanding their implications in the context of overall market conditions. Volume analysis, paired with VWMA, can be particularly revealing, as high volume periods that coincide with VWMA trend signals reinforce the perceived strength of those trends.
Practical Tips for Using VWMA:
- Always consider the context of the overall market; VWMA signals are most reliable when they align with the broader market sentiment.
- Use VWMA in conjunction with other indicators to validate signals; no single indicator should be used in isolation.
- Pay attention to volume spikes; these can significantly impact the VWMA and potentially signal important market events.
- Adjust the VWMA period to fit your trading style; shorter periods for day trading, longer for swing trading or investing.
By employing the VWMA thoughtfully, traders can refine their understanding of market trends and make more informed decisions. It’s a tool that blends the simplicity of moving averages with the depth of volume analysis, offering a powerful addition to the trader’s toolkit.
2.2. VWMA Crossovers as Trade Signals
In the realm of technical analysis, VWMA crossovers serve as a cornerstone for many trading strategies. The Volume Weighted Moving Average (VWMA) adds a new dimension to the traditional moving averages by incorporating volume, which can be a game-changer in assessing market trends. Here’s a closer look at how VWMA crossovers can be integrated into a trader’s arsenal:
VWMA vs. SMA/EMA:
- VWMA: Prioritizes price points with higher volume, potentially indicating where the ‘smart money’ is moving.
- SMA: Offers a simple, unweighted average of prices over a specified period.
- EMA: Gives more weight to recent prices, reacting more quickly to price changes than SMA.
| Signal Type | VWMA Position | Market Implication |
|---|---|---|
| Bullish | VWMA > SMA/EMA | Possible uptrend initiation |
| Bearish | VWMA < SMA/EMA | Possible downtrend initiation |
 Trade Entry and Exit Rules:
- Long Entry: Initiate when VWMA crosses above SMA/EMA.
- Short Entry: Consider when VWMA crosses below SMA/EMA.
- Exit Strategy: Close or reverse the position when the VWMA crosses in the opposite direction.
Volume Confirmation:
- A crossover with increasing volume lends credibility to the signal.
- A crossover with low volume may suggest a lack of conviction in the price move.
Combining VWMA with Other Indicators:
- Oscillators: RSI or Stochastics can help confirm overbought or oversold conditions.
- Support/Resistance: Align entries and exits with key levels for added confirmation.
- Candlestick Patterns: Look for patterns like bullish engulfing or bearish harami at the time of crossover for further validation.
Risk Management Considerations:
- Stop-Loss Orders: Place stop-losses to minimize potential losses from false signals.
- Position Sizing: Adjust the size of the trade based on the volatility and overall market conditions.
By integrating VWMA crossovers with a disciplined approach to risk management and a synergistic use of other technical tools, traders can navigate the markets with a heightened sense of precision. It’s not just about recognizing the signal; it’s also about understanding the context in which it occurs and responding with calculated measures.
2.3. Combining VWMA with Other Indicators
When leveraging the Volume Weighted Moving Average (VWMA) in conjunction with other technical tools, traders can create a comprehensive trading strategy. For example, using the VWMA alongside the Relative Strength Index (RSI) enables traders to measure the velocity and magnitude of price movements with volume as a backdrop. This can be particularly useful in identifying divergences where price and volume do not confirm each other, often a precursor to a potential reversal.
Moving Average Convergence Divergence (MACD) is another momentum indicator that, when used with VWMA, can help traders identify trend reversals and momentum shifts. The MACD’s focus on the convergence and divergence of short-term and long-term moving averages, combined with the volume-weighted perspective of VWMA, can offer a more nuanced view of market dynamics.
| Indicator Type | Indicator Examples | Benefits When Combined with VWMA |
|---|---|---|
| Momentum | RSI, MACD | Enhances trend confirmation and identifies potential reversals. |
| Volatility | Bollinger Bands, ATR | Provides context on the volume during periods of market expansion or contraction. |
| Support/Resistance | Horizontal Lines, Trendlines | Offers insight into the strength of price levels with volume validation. |
| Chart Patterns | Triangles, Head and Shoulders | Confirms the validity of pattern breakouts with volume data. |
Volatility indicators such as Bollinger Bands can offer insights into the market’s volatility. When the VWMA is within the bands, it can indicate a stable trend with volume backing. Conversely, a VWMA breakout from the bands can signal an increase in volatility and potentially a new trading opportunity.
Average True Range (ATR) helps traders understand the degree of price volatility. By comparing the ATR with the VWMA, traders can discern whether volume is supporting the current volatility in price action, which can be critical for setting stop-losses and take-profits.
In the context of support and resistance levels, VWMA can act as a dynamic level itself. When the price is above the VWMA, it can serve as support, and when below, as resistance. Traders can use this in conjunction with traditional support and resistance to validate these levels.
Lastly, incorporating VWMA with chart patterns and price action can enhance the credibility of these patterns. For instance, a breakout from a consolidation pattern with high volume as indicated by the VWMA can be a strong entry signal.
By integrating VWMA with these technical indicators, traders can create a layered analysis that not only looks at price but also considers the underlying volume, which can be a powerful predictor of future market movements. This multi-indicator approach can assist traders in making more informed decisions, backed by the convergence of signals from different facets of market behavior.
2.4. VWMA in Different Time Frames
Understanding VWMA on Different Time Frames
| Time Frame | Trader Type | VWMA Sensitivity | Use Case |
|---|---|---|---|
| 5-minute | Day Trader | High | Identifies immediate momentum and volume changes |
| 15-minute | Day Trader | High | Useful for short-term trend analysis and quick trade execution |
| Daily | Swing Trader | Moderate | Offers a view of the market’s general trend direction |
| Weekly | Long-term Investor | Low | Smoothens short-term volatility for better trend assessment |
| Monthly | Long-term Investor | Very Low | Acts as a dynamic support or resistance level |
Tailoring VWMA for Optimal Use
- Short-term traders should opt for a shorter VWMA period to enhance responsiveness to price movements.
- Long-term traders may prefer a longer VWMA period to filter out insignificant fluctuations and highlight sustained trends.
- Experimentation with VWMA settings is encouraged to find the optimal balance between responsiveness and smoothing.
- Consistency in application ensures that the VWMA provides reliable signals that are in tune with a trader’s strategy.
Key Considerations for VWMA Application
- Market conditions can influence VWMA effectiveness; it’s vital to consider the context of the current trading environment.
- Volume data quality is essential for VWMA accuracy; ensure your data source is reliable.
- Complementary indicators can provide additional confirmation; consider pairing VWMA with other technical tools for a robust analysis.
- Risk management should always accompany VWMA signals; use stop-loss orders to protect against adverse market moves.
By integrating these considerations into your trading practice, the VWMA becomes a powerful tool, adaptable to various market conditions and time frames, ultimately enhancing your trading performance.