
1. Understanding Woodies CCI Indicator
Woodies CCI is not just a single indicator but a suite of several patterns and signals that traders use to make informed decisions. Ken Wood, the creator of Woodies CCI, developed specific patterns within the indicator’s framework that are named after him, such as the Woodie’s trend, hook, and zero-line reject. These patterns are crucial for traders to recognize and interpret as they signal various market scenarios.
Key Patterns of Woodies CCI:
- Zero-Line Reject (ZLR): This occurs when the CCI comes close to or touches the zero-line and then moves in the direction of the prevailing trend.
- Hook From Extreme (HFE): This pattern is identified when the CCI hooks away from the +200 or -200 level, suggesting a possible continuation or reversal.
- Trend Line Break (TLB): A break in the CCI trend line often indicates a change in the trend.
- Reverse Divergence (RD): This is when the price makes a new high or low, but the CCI does not, potentially signaling a reversal.
Traders often combine the Woodies CCI with other technical analysis tools to validate signals or to filter out potential false moves. Common complementary tools include:
- Moving Averages: To confirm the trend direction suggested by Woodies CCI patterns.
- Support and Resistance Levels: To identify potential entry or exit points in conjunction with CCI signals.
- Volume Indicators: To gauge the strength of the CCI signals by looking at the volume of trades.
Practical Application of Woodies CCI:
- Identify the Trend: Use the long-term CCI to determine the general market trend.
- Look for Entry Signals: Short-term CCI patterns like ZLR or HFE can suggest entry points in line with the trend.
- Assess Momentum: The divergence between price and CCI can indicate weakening momentum, potentially signaling a reversal.
- Set Stop Losses: Based on CCI patterns, traders can set stop-loss orders to manage risk effectively.
Woodies CCI Settings:
- Short-term CCI: Typically set to a 6-period lookback.
- Long-term CCI: Often set to a 14-period lookback.
- Threshold Levels: +/-100 are often used as overbought and oversold markers; +/-200 levels indicate more extreme conditions.
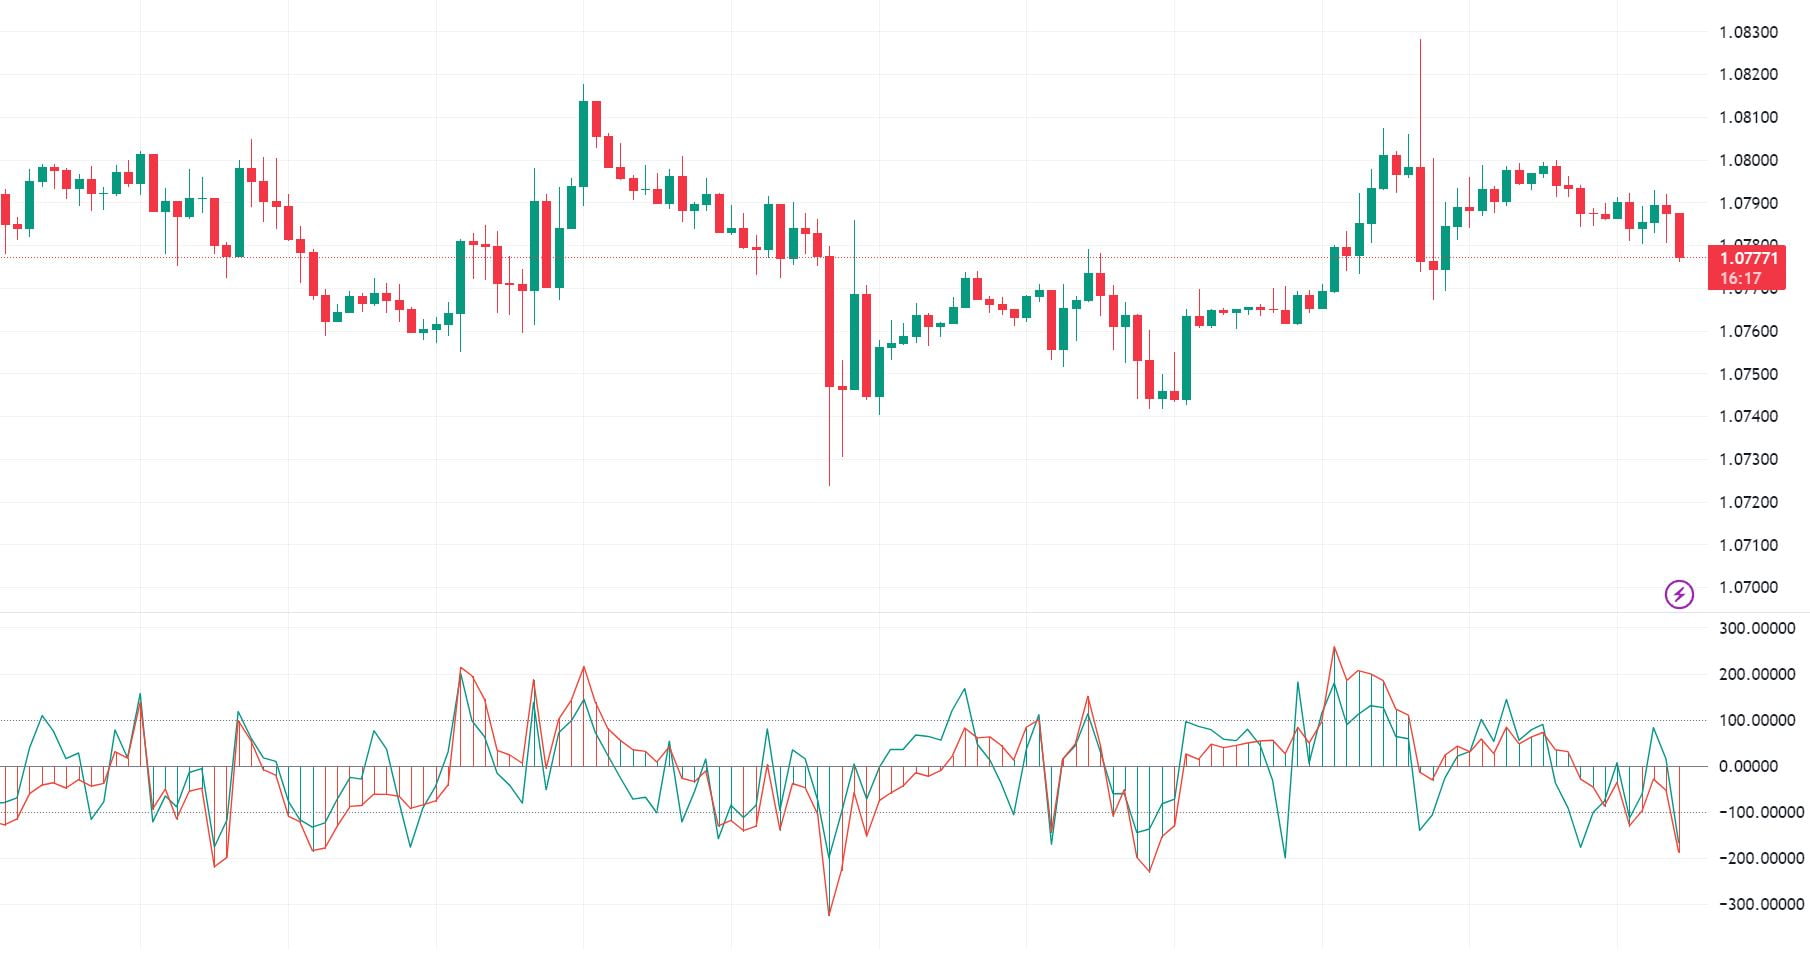
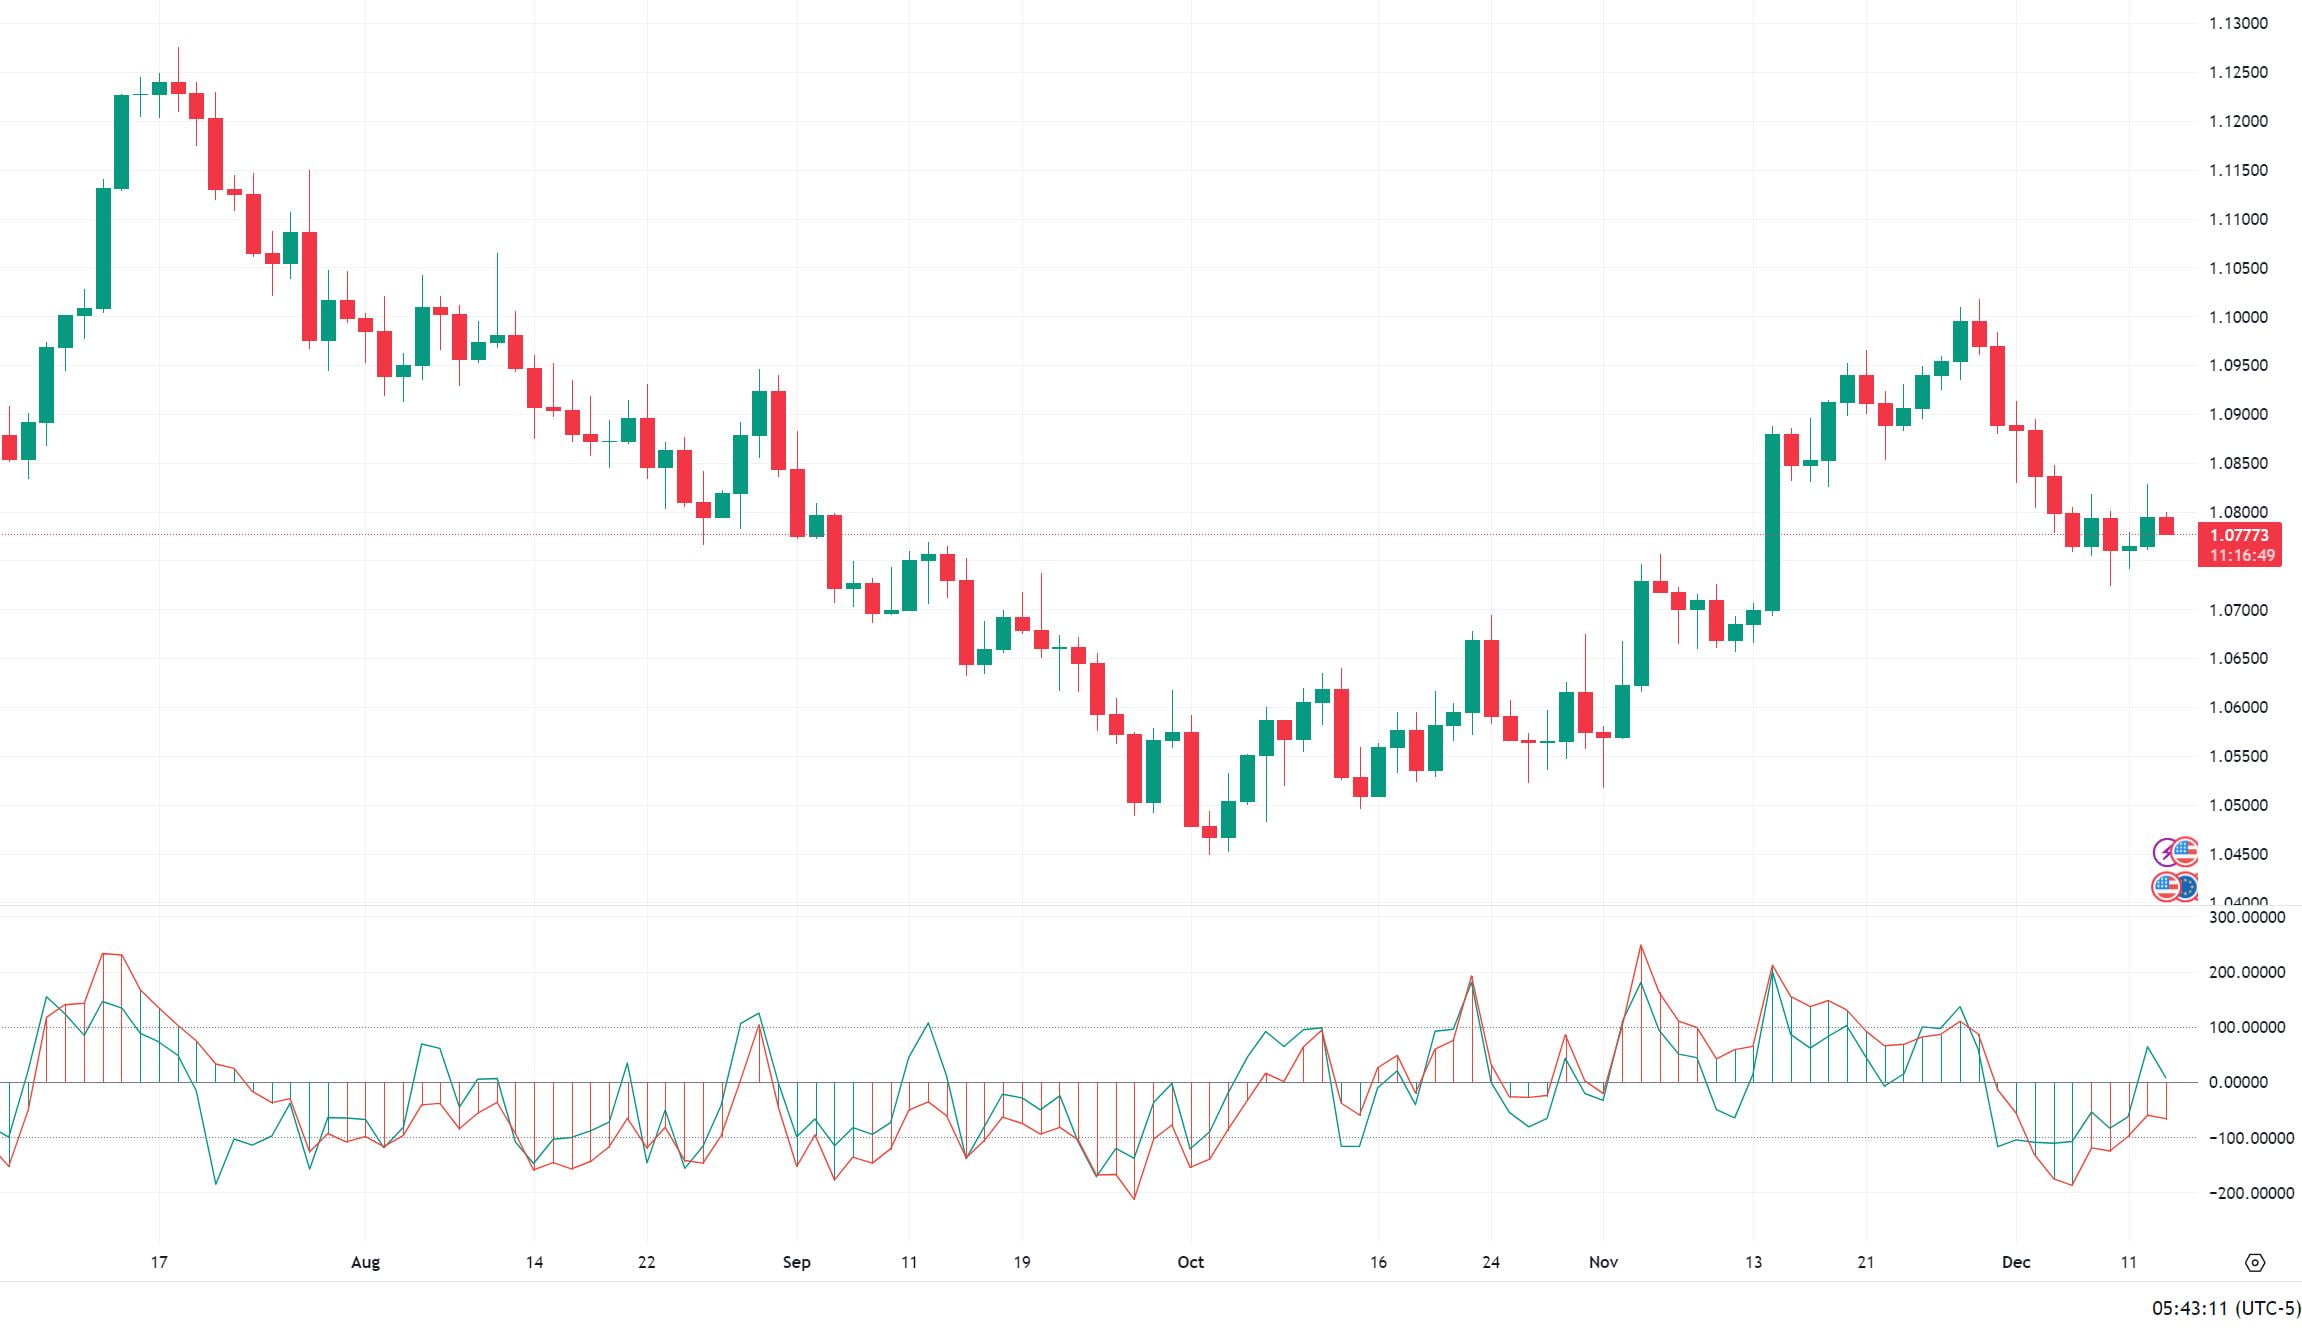
Chart Example:
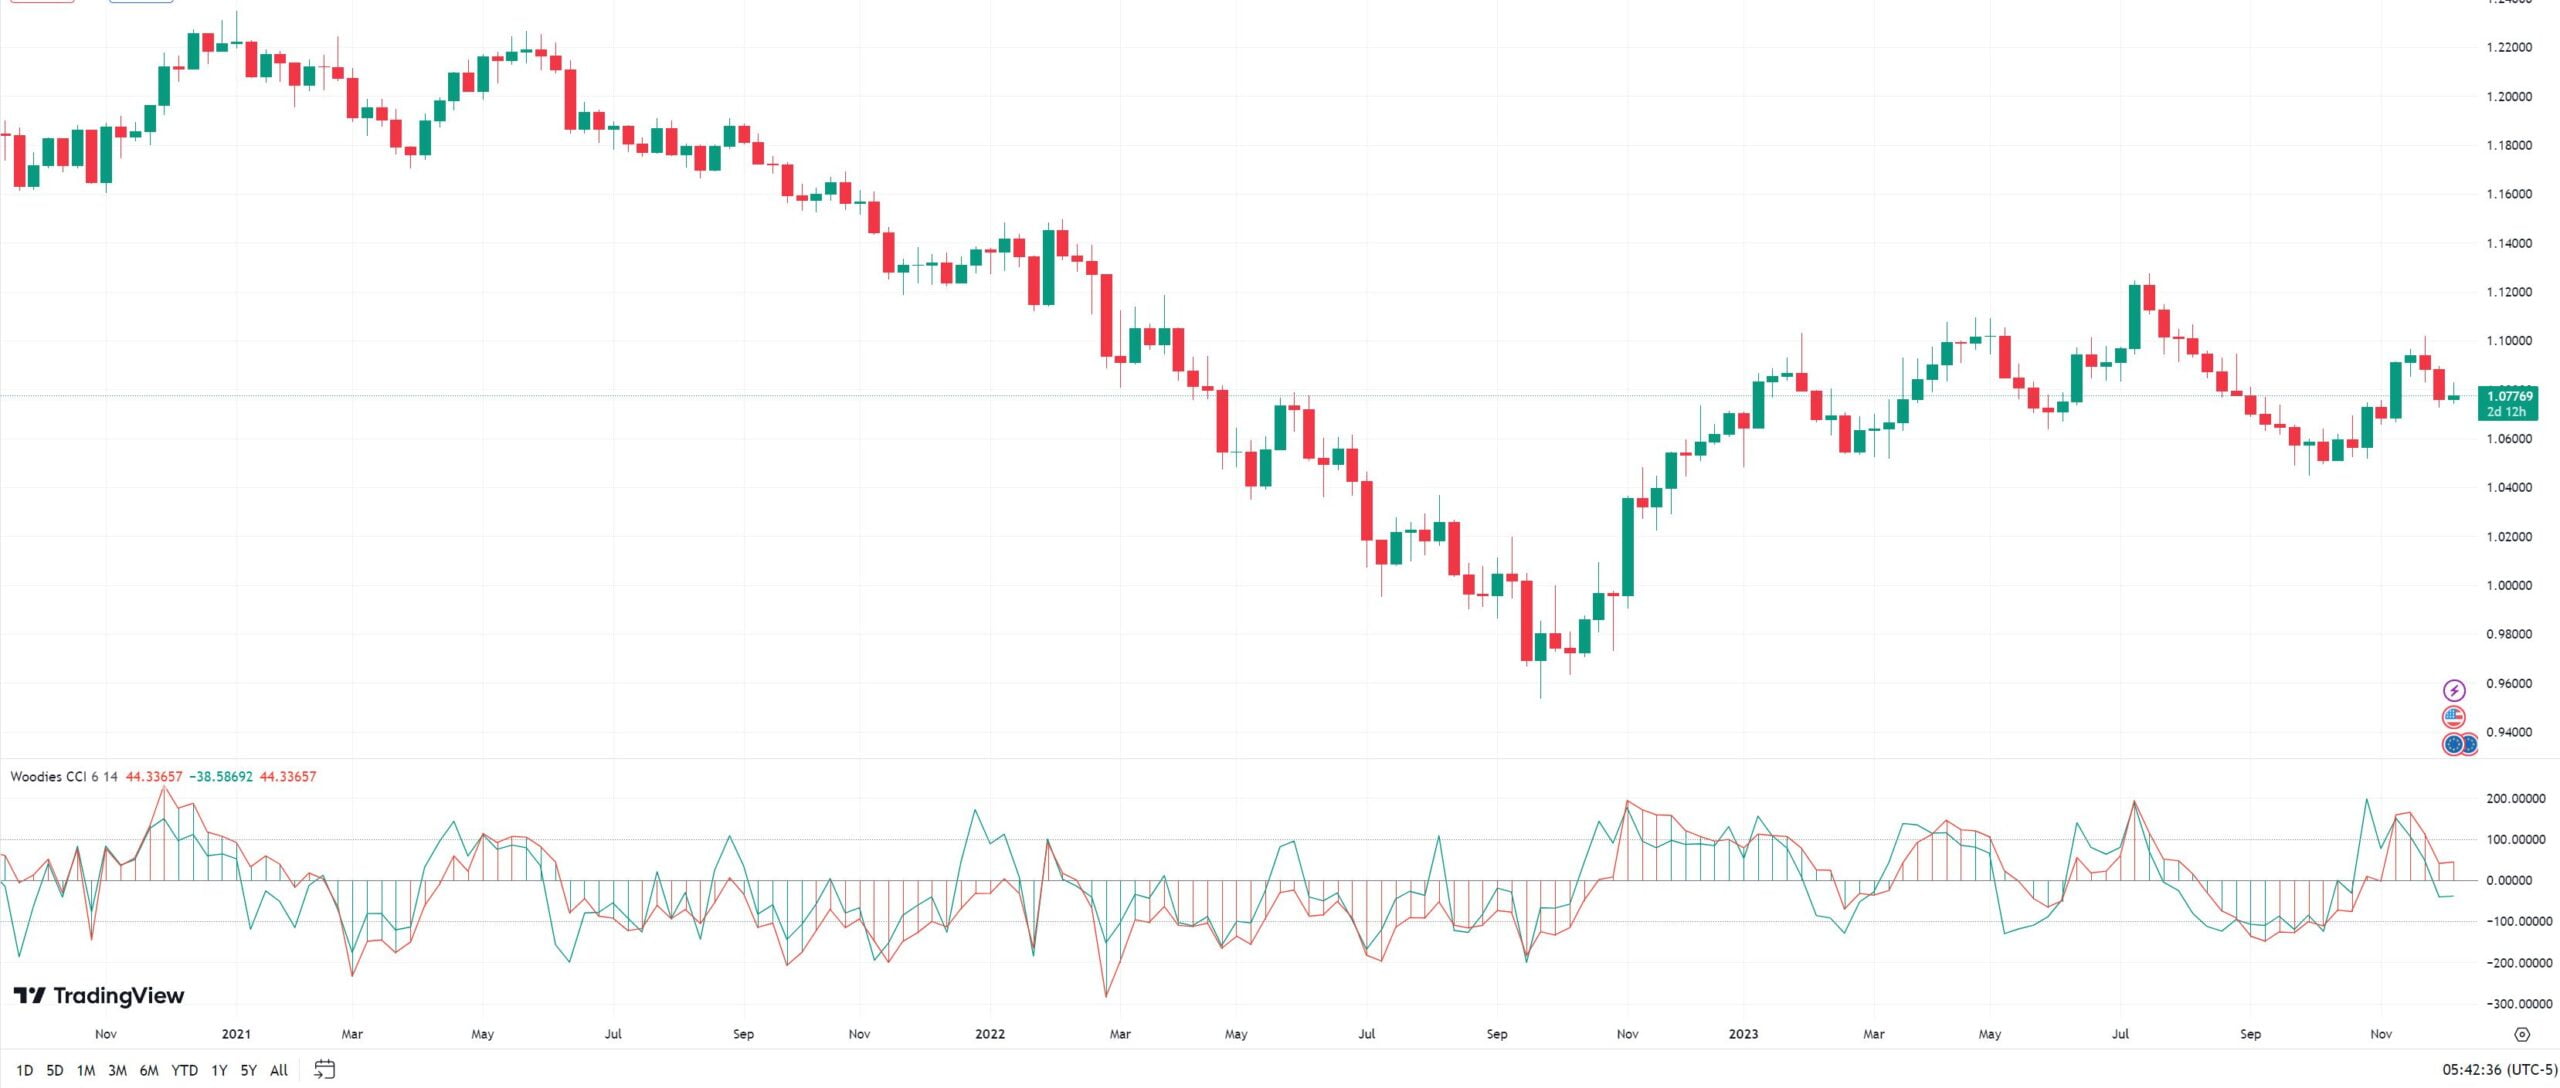
Practial use cases of Woodies CCI
| Price Action | Short-term CCI | Long-term CCI | Signal Type |
|---|---|---|---|
| Approaching zero-line | Near zero | Positive | Potential ZLR (buy) |
| Hook from +200 | Declining | Still positive | Possible HFE (sell) |
| Trend line break | Crossing trend line | Confirming direction | TLB (trend change) |
| New price high, CCI not confirming | Lower high | Divergent | RD (reversal likely) |
Risk Management with Woodies CCI:
- Always Confirm: Use additional indicators or patterns for confirmation before executing trades.
- Manage Trades: Utilize stop losses and take profits based on CCI signals and market structure.
- Be Aware of Market Conditions: Woodies CCI can be more effective in trending markets than in ranging or choppy conditions.
By integrating Woodies CCI into their trading strategy, traders can potentially enhance their market analysis, improve entry and exit timing, and better manage risk. However, as with any trading tool, it is vital to practice and become familiar with its nuances before applying it to live trading scenarios.
1.1. Definition and Core Concepts of Woodies CCI
Woodies CCI Patterns and Trading Signals
Woodies CCI trading system is known for its unique patterns that provide specific trading signals. Here are some of the key patterns and their interpretations:
- Zero-Line Reject (ZLR): This pattern occurs when the CCI bounces off or near the zero-line and then moves in the direction of the prevailing trend. A ZLR is considered a continuation signal, suggesting that the trend is resuming.
- Trend Line Break (TLB): A TLB signal is given when the CCI line breaks through a trend line, indicating a potential trend reversal or a significant move away from the current trend.
- Reverse Divergence (RD): This is a situation where the CCI makes a new high or low that is not matched by the price chart, suggesting a possible reversal of the current trend.
- Sideways Pattern (SP): A sideways pattern is identified when the CCI fluctuates around the zero-line without a clear trend. This indicates a consolidation phase in the market.
- Hook From Extreme (HFE): The HFE pattern is recognized when the CCI hooks away from the +200 or -200 line, suggesting a potential reversal from an overbought or oversold condition.
| Pattern | Description | Expected Outcome |
|---|---|---|
| ZLR | CCI bounces off the zero-line | Continuation of Trend |
| TLB | CCI breaks through a trend line | Trend Reversal |
| RD | Price and CCI diverge | Trend Reversal |
| SP | CCI fluctuates around zero-line | Market Consolidation |
| HFE | CCI hooks from extreme levels | Reversal from Overbought/Oversold |
Entry and Exit Strategies Using Woodies CCI
Traders using Woodies CCI often look for specific entry and exit points based on the patterns mentioned above. Here are some strategies:
- Entry Strategy: Enter a trade when a ZLR pattern is identified in the direction of the trend, or when a TLB or RD suggests a trend reversal. Confirm the entry with other technical indicators or price action to increase the probability of success.
- Exit Strategy: Consider exiting a trade when the CCI shows a HFE pattern, indicating a potential reversal from an overbought or oversold condition. Also, exit if the CCI moves against your position, suggesting a weakening of the current trend.
Risk Management with Woodies CCI
Effective risk management is essential when trading with Woodies CCI. Traders should:
- Set stop-loss orders based on the volatility of the instrument being traded or a set number of pips away from the entry point.
- Use position sizing to control the amount of risk taken on each trade.
- Monitor for sideways patterns and avoid trading in these consolidation periods where false signals are more likely.
Combining Woodies CCI with Other Indicators
For enhanced trading decisions, Woodies CCI can be combined with other technical analysis tools:
- Moving Averages: To confirm the trend indicated by Woodies CCI.
- Volume Indicators: To validate the strength of the signal provided by the CCI patterns.
- Support and Resistance Levels: To identify potential barriers to price movements signaled by Woodies CCI.
By understanding and applying these patterns, signals, and strategies, traders can utilize Woodies CCI as a robust technical analysis tool to navigate the markets.
1.2. The Role of the CCI in Market Analysis
The Commodity Channel Index (CCI) is not only a tool for identifying the cyclical nature of commodities but also an indicator that has found its way into the analysis of stocks and currencies. The CCI’s ability to compare current price levels with their average over a specific period makes it a valuable instrument for traders aiming to gauge momentum and trend direction.
Key Functions of the CCI:
- Trend Identification: By monitoring the CCI’s movement relative to the zero line, traders can discern the strength of a trend. A CCI reading sustained above zero suggests an uptrend, while one below zero may indicate a downtrend.
- Market Sentiment: The CCI helps in assessing whether a security is overbought or oversold. Readings above +100 signal overbought conditions, hinting at a potential price reversal. Readings below -100 suggest oversold conditions, which might precede a price bounce.
- Divergence Detection: Spotting divergences between the CCI and the price action of a security can be a precursor to market reversals. A divergence occurs when price records a new high or low that is not confirmed by the CCI, signaling a potential shift in momentum.
- Timing Trades: The CCI can aid in determining optimal entry and exit points. Traders might look for the CCI to cross beyond the +100 or -100 thresholds to signal potential trade opportunities.
Advantages of Using the CCI:
- Versatility: The CCI is applicable across various time frames, making it suitable for day traders, swing traders, and long-term investors alike.
- Market Breadth: It can be used for analysis in different markets, including commodities, stocks, and currencies.
- Signal Clarity: The CCI provides clear, numerical readings that can simplify decision-making processes for traders.
Practical Considerations:
- False Signals: Like any technical indicator, the CCI is not foolproof and can generate false signals. Traders should use it in conjunction with other analysis tools and techniques.
- Adjustable Parameters: The standard CCI period is 20 days, but traders can adjust this to suit their individual trading styles and objectives.
- Risk Management: Traders should employ proper risk management strategies when using the CCI to make trading decisions, as market conditions can change rapidly.
Traders who incorporate the CCI into their market analysis can leverage its multifaceted applications to enhance their understanding of market dynamics and improve the precision of their trading strategies. The CCI’s integration with other technical tools can further refine analysis and bolster the robustness of trading signals.
1.3. Differences Between Traditional CCI and Woodies CCI
Calculating Traditional CCI vs. Woodies CCI
Traditional CCI is calculated using the following steps:
- Typical Price (TP): Calculate the TP for each period as the average of the high, low, and close.
- Moving Average (MA): Calculate the 20-period Simple Moving Average (SMA) of the TP.
- Mean Deviation (MD): Compute the average of the absolute differences between each period’s TP and the 20-period SMA.
- CCI Formula: Apply the formula
CCI = (TP - MA) / (0.015 * MD), where 0.015 is a constant used to ensure that approximately 75% of the data points will fall between -100 and +100 in the CCI calculation.
Woodies CCI, in contrast, involves a more complex setup:
- Short-term CCI: Calculate the CCI for a shorter period, such as 6 periods.
- Long-term CCI: Calculate the CCI for a longer period, such as 14 periods.
- Patterns and Signals: Identify Woodies-specific patterns like ZLR and TLB within the context of the dual CCI lines.
- Sidewinder: Evaluate the market’s condition using the Sidewinder indicator for additional context on volatility and trend strength.
Trading Signals Comparison
| Signal Type | Traditional CCI | Woodies CCI |
|---|---|---|
| Overbought/Oversold | Above +100 / Below -100 | Patterns like ZLR and TLB |
| Trend Confirmation | Cross above/below zero line | Short CCI crossing Long CCI |
| Divergence | Price and CCI divergence | More nuanced with dual CCI lines |
| Entry/Exit Points | Cross above/below +/-100 levels | Specific Woodies patterns |
Adaptation to Trading Style
- Traditional CCI:
- Suitable for longer-term trend following.
- Simplified signal generation; ideal for traders who prefer a minimalist approach.
- Focuses on broad market trends rather than specific patterns.
- Woodies CCI:
- Tailored for active and intra-day trading.
- Offers complex patterns for precise entry and exit strategies.
- Emphasizes short-term price movements and volatility.
Visual Representation
Traditional CCI is typically represented by a single line oscillating around a zero line, with the +100 and -100 levels marked to indicate potential overbought or oversold conditions.
Woodies CCI, however, will display two lines (short-term and long-term CCI) and may include horizontal lines for pattern recognition and additional markers for the Sidewinder indicator.
2. Standard Settings for Woodies CCI
When integrating the Woodies CCI into a trading strategy, it’s essential to understand the role of pattern recognition. The Woodies CCI community has identified several patterns that are considered to have predictive value. Among these are the zero-line reject (ZLR), the reverse divergence (also known as ‘ghost’), and the trendline break. Each pattern has specific criteria and is used to signal potential entry and exit points.
Zero-Line Reject (ZLR):
- Criteria: When the CCI line bounces off or near the zero line in the direction of the prevailing trend.
- Signal: Potential continuation of the current trend.
Reverse Divergence (Ghost):
- Criteria: Occurs when price makes a new high or low that is not confirmed by the CCI, suggesting a weakening trend.
- Signal: Possible trend reversal or correction.
Trendline Break:
- Criteria: A trendline drawn along the CCI peaks or troughs is broken.
- Signal: Indicates a potential change in the momentum and possibly the trend.
Risk management is a cornerstone of trading with the Woodies CCI. Traders often set stop-loss orders based on the patterns identified by the indicator, such as a few ticks above or below the high or low of the setup bar that precedes the entry signal. Additionally, the concept of ‘add-on’ positions is popular among Woodies CCI practitioners. This involves adding to a position as new signals confirm the trend, thereby potentially maximizing profits.
The Woodies CCI also includes a unique aspect called the CCI Turbo, which is a thinned version of the CCI line used to sharpen the entry and exit signals. It is typically set to a very short period, such as 3 or 4, and acts as a trigger line for trades.
Integration with other indicators can enhance the effectiveness of the Woodies CCI. For example, traders might use moving averages to confirm the trend direction suggested by Woodies CCI patterns or volume indicators to validate the strength of a signal.
In the table below, we summarize the key components of the Woodies CCI system:
| Component | Description | Purpose |
|---|---|---|
| CCI 14 | Longer-term CCI line | Provides a stable indication of market momentum. |
| CCI 6 | Short-term CCI line | Offers immediate read on price changes for quick responses. |
| Pattern Recognition | Identifying specific setups such as ZLR, Ghost, Trendline Break | Signals potential entry and exit points based on recurring market behavior. |
| Risk Management | Using stop-loss orders and add-on positions | Protects against large losses and maximizes potential gains. |
| CCI Turbo | Very short period CCI line | Acts as a trigger line for sharper entry and exit signals. |
| Indicator Integration | Combining with other technical tools | Confirms signals and adds layers of confirmation to the trading strategy. |
Ultimately, the Woodies CCI is not just about the indicator itself but the trading community’s collective wisdom around it. Traders share experiences and fine-tune the system, which is continually evolving. As with any trading tool, the key to success with the Woodies CCI lies in understanding its nuances, practicing diligently, and applying it consistently within a comprehensive trading plan.
2.1. Default Parameters and Their Significance
When analyzing the performance of the Woodies CCI, traders often look for specific patterns and signals to make informed decisions. Among these are the Zero Line Reject (ZLR) pattern and the Trend Line Break (TLB).
Zero Line Reject (ZLR) is a pattern that occurs when the CCI 6 bounces off the zero line, suggesting that the prevailing trend is likely to continue. This pattern is particularly useful in identifying opportunities to join an existing trend after a minor pullback. Traders watch for the CCI 6 to approach the zero line and then move away from it, indicating that the momentum is still with the underlying trend.
Trend Line Break (TLB), on the other hand, is a signal that may indicate a trend reversal. This happens when the CCI line breaks through a trend line drawn on the indicator itself. A TLB to the upside suggests a potential bullish reversal, while a TLB to the downside points to a potential bearish reversal. Traders use this signal to anticipate significant changes in the market’s direction.
Patterns and Signals:
- Zero Line Reject (ZLR):
- Bullish ZLR: CCI 6 rebounds from zero line in uptrend
- Bearish ZLR: CCI 6 rebounds from zero line in downtrend
- Trend Line Break (TLB):
- Bullish TLB: CCI line breaks above the trend line
- Bearish TLB: CCI line breaks below the trend line
Traders may also employ the Woodies CCI with other technical tools such as moving averages, RSI, or Fibonacci retracements to increase the robustness of their trading signals. For example, a trader might look for a ZLR pattern in conjunction with a moving average crossover to confirm the strength of the trend continuation.
The use of multiple time frames can also enhance the effectiveness of Woodies CCI signals. A trader might use a longer time frame to establish the prevailing trend and a shorter time frame to pinpoint entry and exit points. This multi-timeframe analysis can help traders to align their trades with the bigger market picture.
Key Takeaways for Traders:
- Utilize the ZLR pattern to identify trend continuations.
- Monitor for TLB signals to detect potential trend reversals.
- Combine Woodies CCI with other technical analysis tools for confirmation.
- Apply multi-timeframe analysis to align trades with larger trends.
By integrating these patterns and signals into their trading strategies, traders can leverage the Woodies CCI to navigate the markets with greater precision and confidence.
2.2. Adjusting Time Frames for Different Markets
When approaching the task of adjusting time frames for different markets, traders should consider several factors to optimize the use of Woodies CCI. The goal is to align the indicator’s sensitivity with the market’s characteristic movements, ensuring that the signals generated are both timely and reliable.
Forex Markets:
- High liquidity and 24-hour trading make forex markets unique.
- Shorter time frames such as 15-minute or 1-hour charts are often preferred.
- These settings allow traders to capitalize on the quick price changes common in forex.
Stocks and Indices:
- Typically, they do not match the forex market’s liquidity or continuous trading hours.
- Longer time frames like 4-hour or daily charts can be more appropriate.
- They help to smooth out the intraday volatility, offering a clearer view of the trend.
Commodity Markets:
- Commodities like oil or gold react to geopolitical events and supply-demand shifts.
- Intermediate time frames, such as 1-hour or 2-hour charts, may provide the best balance.
- This approach captures significant moves without the delay associated with longer periods.
Key Considerations for Time Frame Adjustment:
| Aspect | Consideration |
|---|---|
| Market Volatility | Adjust time frames to capture significant moves without too much noise. |
| Trading Volume | Ensure the time frame reflects the liquidity of the market. |
| Market Hours | Consider the trading hours of the market to avoid flat periods. |
| Signal Quality | Aim for a time frame that reduces false signals and doesn’t lag behind market moves. |
| Backtesting | Utilize historical data to test the effectiveness of different time frames. |
Traders should engage in a process of experimentation and refinement with the Woodies CCI settings. This involves:
- Backtesting different time frames to see how well they would have worked in the past.
- Paper trading with real-time data to get a feel for the indicator’s performance without financial risk.
- Analyzing the results to identify the time frame that provides the best combination of signal frequency and accuracy.
Remember, the objective is to find a time frame that not only fits the market’s characteristics but also resonates with the trader’s individual style and risk tolerance. Flexibility and adaptability are essential traits for traders looking to fine-tune their use of technical indicators like Woodies CCI.
2.3. The Importance of Period Length in Woodies CCI
Experimentation with Woodies CCI Period Lengths
| Trading Style | Recommended Period Length | Sensitivity | Signal Frequency |
|---|---|---|---|
| Day Trading | Shorter (e.g., 6 to 9) | High | High |
| Swing Trading | Longer (e.g., 20 to 30) | Low | Low |
When fine-tuning the period length for Woodies CCI, traders should consider the implications of each adjustment. A shorter period may be suitable for scalping strategies, where the goal is to profit from small price changes over a short time frame. This setting can help scalpers identify quick entry and exit points. However, the risk of overtrading and the cost of transaction fees should be weighed against the potential benefits.
For position traders, who hold trades over a longer term, a longer period length might be more appropriate. This approach can help in identifying and riding sustainable trends, reducing the impact of short-term volatility.
Backtesting is an invaluable tool in determining the effectiveness of different period lengths. Traders should analyze historical data to assess how changes to the period length would have impacted their trading outcomes. This process can help identify the best settings for their strategies and market conditions.
Real-time practice in a demo account can also provide insights into how different period lengths perform in live market conditions. This hands-on approach allows traders to gain experience without risking real capital.
| Adjustment | Impact on Woodies CCI |
|---|---|
| Shorten Period | Increases sensitivity, may increase false signals |
| Lengthen Period | Decreases sensitivity, may miss short-term opportunities |
| Backtest | Validates effectiveness of period length settings |
| Real-time Demo Testing | Offers practical understanding of settings in current market |
Adjusting the period length in Woodies CCI is a dynamic process that should align with a trader’s market analysis, trading plan, and risk management strategies. By carefully considering these aspects, traders can leverage Woodies CCI to enhance their trading performance.
3. Woodies CCI Trading Strategies
Incorporating Woodies CCI into your trading arsenal can provide a robust framework for market analysis. It’s essential to understand the various patterns and strategies associated with this powerful indicator.
Patterns to Watch:
- Zero-Line Reject (ZLR): Monitor the CCI line as it approaches and rejects the zero line, indicating potential trend continuation.
- Trend Line Break (TLB): Keep an eye on the CCI as it breaks through established trend lines, hinting at a possible trend change or acceleration.
- Reverse Divergence (Rev Diver): Look for instances where the CCI makes a lower high in an uptrend or a higher low in a downtrend, contrasting with price action.
- Horizontal Trend Line Break (HTLB): Detect when the CCI crosses established horizontal support or resistance levels, suggesting a breakout or breakdown.
Strategic Approaches:
- Trend Confirmation: Utilize the CCI’s sustained levels above +100 or below -100 to confirm strong trends and align trades accordingly.
- Divergence Trading: Identify divergence between the CCI and price for early signs of potential reversals.
- Breakout Strategies: Capitalize on CCI breakouts from range-bound conditions to enter new trends early.
| Strategy | Description | Signal for Action |
|---|---|---|
| ZLR Pattern | CCI approaches zero line and bounces in trend direction | Entry point for trend continuation |
| Trend Following | CCI sustains above +100 or below -100 | Entry point in the direction of the trend |
| Divergence Trading | Discrepancies between CCI and price action | Potential reversal and entry/exit point |
| Breakout Strategies | CCI breaks out from consolidation | Entry point in direction of new trend |
Traders should also consider combining Woodies CCI with other technical tools and indicators to validate signals and enhance decision-making. It’s important to remember that no indicator is foolproof, and risk management strategies must always be in place to protect against potential losses.
3.1. Zero-Line Reject (ZLR) Pattern
Understanding the Zero-Line Reject (ZLR) Pattern
The Zero-Line Reject (ZLR) pattern is a tactical approach within the framework of Woodies CCI system, which is primarily focused on trend continuation trades. The Commodity Channel Index (CCI) is a versatile indicator that can help traders gauge the momentum and direction of a price movement. When the CCI approaches the zero-line but does not cross it, it signals that the prevailing trend might persist.
Here’s a breakdown of the ZLR pattern characteristics:
- Trend Confirmation: The CCI should be above +100 for uptrends or below -100 for downtrends to confirm strong momentum.
- Zero-Line Approach: The CCI dips towards the zero line in an established trend but pivots before crossing it.
- Trend Continuation Signal: The bounce off the zero line suggests the trend is likely to continue.
Executing Trades with the ZLR Pattern
When implementing the ZLR pattern in trading, consider the following steps:
- Identify the Trend: Use the CCI to ascertain if the market is in a strong uptrend or downtrend.
- Spot the ZLR: Look for the CCI to approach the zero-line and reject it, indicating a potential continuation of the trend.
- Confirm the Signal: Seek additional confirmation through price action, such as higher highs and lows in an uptrend or the opposite in a downtrend.
- Determine Entry Points: Enter the trade as the CCI moves back in the direction of the prevailing trend after the zero-line reject.
- Set Stop-Loss Orders: Place stop-loss orders beyond the most recent swing low or high to manage risk effectively.
Risk Management with the ZLR Pattern
Risk management is crucial when trading with the ZLR pattern. The placement of stop-loss orders is a key aspect of this strategy:
- Stop-Loss Placement: Position stop-loss orders just past the recent swing low or high to limit potential losses.
- Risk Assessment: Evaluate the distance between the entry point and the stop-loss to calculate the trade’s risk.
Why the ZLR Pattern is Effective
The ZLR pattern’s effectiveness lies in its ability to identify and capitalize on market momentum. Here’s why it’s a preferred strategy:
- Momentum Indicator: The CCI is adept at highlighting momentum, which is the cornerstone of the ZLR pattern.
- Defined Entry Points: The ZLR pattern provides specific entry points, helping traders to synchronize with the market trend.
- Structured Risk Management: The strategy includes clear guidelines for stop-loss placement, aiding in risk control.
Applicability in Trending Markets
The ZLR pattern is particularly potent in trending markets where momentum can be clearly identified. It allows traders to join a trend with the confidence that comes from a well-defined strategy. While the ZLR pattern can offer significant opportunities, it’s imperative for traders to conduct thorough analysis and apply sound risk management practices.
3.2. Trend Following with Woodies CCI
Incorporating Woodies CCI into a trading strategy requires a systematic approach. Here’s how traders can leverage this indicator for trend following:
- Identify the Market Context: Before applying Woodies CCI, assess the overall market condition. Is the market trending or ranging? This indicator thrives in trending environments.
- Setting Up the Indicator: Use the standard Woodies CCI setup with a primary CCI (14-period) and a secondary CCI (6-period). The secondary CCI helps to filter out weaker signals.
- Signal Confirmation: Wait for both CCI lines to cross the +/-100 levels for a stronger confirmation of trend presence. The primary CCI line crossing is your initial signal, while the secondary line crossing confirms the trend’s strength.
- Monitoring the Zero Line: Keep an eye on the CCI lines in relation to the zero line. Consistently above zero suggests a strong uptrend, while consistently below zero indicates a strong downtrend.
- Entry Points: Enter a trade when the Woodies CCI crosses beyond the +/-100 mark. This indicates a potential new trend. For long positions, enter when the CCI crosses above +100. For short positions, enter when the CCI crosses below -100.
- Exit Points: Consider exiting a trade when the Woodies CCI crosses back into the +/-100 zone, which may signal a weakening trend. Alternatively, set a predefined profit target or stop-loss level to manage risk.
- Risk Management: Always apply sound risk management. This can include setting stop-loss orders, adjusting position sizes, and using trailing stops to protect profits.
Here is a tabular representation of the key aspects of using Woodies CCI for trend following:
| Aspect | Description |
|---|---|
| Market Context | Assess if the market is suitable for trend following. |
| Indicator Setup | Use primary (14-period) and secondary (6-period) CCI lines. |
| Signal Confirmation | Both CCI lines crossing +/-100 levels indicate a strong trend. |
| Zero Line Monitoring | Consistent position above/below zero line indicates buying/selling pressure. |
| Entry Points | Cross beyond +/-100 level suggests a new trend. |
| Exit Points | Cross back into +/-100 zone may signal trend weakening. |
| Risk Management | Apply stop-loss orders and adjust position sizes accordingly. |
By adhering to these guidelines, traders can utilize Woodies CCI to effectively follow trends and potentially maximize their returns. It is important to remember that no indicator is infallible, and Woodies CCI should be used in conjunction with other technical analysis tools and market knowledge for the best results.
3.3. Divergence Trading Using Woodies CCI
When engaging in divergence trading with Woodies CCI, it’s vital to understand the mechanics of the Commodity Channel Index (CCI). Developed by Donald Lambert, the CCI measures the difference between the current price and the historical average price. When applied to Woodies CCI, the indicator is fine-tuned to capture the momentum of a security.
Key Aspects of Woodies CCI Divergence Trading:
- Identification of Divergence: Spotting divergence involves observing the behavior of the price relative to the CCI indicator. Traders should look for instances where the price action is moving in the opposite direction of the CCI.
| Price Action | Woodies CCI | Type of Divergence |
|---|---|---|
| New Low | Higher Low | Bullish Divergence |
| New High | Lower High | Bearish Divergence |
- Confirmation of Divergence: Confirmation is a critical step to avoid false signals. Traders should wait for the CCI to complete its pattern and for the price to cross the +/-100 levels.
| Divergence Type | CCI Crossing | Confirmation Point |
|---|---|---|
| Bullish | Above -100 | Potential Buy |
| Bearish | Below +100 | Potential Sell |
- CCI Patterns for Trade Entry: Specific patterns in the Woodies CCI can offer additional entry signals. The ‘hook’ and the ‘zero-line reject’ are two such patterns that traders often look for.
| CCI Pattern | Description | Implication |
|---|---|---|
| Woodies CCI Hook | A slight bend in the CCI after crossing +/-100 | Entry Confirmation |
| Zero-Line Reject | CCI bounces off the zero line | Momentum Shift |
- Risk Management: Setting stop-loss orders appropriately is crucial to protect against market reversals that do not occur as expected.
| Divergence Type | Stop-Loss Placement | Purpose |
|---|---|---|
| Bullish | Below Recent Low | Minimize Losses |
| Bearish | Above Recent High | Minimize Losses |
- Multiple Time Frame Analysis: Using multiple time frames can provide a more robust signal. A divergence that appears on both short and long time frames may suggest a stronger trading opportunity.
| Time Frame | Divergence Confirmation | Strength of Signal |
|---|---|---|
| Short | Yes | Moderate |
| Long | Yes | Strong |
Traders must recognize that patience and discipline are key when trading divergences. Since divergence can lead to extended periods where the price continues with the current trend, it’s important not to rush into trades without proper confirmation and risk management strategies in place.
3.4. Breakout Strategies with Woodies CCI
When deploying Woodies CCI in your trading arsenal, the key is to combine the indicator’s signals with a disciplined approach to entry and exit points. Here are some strategic steps to consider:
- Entry Signal: Look for the Woodies CCI lines to break through the +100 (for long positions) or -100 (for short positions) as your primary entry signal.
- Confirmation: Seek additional confirmation through pattern recognition, such as the Woodies CCI ‘hook’ pattern.
- Retest Verification: Confirm the breakout’s validity by observing a retest of the breakout level where the CCI lines approach but do not cross the +100 or -100 level again.
- Stop-Loss Orders: Set stop-loss orders strategically to manage risk effectively, positioning them just beyond the breakout level or the most recent swing high/low.
| Strategy Component | Description |
|---|---|
| Entry Signal | CCI lines crossing +/-100 |
| Confirmation | Hook pattern or other CCI-based pattern |
| Retest Verification | CCI lines approach but don’t recross +/-100 |
| Stop-Loss Orders | Placed beyond breakout level or recent extremes |
Position Sizing and trade management are also essential. Adjust your position size based on the volatility of the asset and your risk tolerance. As the trade progresses, you might consider a trailing stop to lock in profits while giving the trade room to grow.
Backtesting your strategy with historical data can provide insights into its effectiveness and help refine your approach. Remember, no strategy works all the time; market conditions can change, and adaptability is a trader’s virtue.
Woodies CCI can be a powerful tool for breakout strategies, but it should be part of a comprehensive trading plan that includes technical analysis, fundamental analysis, and a clear understanding of market sentiment. Always ensure you are trading within your risk parameters and have a clear exit strategy for when the market moves against your position.
4. Advanced Woodies CCI Settings
Adjusting Woodies CCI Parameters for Different Markets
Traders should be aware that different markets might require specific adjustments to the Woodies CCI parameters. For instance, in highly volatile markets, a longer period might be needed to filter out excessive noise. Conversely, in less volatile markets, a shorter period may be more beneficial to respond to quicker price changes. It’s essential for traders to backtest different settings to find the optimal balance for each market they trade.
| Market Type | Suggested CCI Period | Reasoning |
|---|---|---|
| Highly Volatile | 20 – 30 | Reduces noise and false signals |
| Moderately Volatile | 14 – 20 | Standard setting for balanced sensitivity |
| Less Volatile | 6 – 13 | Increases sensitivity for quicker reactions |
Combining Woodies CCI with Other Technical Tools
To enhance the reliability of trading signals, combining the Woodies CCI with other technical tools can be advantageous. Support and resistance levels, Fibonacci retracements, and candlestick patterns are commonly used in conjunction with the CCI. By doing so, traders can validate signals and improve the accuracy of their trade entries and exits.
| Technical Tool | Purpose in Combination with CCI |
|---|---|
| Support/Resistance | Confirm CCI signals |
| Fibonacci Retracements | Identify potential reversal zones |
| Candlestick Patterns | Validate entry and exit points |
Risk Management with Woodies CCI
Using the Woodies CCI for trade decisions must always be paired with sound risk management practices. Setting stop-loss orders at strategic levels can help protect capital. Additionally, traders should employ a favorable risk-reward ratio, often aiming for a minimum of 1:2. This means that for every unit of risk taken, the potential reward should be at least twice that amount.
| Risk Management Strategy | Description |
|---|---|
| Stop-Loss Orders | Limit potential losses |
| Risk-Reward Ratio | Ensure potential rewards justify risks |
| Position Sizing | Control exposure per trade |
Continual Learning and Adaptation
The markets are ever-changing, and so should be the approach of traders using the Woodies CCI. Continuous learning and adapting to new market conditions are paramount for sustained success. Traders need to stay informed about economic events and market cycles, adjusting their strategies and settings on the Woodies CCI accordingly.
| Adaptation Strategy | Importance |
|---|---|
| Market Research | Stay updated with economic and market changes |
| Strategy Evaluation | Regularly review and adjust trading strategies |
| Education | Keep learning new techniques and concepts |
By meticulously customizing and combining the Woodies CCI with other technical tools, and adhering to rigorous risk management protocols, traders can strive to enhance their performance in various market conditions.
4.1. Customizing Woodies CCI for Scalping
Adjusting Woodies CCI Settings for Scalping
When customizing Woodies CCI for scalping, it’s essential to tweak the settings for optimal response to market movements. Here are some recommended adjustments:
- CCI Period Length: Reduce to between 3 and 6 for increased sensitivity.
- Double CCI Setup: Use a combination of a short-term CCI (6) and a long-term CCI (14).
- Entry Signals: Look for the short-term CCI crossing the long-term CCI.
- ZLR Patterns: Consider entering on a movement towards the zero line for quicker trades.
Complementary Tools for Enhanced Scalping
To refine the scalping strategy, traders should incorporate additional technical tools:
- Moving Averages: Helps to confirm the trend direction and potential entry points.
- Bollinger Bands: Useful for identifying overbought and oversold conditions.
- Volume Indicators: Provides insight into the strength of price movements.
Automation for Efficiency
Automating the trading process based on Woodies CCI signals can significantly improve the efficiency of scalping:
- Trade Execution: Automate entries and exits to capitalize on quick market changes.
- Risk Management: Set predefined stop-loss and take-profit levels to manage risk effectively.
- Consistency: Ensures that the strategy is applied consistently without emotional interference.
By fine-tuning the Woodies CCI indicator and integrating other technical tools, scalpers can create a responsive and efficient trading strategy tailored to the fast-paced nature of scalping. Automation plays a key role in maintaining precision and speed, which are crucial for the success of a scalping strategy.
4.2. Using Woodies CCI for Swing Trading
Adjusting Woodies CCI Settings for Swing Trading
Swing trading demands a nuanced approach to technical indicators. Woodies CCI, traditionally used for short-term trading, can be recalibrated to aid swing traders. By modifying the period settings, traders can reduce noise and focus on more significant trend shifts suitable for their trading horizon.
| Default Setting | Adjusted Setting for Swing Trading |
|---|---|
| CCI (14-period) | CCI (20 or 30-period) |
Lengthening the CCI period filters out minor fluctuations, offering a smoother representation of momentum over a longer time frame. This adjustment helps in identifying sustained price movements, which are of prime interest to swing traders.
Implementing a Dual CCI Strategy
A Dual CCI strategy can offer a more layered analysis of the market:
| Short-term CCI | Long-term CCI | Purpose |
|---|---|---|
| CCI (6-period) | CCI (14-period) | Immediate momentum and broader trend analysis |
The crossover of the short-term CCI above the long-term CCI, particularly when both are above the zero line, can signal a robust uptrend, presenting a potential buying opportunity.
Adapting Woodies CCI Patterns
Recognizing Woodies CCI patterns that align with swing trading tactics can be invaluable. The Zero-Line Reject (ZLR) pattern, for instance, can be a powerful signal in a swing trading context:
- ZLR Pattern: When the CCI bounces from the zero line amidst an ongoing trend, it may indicate trend continuation, serving as a trigger for trade entry.
Utilizing Multiple Timeframes
Employing multiple timeframes can greatly enhance the application of Woodies CCI for swing trading:
| Overall Trend Analysis | Timing Entries and Exits |
|---|---|
| Daily Chart CCI | 4-hour or Hourly Chart CCI |
Using a daily chart to assess the prevailing trend and a shorter timeframe chart for fine-tuning trade entries and exits can create a comprehensive trading strategy.
Adapting Woodies CCI for swing trading involves fine-tuning its parameters and interpreting its signals within the context of a longer trading horizon. By doing so, swing traders can leverage this dynamic indicator to identify high-probability trade setups and manage their trades with greater confidence.
4.3. Multi-Timeframe Analysis with Woodies CCI
Incorporating Woodies CCI into a multi-timeframe analysis strategy necessitates a clear understanding of the indicator’s components. The Woodies CCI consists of two lines: the CCI line itself and a simple moving average of the CCI known as the signal line. Traders often watch for the CCI line to cross above or below the signal line to identify momentum shifts.
Divergences between price action and the Woodies CCI readings can be particularly telling across multiple timeframes. A divergence occurs when price makes a new high or low that is not confirmed by the CCI. For instance, if the price hits a new high but the Woodies CCI fails to do so, this could indicate weakening momentum and a potential reversal. Spotting such divergences on a longer timeframe can be a powerful signal when corroborated by CCI readings on shorter timeframes.
Here is a step-by-step approach to multi-timeframe analysis with Woodies CCI:
- Identify the primary trend on a higher timeframe (e.g., daily chart).
- Look for trade setups on an intermediate timeframe (e.g., 4-hour chart) that align with the primary trend.
- Confirm entries with signals on a shorter timeframe (e.g., 1-hour chart).
| Timeframe | Purpose | Woodies CCI Role |
|---|---|---|
| Daily | Establish primary market trend | Gauge overall bullish or bearish sentiment |
| 4-hour | Refine trade setups | Identify potential entry points in line with daily trend |
| 1-hour | Confirm entry points | Provide additional entry signal confirmation |
Risk management remains a cornerstone of trading, irrespective of the strategy employed. Even with the added confirmation of multi-timeframe analysis, it is imperative to use stop-loss orders and manage position sizes to protect against market volatility and unexpected events.
Moreover, traders should be aware of the economic calendar and news events that may cause sudden shifts in market sentiment, potentially overriding technical signals provided by the Woodies CCI.
By integrating Woodies CCI into a multi-timeframe analysis, traders can leverage the strengths of this indicator while mitigating its weaknesses. It’s about creating a symbiotic relationship between different timeframes to extract the most reliable signals for trading decisions. This methodical approach to the markets can be a game-changer for traders seeking to enhance their technical analysis toolkit.
5. Risk Management and Woodies CCI
Risk Management with Woodies CCI
Trading effectively requires a robust risk management strategy, and the Woodies CCI is a powerful tool that can contribute significantly to this aspect of trading. Here’s how traders can integrate Woodies CCI into their risk management techniques:
Stop Loss Placement
- Identification of Extremes: Use Woodies CCI to identify extreme highs and lows in the market.
- Beyond the Peaks and Troughs: Set stop losses slightly beyond these identified points to safeguard against sudden reversals.
- Balance Between Tight and Loose: The goal is to strike a balance that prevents premature stop-outs while protecting from large drawdowns.
Position Sizing
- Signal Strength Assessment: Evaluate the strength of Woodies CCI signals to determine the conviction behind a trade.
- Size Adjustment: Increase position sizes with stronger signals and decrease them when signals are weaker.
- Risk Alignment: Ensure that the size of the position correlates with the level of risk indicated by the CCI reading.
Combining Technical Indicators
- Confirmatory Approach: Pair Woodies CCI with other indicators like moving averages or RSI for signal confirmation.
- Filtering False Signals: A multi-indicator strategy can help eliminate noise and false trading signals.
- Enhanced Decision-Making: Using a combination of tools leads to more robust and reliable trading decisions.
Optimizing Risk-to-Reward
- Pattern Analysis: Scrutinize CCI patterns to understand potential market movements and reversal points.
- Strategic Trade Execution: Integrate CCI analysis into trade execution to improve the potential risk-to-reward ratio.
- Continuous Refinement: Regularly review and refine the use of Woodies CCI within the risk management framework for optimal results.
By incorporating these strategies, traders can leverage the Woodies CCI not only as a directional indicator but also as a means to manage and mitigate risk. This multifaceted approach can be a cornerstone of a disciplined and successful trading methodology.
5.1. Setting Stop Losses with Woodies CCI Signals
Woodies CCI provides a nuanced approach to risk management in trading. By using the Commodity Channel Index (CCI) as a core component of stop loss strategy, traders can align their exit points with market dynamics. Here’s how to effectively use Woodies CCI for setting stop losses:
- Identify the CCI Pattern: Determine the Woodies CCI pattern that initiated the trade. For a Short Entry following a Zero-Line Reject (ZLR), place the stop loss above the swing high associated with the ZLR.
- Trailing Stop Losses: Implement a trailing stop loss strategy by monitoring the CCI’s behavior relative to the zero line. As the trade moves in your favor, adjust the stop loss accordingly to secure profits or to minimize losses.
- CCI Period Length: Select an appropriate CCI period length. A longer period may provide a more conservative stop loss distance, suitable for longer-term trends. A shorter period may yield a tighter stop, beneficial for quick trades and minimizing market exposure.
- Monitor Divergence: Keep an eye out for divergences between the CCI and price action. A price peak or trough unconfirmed by the CCI could indicate an impending reversal, warranting a reassessment of stop loss placement.
By integrating Woodies CCI into stop loss strategies, traders can tailor their risk management to the specific characteristics of the trade and the market’s momentum, enhancing their ability to protect capital while pursuing profitable opportunities.
5.2. Position Sizing Based on CCI Readings
When incorporating the Woodies CCI into position sizing strategies, it is essential to establish clear guidelines for how the indicator’s readings will influence the size of the trade. Here is a basic framework that traders might adopt:
| CCI Reading | Position Sizing Strategy |
|---|---|
| Above +200 | Consider maximum position size based on risk tolerance |
| +100 to +200 | Increase position size cautiously |
| -100 to +100 | Maintain a neutral or standard position size |
| -100 to -200 | Decrease position size cautiously |
| Below -200 | Consider minimum position size based on risk tolerance |
The key to success with this strategy lies in the consistency of its application and the trader’s ability to stick to their predetermined risk management rules. It is also crucial for traders to remember that the CCI is just one of many tools and should not be used in isolation. Combining the CCI with other indicators and analysis methods can provide a more comprehensive view of the market and help in making more informed trading decisions.
Furthermore, traders might use the CCI in conjunction with stop-loss orders to further manage risk. For example, a larger position size based on a strong CCI reading could be accompanied by a tighter stop-loss, while a smaller position size on a weaker CCI signal might allow for a wider stop-loss, providing the trade with more room to breathe.
In practice, a trader might incrementally adjust their position size as the CCI reading changes. If the CCI moves from a moderate to a strong signal, the trader could scale up their position in steps, rather than all at once. This gradual approach helps manage risk and can improve the psychological comfort of the trader, as it avoids sudden and large changes in exposure.
Risk management is an ongoing process, and traders should continuously assess their positions and adjust their sizes as new information comes to light. By doing so, traders can ensure they are always trading within their risk tolerance levels and are prepared for whatever the market may bring.
5.3. Combining Woodies CCI with Other Indicators for Enhanced Risk Management
Woodies CCI is a popular tool among traders for identifying momentum and potential reversals in the market. However, no indicator should be used in isolation. To enhance the reliability of trading signals, traders often integrate Woodies CCI with the Average Directional Index (ADX). The ADX helps determine the strength of a trend. A rule of thumb is to consider trades where the Woodies CCI generates a signal and the ADX is above a certain threshold, typically 20-25, indicating a strong trend.
For those who prefer a more visual approach to trading, Ichimoku Clouds can be a valuable addition. The Ichimoku setup offers a comprehensive picture of the market by showing support/resistance, trend direction, and momentum. When the price is above the cloud and Woodies CCI confirms a bullish signal, it could be an opportune moment to enter a long position. Conversely, a price below the cloud along with a bearish Woodies CCI signal might suggest a short position.
Stochastic Oscillator is another momentum indicator that can work well with Woodies CCI. The Stochastic measures the current price relative to the high-low range over a set period. Traders can look for scenarios where both Woodies CCI and the Stochastic Oscillator indicate overbought or oversold conditions for a potential reversal.
Here’s a brief comparison of how these indicators complement Woodies CCI:
| Indicator | Function | Synergy with Woodies CCI |
|---|---|---|
| Moving Average | Identifies trend direction | Confirms CCI signals with MA crossovers |
| Bollinger Bands | Provides dynamic support/resistance | Validates CCI signals with price touches of Bands |
| OBV | Measures buying and selling pressure | Indicates trend strength or weakness alongside CCI |
| RSI | Assesses overbought/oversold conditions | Reinforces CCI signals when both indicate extremes |
| ADX | Evaluates trend strength | Confirms CCI signals in strong trends |
| Ichimoku Cloud | Offers a comprehensive market view | Aligns CCI signals with cloud position for trend confirmation |
| Stochastic Oscillator | Indicates momentum | Provides additional overbought/oversold confirmation with CCI |
Each of these indicators has its strengths, and when combined with Woodies CCI, they can provide a more nuanced view of the market. Traders should practice and refine their strategies using historical data and consider the overall market context when interpreting these combined signals. It’s essential to remember that even the best combinations are not foolproof and should be used within a well-considered risk management plan.
Key Takeaways:
- Adjust the Length of the CCI Period: Fine-tuning the length of the Commodity Channel Index (CCI) period is crucial for adapting to different market conditions. A shorter period may be more sensitive to price movements, while a longer period could provide a smoother indicator that’s less prone to false signals.
- Incorporate Multiple Time Frames: Utilizing Woodies CCI on multiple time frames allows traders to gain a comprehensive view of the market. This approach helps in confirming trends and can lead to more informed trading decisions.
- Combine with Other Indicators: To enhance the effectiveness of Woodies CCI strategies, it’s recommended to use additional indicators for confirmation. This multi-indicator approach can reduce the likelihood of false signals and improve overall trade accuracy.