1. What Is Auto Fibonacci Retracement
1.1. Overview of Fibonacci and Its Relevance in Trading
Fibonacci retracement is a popular tool among technical traders, based on the key numbers identified by mathematician Leonardo Fibonacci in the 13th century. These numbers, and the ratios derived from them, are used to identify potential reversal levels in the financial markets. The principle is based on the idea that markets will retrace a predictable portion of a move, after which they will continue to move in the original direction.
1.2. The Auto Fibonacci Retracement Indicator
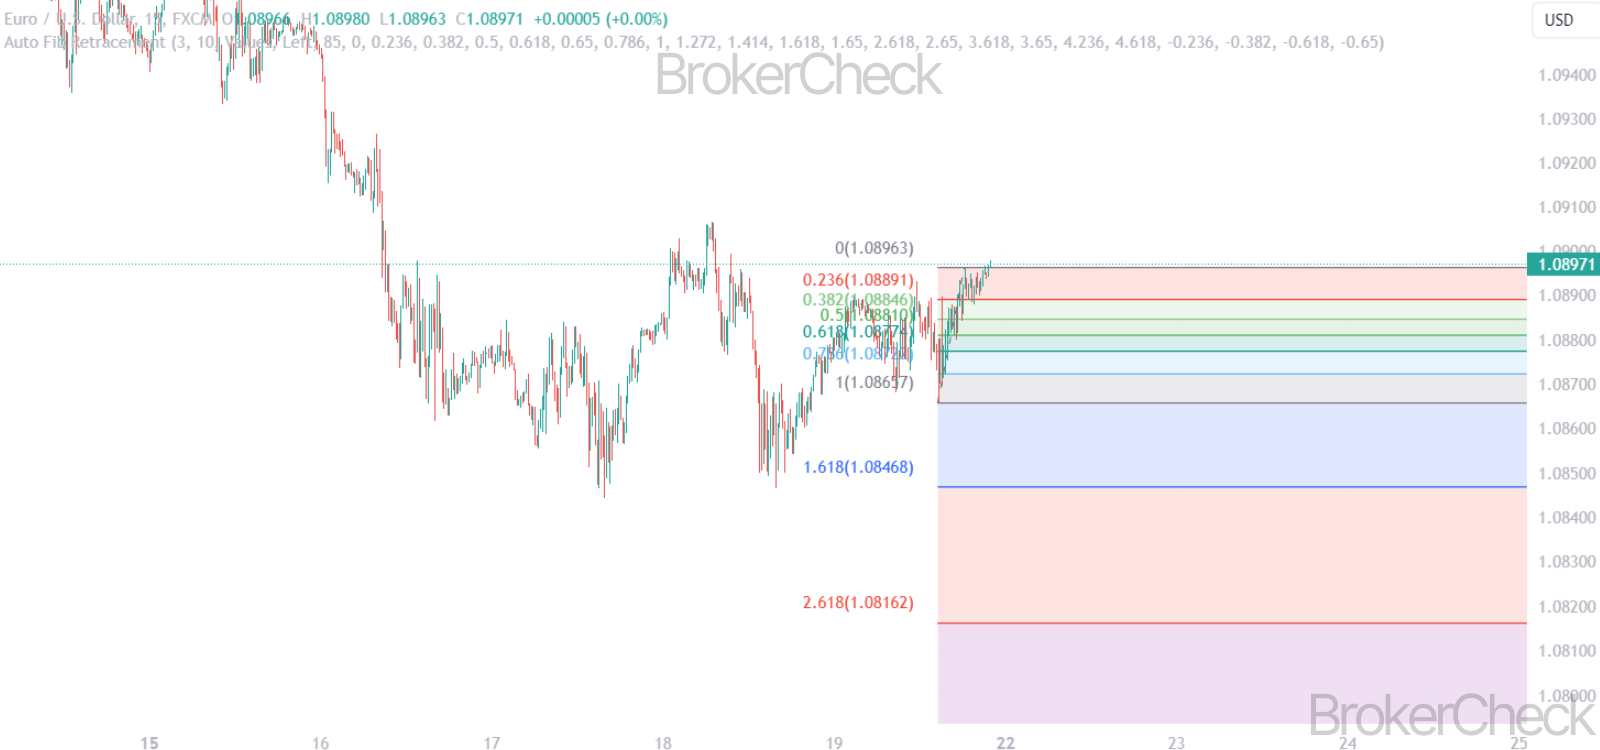
The Auto Fibonacci Retracement is an enhanced version of the traditional Fibonacci retracement tool. It automatically plots Fibonacci levels on a trading chart, identifying significant price points and potential trend reversal areas. This automatic feature saves time and increases accuracy for traders, allowing for quicker decision-making in fast-paced markets.
1.3. Key Features of the Indicator
- Automatic Detection: It identifies and plots Fibonacci levels without manual input.
- Customization Options: Traders can customize levels and colors to suit their trading style.
- Adaptability: It works on various timeframes and across multiple asset classes.
- User-Friendly Interface: Designed for both novice and experienced traders.
1.4. Why Traders Use Auto Fibonacci Retracement
- Precision in Trading: It offers precise entry and exit points based on historical data.
- Versatility: Applicable in both trending and range-bound markets.
- Integration with Other Analysis Tools: Enhances analysis when combined with other technical indicators.
| Feature | Description |
| Automatic Detection | Automatically plots Fibonacci levels on the chart |
| Customization | Allows for personalization of levels and visual settings |
| Adaptability | Suitable for various timeframes and markets |
| Integration Capability | Can be combined with other technical tools for enhanced analysis |
| Precision | Provides specific potential reversal points |
2. How to Set Up Auto Fibonacci Retracement
2.1. Selecting the Auto Fibonacci Retracement Tool
First, you need to locate and select the Auto Fibonacci Retracement tool from your trading platform’s toolbox. This tool is typically found in the technical analysis or drawing tools section.
2.2. Identifying the Relevant Price Range
- Swing Highs and Lows: The effectiveness of the tool hinges on correctly identifying significant swing highs and lows in the market.
- Recent Price Action: Focus on recent price movements to ensure the tool’s relevance to current market conditions.
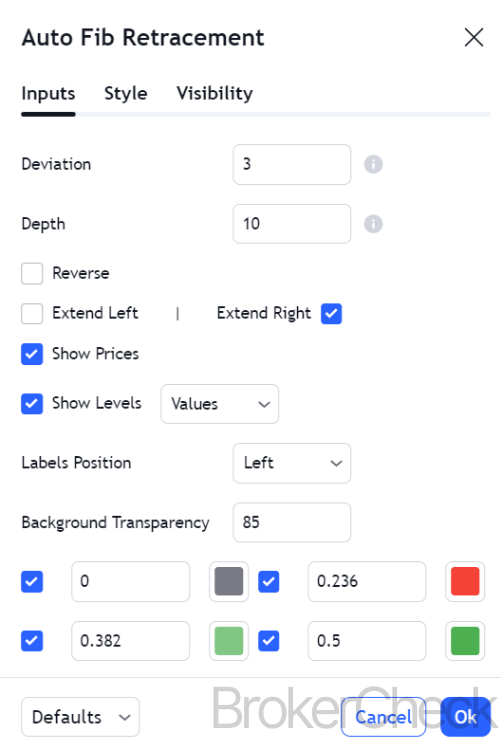
2.3. Configuring the Tool
- Adjusting Levels: While the default settings usually include key Fibonacci levels (23.6%, 38.2%, 50%, 61.8%, and 100%), you can customize these as per your trading strategy.
- Visual Customization: Modify the color, thickness, and style of the lines for clarity and ease of use.
2.4. Applying to Different Timeframes
- Timeframe Selection: Choose the chart timeframe that aligns with your trading style. The tool can be applied to anything from minute charts for day trading to weekly charts for long-term analysis.
- Adapting Settings for Timeframes: You may need to adjust the settings based on the selected timeframe for optimal performance.
2.5. Testing and Optimization
- Backtesting: Test the setup on historical data to gauge its effectiveness.
- Continuous Optimization: Regularly review and adjust the settings based on changing market conditions and your trading performance.
| Step | Description |
| Tool Selection | Locate and select the Auto Fibonacci Retracement tool in the trading platform |
| Price Range Identification | Identify significant swing highs and lows in the market |
| Configuration | Adjust levels and visual settings |
| Timeframe Application | Apply tool to preferred timeframe and adjust settings accordingly |
| Testing and Optimization | Backtest and continuously refine the setup |
3. Optimal Settings for Auto Fibonacci Retracement
3.1. Timeframe Considerations
Different timeframes can significantly impact the effectiveness of Fibonacci retracement levels. It’s crucial to understand how to adjust the settings of the Auto Fibonacci Retracement tool for optimal performance in various market conditions.
3.2. Short-Term Timeframes (Minutes to Hours)
- Typical Settings: In short-term timeframes, such as 1-minute to 1-hour charts, traders often focus on the 38.2%, 50%, and 61.8% retracement levels.
- Rationale: These levels often act as strong support and resistance in fast-moving markets.
- Application: Ideal for day traders and scalpers looking for quick market entries and exits.
3.3. Medium-Term Timeframes (Hours to Days)
- Typical Settings: In medium-term timeframes, like 4-hour to daily charts, all major Fibonacci levels (23.6%, 38.2%, 50%, 61.8%, and 100%) are relevant.
- Rationale: Provides a broader view of the market’s movement and potential reversal zones.
- Application: Suitable for swing traders who hold positions for several days.
3.4. Long-Term Timeframes (Days to Weeks)
- Typical Settings: For long-term timeframes, such as weekly charts, emphasis is often on 50% and 61.8% levels, sometimes including the 23.6% and 38.2% levels.
- Rationale: Long-term charts tend to respect these levels as key areas of market consolidation and reversal.
- Application: Useful for position traders focusing on longer-term market trends.
3.5. Adaptability to Market Conditions
- Volatile Markets: In highly volatile markets, traders might give more weight to the 50% and 61.8% levels, as prices are more likely to retrace these significant portions before resuming the trend.
- Trend Strength: During strong trends, the 23.6% and 38.2% levels might be more relevant as markets tend to retrace less in strong trending conditions.
3.6. Customization and Fine-Tuning
- Parameter Adjustment: Traders can adjust the parameters to include additional levels like 78.6% or custom levels based on their analysis.
- Visual Customization: Adjusting the color and thickness of the lines can help in differentiating between important and secondary levels.
| Timeframe | Key Levels | Application | Notes |
| Short-Term | 38.2%, 50%, 61.8% | Day trading | Quick entries and exits, responsive to fast moves |
| Medium-Term | 23.6% to 100% | Swing trading | Broader market view, suitable for several days’ hold |
| Long-Term | 50%, 61.8% | Position trading | Focus on significant market trends and reversals |
| Volatile Markets | 50%, 61.8% | All trading styles | More significant retracements expected |
| Strong Trends | 23.6%, 38.2% | All trading styles | Lesser retracements in strong market trends |
4. Trading Signals of Auto Fibonacci Retracement
4.1. Basic Principles of Interpretation
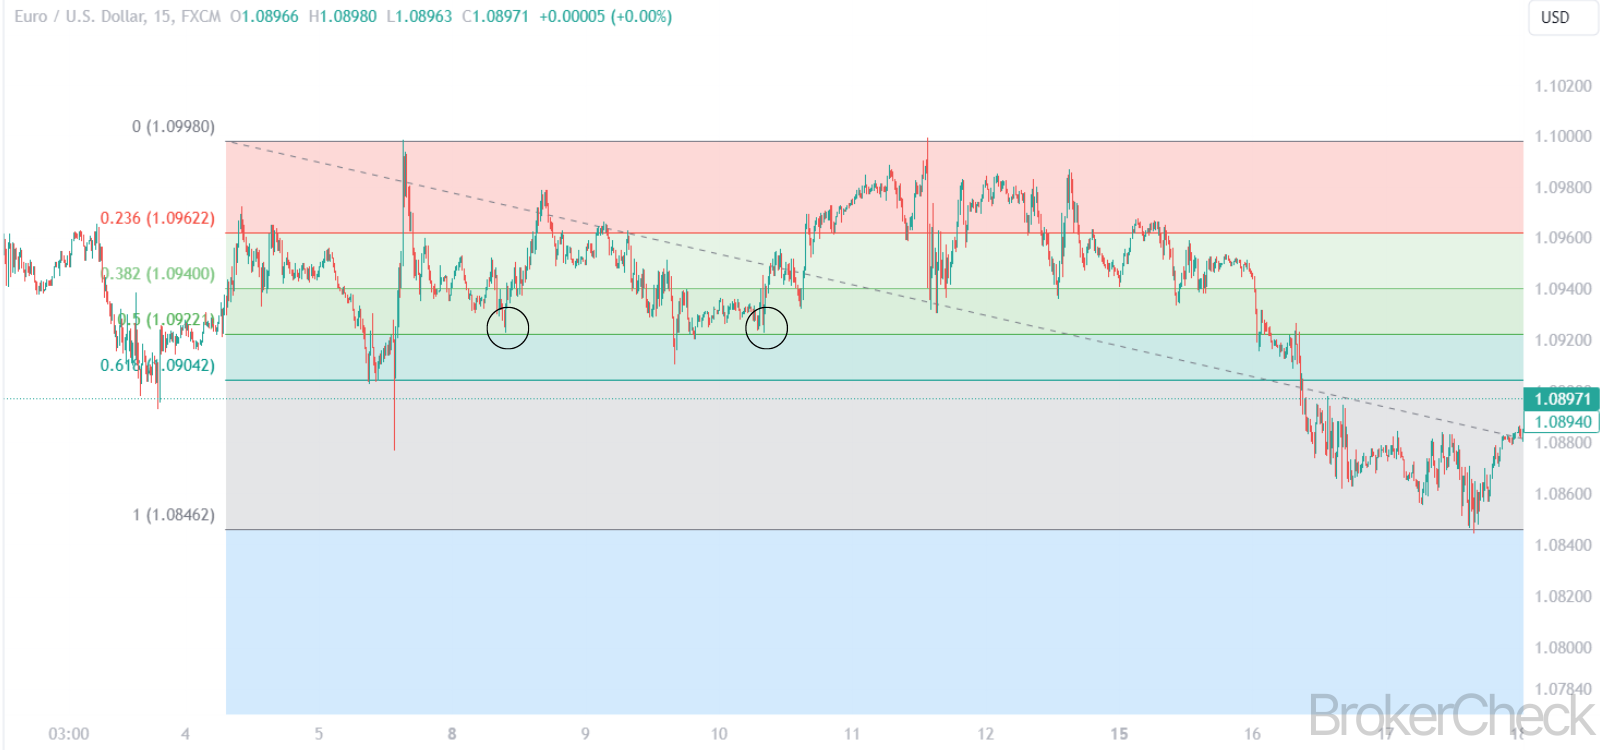
Understanding the interpretation of Auto Fibonacci Retracement levels is crucial for identifying potential trading signals. These levels are seen as key areas where the price might stall or reverse.
4.2. Identifying Support and Resistance
- Support in Uptrends: In an uptrend, Fibonacci levels act as potential support zones where the price might bounce back up.
- Resistance in Downtrends: Conversely, in a downtrend, these levels can act as resistance areas where the price might face downward pressure.
4.3. Trading Signals in Different Market Conditions
- Trend Reversals: A bounce from a Fibonacci level in the direction of the prevailing trend can be interpreted as a potential reversal point, signaling an entry or exit.
- Trend Continuations: A break through a Fibonacci level might indicate the continuation of the current trend, suggesting a potential trade in the direction of the break.
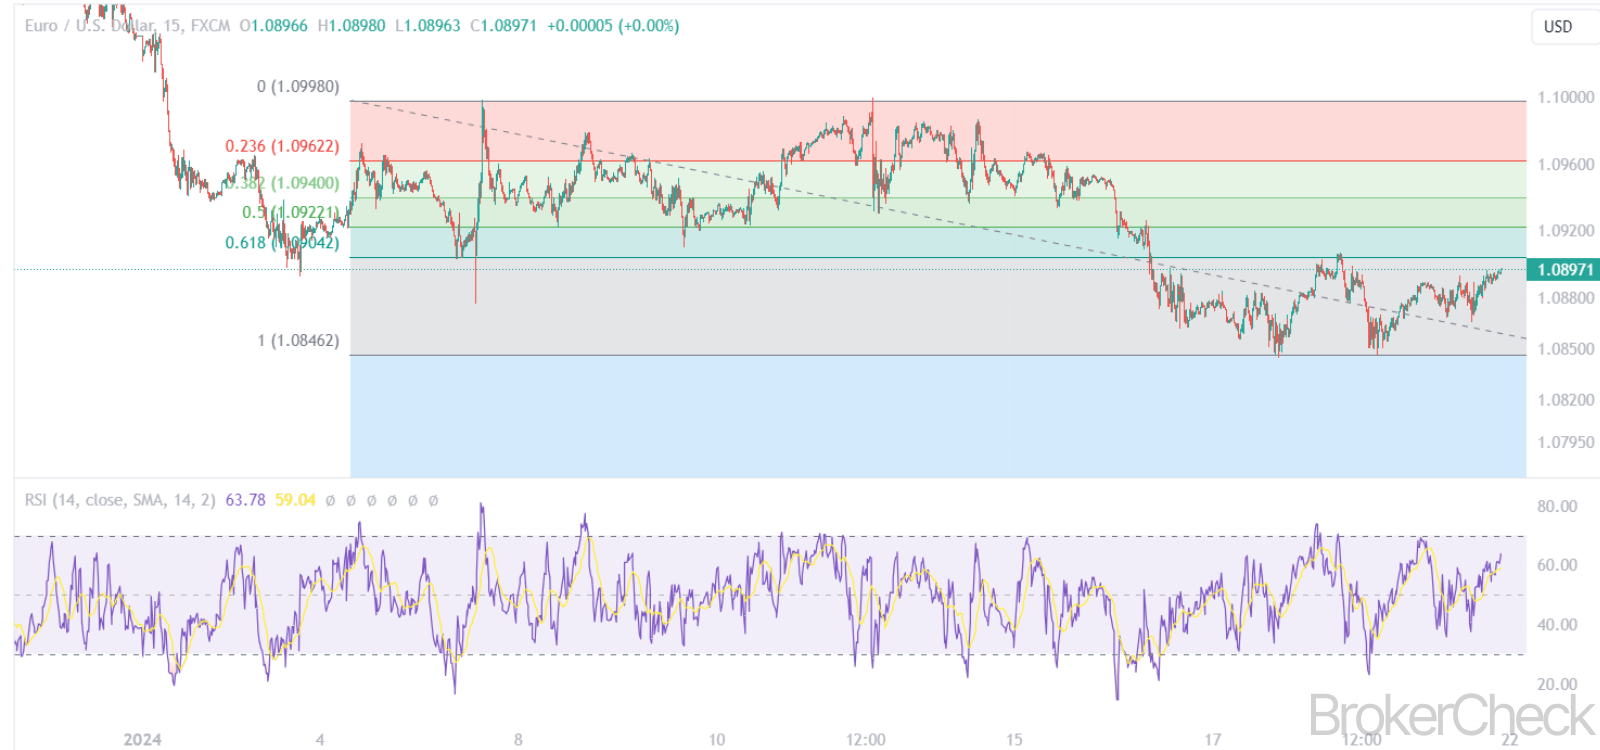
4.4. Confluence with Other Indicators
Combining Fibonacci levels with other technical indicators can enhance the reliability of the signals. For example, a RSI divergence at a key Fibonacci level might strengthen the reversal signal.
4.5. Candlestick Patterns and Fibonacci Levels
The presence of certain candlestick patterns, like a hammer or a shooting star, at a Fibonacci retracement level can provide additional confirmation for entry or exit points.
4.6. Setting Stop Losses and Take Profits
- Stop Losses: Placing stop losses just beyond the Fibonacci level can limit potential losses if the market moves against the trade.
- Take Profits: Setting take-profit orders near Fibonacci levels in the direction of the trend can optimize profit-taking.
4.7. Psychological Aspect
Fibonacci levels often coincide with psychological price levels, making them more effective due to collective market psychology.
| Aspect | Description |
| Support/Resistance | Fibonacci levels act as potential support in uptrends and resistance in downtrends |
| Trend Reversals | Bounces from levels indicate potential reversal points |
| Trend Continuations | Breakthroughs suggest continuation of the current trend |
| Confluence with Indicators | Increased signal reliability when combined with other indicators |
| Candlestick Patterns | Patterns at Fibonacci levels provide additional signal confirmation |
| Stop Losses/Take Profits | Important for risk management and optimizing profit-taking |
| Psychological Impact | Effectiveness enhanced due to collective market psychology |
5. Combining Auto Fibonacci Retracement with Other Indicators
5.1. The Synergy of Technical Indicators
Combining the Auto Fibonacci Retracement with other technical indicators can enhance trading strategies by providing more robust signals and deeper market insights.
5.2. Moving Averages
- Function: Moving averages smooth out price data to identify the trend direction.
- Combination Strategy: Use Fibonacci retracement levels to identify potential reversal points within the broader trend indicated by moving averages.
5.3. Relative Strength Index (RSI)
- Function: RSI measures the magnitude of recent price changes to evaluate overbought or oversold conditions.
- Combination Strategy: Look for divergences between RSI and price at Fibonacci levels. For example, if the price reaches a key Fibonacci level but RSI does not confirm the trend, it may indicate a potential reversal.
5.4. MACD (Moving Average Convergence Divergence)
- Function: MACD is used to spot changes in the strength, direction, momentum, and duration of a trend.
- Combination Strategy: Use MACD to confirm the strength of the trend at Fibonacci retracement levels. A strong MACD signal in line with a Fibonacci support or resistance level can confirm entry or exit points.
5.5. Bollinger Bands
- Function: These bands measure market volatility and provide relative high and low price levels.
- Combination Strategy: When price touches or breaches a Bollinger Band and aligns with a Fibonacci level, it can signal a strong reversal or continuation pattern.
5.6. Stochastic Oscillator
- Function: This momentum indicator compares a particular closing price of a security to a range of its prices over a certain period of time.
- Combination Strategy: Use the stochastic oscillator to identify overbought or oversold conditions at key Fibonacci levels for potential entry and exit points.
5.7. Candlestick Patterns
- Function: Candlestick patterns can indicate potential market reversals or trend continuations.
- Combination Strategy: Look for bullish or bearish candlestick patterns at Fibonacci retracement levels to enhance the predictive power of potential reversal or continuation.
| Indicator | Function | Combination Strategy with Fibonacci |
| Moving Averages | Trend Identification | Identify reversal points within trends |
| RSI | Overbought/Oversold Conditions | Divergence analysis at Fibonacci levels |
| MACD | Trend Strength and Momentum | Confirm trend strength at Fibonacci levels |
| Bollinger Bands | Market Volatility | Reversal or continuation signals at band and Fibonacci levels |
| Stochastic Oscillator | Momentum and Condition | Overbought/Oversold analysis at Fibonacci levels |
| Candlestick Patterns | Reversal/Continuation Signals | Enhanced signal reliability at Fibonacci levels |
6. Risk Management with Auto Fibonacci Retracement
6.1. Importance of Risk Management in Trading
Effective risk management is crucial in trading to preserve capital and ensure longevity in the market. The Auto Fibonacci Retracement tool, while powerful, should be used within a comprehensive risk management strategy.
6.2. Setting Stop-Loss Orders
- Strategic Placement: Stop-loss orders should be placed just beyond the Fibonacci levels. For instance, in an uptrend, a stop-loss can be placed slightly below a key Fibonacci support level.
- Adjusting to Volatility: In more volatile markets, wider stop-loss margins might be necessary to avoid being prematurely stopped out.
5.3. Position Sizing
- Calculating Risk per Trade: It’s essential to determine the amount of capital at risk per trade. A common strategy is to risk no more than a certain percentage of the trading account on a single trade.
- Using Fibonacci Levels for Sizing: The distance between the entry point and the stop-loss level at a Fibonacci retracement can guide the position size.
6.4. Take-Profit Levels
- Setting Realistic Targets: Take-profit levels can be set at key Fibonacci levels in the direction of the trend. For example, in an uptrend, taking profit at a higher Fibonacci level can be a strategy.
- Trailing Stops: Implementing a trailing stop strategy can help in securing profits while giving the trade room to run.
6.5. Diversification and Correlation
- Avoiding Correlated Assets: Using the Auto Fibonacci Retracement across highly correlated assets can increase risk. Diversification is key.
- Asset Allocation: Spread risk across different asset classes and instruments.
6.6. Combining with Other Risk Management Tools
- Using Other Indicators: Combine Fibonacci retracement with other indicators like moving averages or RSI for better risk assessment.
- Fundamental Analysis: Staying aware of economic events and news that can affect market volatility is also crucial.
| Strategy | Description |
| Stop-Loss Orders | Placed just beyond Fibonacci levels, adjusted for volatility |
| Position Sizing | Based on the distance between entry and stop-loss at Fibonacci level |
| Take-Profit Levels | Set at key Fibonacci levels in trend direction, use of trailing stops |
| Diversification | Avoiding correlated assets, spreading risk across asset classes |
| Combining with Tools | Use alongside other technical indicators and fundamental analysis |